Download presentation
Presentation is loading. Please wait.

1
Hands-On Material From National Instruments Introduction to LabVIEW Electrical Wiring Music Instrument ENGR 100 Section C

2
Course Goals Become comfortable with the LabVIEW environment and data flow execution Ability to use LabVIEW to integrate HW/SW and create your personal music instrument. LabVIEW Concepts Find and use math and complex analysis functions Work with data types, such as Boolean, integer, and Displaying ENGR 100 Section C

3
Music Instrument Project ENGR 100 Section C Pitch / Gain

4
LabVIEW Graphical Development System Graphical Programming Environment Compile code for multiple OS and devices Useful in a broad range of applications ENGR 100 Section C

5
The NI Approach – Integrated Hardware Platforms High-Speed Digitizers High-Resolution Digitizers and DMMs Multifunction Data Acquisition Dynamic Signal Acquisition Digital I/O Instrument Control Counter/ Timers Machine Vision Motion Control Distributed I/O and Embedded Control Laptop PC PDA Desktop PC PXI Modular Instrumentation Signal Conditioning and Switching Unit Under Test ENGR 100 Section C

6
Section I – LabVIEW Environment A. Getting Data into your Computer Data Acquisition Devices – NI-DAQ – Simulated Data Acquisition – Sound Card B. LabVIEW Environment Front Panel / Block Diagram Toolbar /Tools Palette C. Components of a LabVIEW Application Creating a VI Data Flow Execution D. Additional Help Finding Functions Tips for Working in LabVIEW ENGR 100 Section C

7
A. Setting Up Your Hardware Data Acquisition Device (DAQ) Actual USB, PCI, or PXI Device Configured in MAX Simulated Data Acquisition Device (DAQ) Software simulated at the driver level Configured in MAX Sound Card Built into most computers ENGR 100 Section C
 Actual USB, PCI, or PXI Device Configured in MAX Simulated Data Acquisition Device (DAQ) Software simulated at the driver level Configured in MAX Sound Card Built into most computers ENGR 100 Section C.")
8
What type of device should I use? Sound Card*NI USB DAQNI PCI DAQ Instruments* AI Bandwidth 8–44 KS/s10–200 KS/s250 K–1.2 Ms/s20kS/s–2 GS/s Accuracy 12–16 bit 14–18 bit12–24 bit Portable xx—some AI Channels 28–1616–802 AO Channels 21–22–40 AC or DC ACAC/DC Triggering —xxx Calibrated —xxx * The above table may not be representative of all device variations that exist in each category ENGR 100 Section C

9
What is MAX? MAX stands for Measurement & Automation Explorer. MAX configures and organizes all your National Instruments DAQ, PCI/PXI instruments, GPIB, IMAQ, IVI, Motion, VISA, and VXI devices. Used for configuring and testing devices. Icon Found on Windows Desktop ENGR 100 Section C

10
Exercise 1 – Setting Up Your Device Use Measurement and Automation Explorer (MAX) to: Configure and test your Simulated Data Acquisition (DAQ) device Track B ENGR 100 Section C
 to: Configure and test your Simulated Data Acquisition (DAQ) device Track B ENGR 100 Section C")
11
Start»All Programs»National Instruments LabVIEW 8.6 Startup Screen: Start from a Blank VI: New» Blank VI Start from an Example: Examples»Find Examples… » or Open and Run LabVIEW ENGR 100 Section C

12
Each VI has 2 Windows Front Panel User Interface (UI) –Controls = Inputs –Indicators = Outputs Block Diagram Graphical Code –Data travels on wires from controls through functions to indicators –Blocks execute by Dataflow LabVIEW Programs Are Called Virtual Instruments (VIs) ENGR 100 Section C
 –Controls = Inputs –Indicators = Outputs Block Diagram Graphical Code –Data travels on wires from controls through functions to indicators –Blocks execute by Dataflow LabVIEW Programs Are Called Virtual Instruments (VIs) ENGR 100 Section C")
13
Controls Palette (Controls & Indicators) (Place items on the Front Panel Window) Indicator: Numeric Slide Control: Numeric Customize Palette View ENGR 100 Section C
 (Place items on the Front Panel Window) Indicator: Numeric Slide Control: Numeric Customize Palette View ENGR 100 Section C")
14
Functions (and Structures) Palette (Place items on the Block Diagram Window) Structure: While Loop ENGR 100 Section C
 Palette (Place items on the Block Diagram Window) Structure: While Loop ENGR 100 Section C")
15
Recommended: Automatic Selection Tool Tools to operate and modify both front panel and block diagram objects Operating Tool Positioning/Resizing Tool Labeling Tool Wiring Tool Tools Palette Automatic Selection Tool Automatically chooses among the following tools: ENGR 100 Section C

16
Run Button Continuous Run Button Abort Execution Execution Highlighting Button Additional Buttons on the Diagram Toolbar Status Toolbar Retain Wire Values Button Step Function Buttons ENGR 100 Section C

17
Block Diagram Window Front Panel Window Demonstration 1: Creating a VI Input Terminals Output Terminal Boolean Control Graph Indicator ENGR 100 Section C

18
Block diagram execution –Dependent on the flow of data –Block diagram does NOT execute left to right Node executes when data is available to ALL input terminals Nodes supply data to all output terminals when done Dataflow Programming ENGR 100 Section C

19
Debugging Techniques Finding Errors Execution Highlighting Probes Click on broken Run button. Window showing error appears. Click on Execution Highlighting button; data flow is animated using bubbles. Values are displayed on wires. Right-click on wire to display probe and it shows data as it flows through wire segment. You can also select Probe tool from Tools palette and click on wire. ENGR 100 Section C

20
Context Help Window Help»Show Context Help, press the keys Hover cursor over object to update window Additional Help –Right-Click on the VI icon and choose Help, or –Choose “ Detailed Help.” on the context help window ENGR 100 Section C

21
Tips for Working in LabVIEW Keystroke Shortcuts – Activate/Deactivate Context Help Window – Remove Broken Wires From Block Diagram – Toggle Between Front Panel and Block Diagram – Undo (Also in Edit Menu) Tools»Options… – Set Preferences in LabVIEW VI Properties–Configure VI Appearance, Documentation, etc. ENGR 100 Section C

22
Section II – Elements of Typical Programs A. Loops While Loop For Loop B. Functions and SubVIs Types of Functions Creating Custom Functions (SubVI) Functions Palette & Searching C. Decision Making and File IO Case Structure Select (simple If statement) File I/O ENGR 100 Section C
 Functions Palette & Searching C. Decision Making and File IO Case Structure Select (simple If statement) File I/O ENGR 100 Section C.")
23
Loops While Loops i terminal counts iteration Always runs at least once Runs until stop condition is met For Loops –i terminal counts iterations –Run according to input N of count terminal While Loop For Loop ENGR 100 Section C

24
Drawing a Loop 1. Select the structure 2. Enclose code to be repeated 3. Drop or drag additional nodes and then wire ENGR 100 Section C

25
3 Types of Functions (from the Functions Palette) Express VIs: interactive VIs with configurable dialog page (blue border) Standard VIs: modularized VIs customized by wiring (customizable) Functions: fundamental operating elements of LabVIEW; no front panel or block diagram (yellow) ENGR 100 Section C
 Express VIs: interactive VIs with configurable dialog page (blue border) Standard VIs: modularized VIs customized by wiring (customizable) Functions: fundamental operating elements of LabVIEW; no front panel or block diagram (yellow) ENGR 100 Section C")
26
What Types of Functions are Available? Input and Output Signal and Data Simulation Acquire and Generate Real Signals with DAQ Instrument I/O Assistant (Serial & GPIB) ActiveX for communication with other programs Analysis Signal Processing Statistics Advanced Math and Formulas Continuous Time Solver Storage File I/O Express Functions Palette ENGR 100 Section C
 ActiveX for communication with other programs Analysis Signal Processing Statistics Advanced Math and Formulas Continuous Time Solver Storage File I/O Express Functions Palette ENGR 100 Section C.")
27
Searching for Controls, VIs, and Functions Palettes are filled with hundreds of VIs Press the search button to index the all VIs for text searching Click and drag an item from the search window to the block diagram Double-click an item to open the owning palette ENGR 100 Section C

28
Create SubVI Enclose area to be converted into a subVI. Select Edit»Create SubVI from the Edit Menu. ENGR 100 Section C C 2 F

29
LabVIEW Functions and SubVIs operate like Functions in other languages Function Pseudo Code function average (in1, in2, out) { out = (in1 + in2)/2.0; } SubVI Block Diagram Calling Program Pseudo Code main { average (in1, in2, pointavg) } Calling VI Block Diagram ENGR 100 Section C
 { out = (in1 + in2)/2.0; } SubVI Block Diagram Calling Program Pseudo Code main { average (in1, in2, pointavg) } Calling VI Block Diagram ENGR 100 Section C")
30
Connector Pane and Icon Viewer Use this connector pane layout as a standard Top terminals are usually reserved for file paths and references, such as a file reference Bottom terminals are usually reserved for error clusters

31
Icon Viewer – Create an Icon Create custom icons by right-clicking the icon in the upper-right corner of the front panel or block diagram and selecting Edit Icon or by double-clicking the icon You also can drag a graphic from anywhere in your file system and drop it on the icon Refer to the Icon Art Glossary at ni.com for standard graphics to use in a VI icon Icon Art Glossary

32
Exercise 3.1 – Analysis Track A,B,&C Use LabVIEW Express VIs to: –Simulate a signal and display its amplitude and frequency This exercise should take 15 minutes. ENGR 100 Section C

33
How Do I Make Decisions in LabVIEW? 1. Case Structures 2. Select (a) Boolean (b) Numeric (d) ENGR 100 Section C (c) string
 Boolean (b) Numeric (d) ENGR 100 Section C (c) string.")
34
Case structure ENGR 100 Section C Homework Practice Problem 1 Create the required VI(s) to achieve the following tasks. Requirements: 1.Create a basic calculator function with the ability to add, subtract, multiply, and divide two numbers and display the output 2.Allow the program to keep on running until a stop button is pressed.

35
File I/O File I/O – passing data to and from files Files can be binary, text, or spreadsheet Write/Read LabVIEW Measurements file (*.lvm) Writing to LVM file Reading from LVM file ENGR 100 Section C spreadsheet-formatted files
 Writing to LVM file Reading from LVM file ENGR 100 Section C spreadsheet-formatted files")
36
File I/O Programming Model – Under the Hood Open/ Create/ Replace File Read and/or Write to File Close File Check for Errors File I/O>>Write to Spreadsheet File

37
Section III – Presenting your Results A. Displaying Data on the Front Panel Controls and Indicators Graphs and Charts Loop Timing B. Signal Processing MathScript Arrays Clusters Waveforms ENGR 100 Section C

38
What Types of Controls and Indicators are Available? Numeric Data Number input and display Analog Sliders, Dials, and Gauges Boolean Data Buttons and LEDs Array & Matrix Data Numeric Display Chart Graph XY Graph Intensity Graph 3D graph: point, surface, and model Decorations Tab Control Arrows Other Strings and text boxes Picture/Image Display ActiveX Controls Express Controls Palette ENGR 100 Section C

39
Charts – Add 1 data point at a time with history Waveform chart – special numeric indicator that can display a history of values Chart updates with each individual point it receives Functions»Express»Graph Indicators»Chart ENGR 100 Section C

40
Graphs – Display many data points at once Waveform graph – special numeric indicator that displays an array of data Graph updates after all points have been collected May be used in a loop if VI collects buffers of data Functions»Express»Graph Indicators»Graph ENGR 100 Section C

41
Graph and Chart (history length) Homework Practice Problem 2 Requirements: 1.Create a VI which runs exactly 50 times or until a stop button is pushed 2.At each intervals, it generates a random number between 50 and 100. 3.Display the random number on a waveform chart.

42
ENGR 100 Section C Shift registers (Moving Average) Homework Practice Problem 3 Requirements: 1.Modify the Previous Practice Problem so that the total sum of all the random numbers generated is displayed 2.Using another shift register to have moving average of three numbers 3.Plot moving average and original random number in the waveform chart, i.e. two curves in one chart. (Hint: use “bundle” in cluster pallets

43
Loops can accumulate arrays at their boundaries with auto-indexing For Loops auto-index by default While Loops output only the final value by default Right-click tunnel and enable/disable auto- indexing Building Arrays with Loops (Auto-Indexing) Wire becomes thicker Wire remains the same size Auto-Indexing Disabled Auto-Indexing Enabled Only one value (last iteration) is passed out of the loop 1D Array 0 1 2 3 4 5 5 ENGR 100 Section C
 Wire becomes thicker Wire remains the same size Auto-Indexing Disabled Auto-Indexing Enabled Only one value (last iteration) is passed out of the loop 1D Array ENGR 100 Section C")
44
Creating an Array (Step 1 of 2) From the Controls»Modern»Array, Matrix, and Cluster subpalette, select the Array icon. Drop it on the Front Panel. ENGR 100 Section C

45
Create an Array (Step 2 of 2) 1. Place an Array Shell. 2. Insert datatype into the shell (i.e. Numeric Control). ENGR 100 Section C Practice: 2D array?
. ENGR 100 Section C Practice: 2D array .")
46
Array ENGR 100 Section C Homework Practice Problem 4 Requirements: 1.Generate an array of 20 random numbers. 2.Find the maximum, minimum, and mean of the array using a shift register. 3.Modify the array by multiplying the fifth element by 5

47
How Do I Time a Loop? 1. Loop Time Delay Configure the Time Delay Express VI for seconds to wait each iteration of the loop (works on For and While loops). 2. Timed Loops Configure special timed While loop for desired dt. Timed LoopTime Delay ENGR 100 Section C
. 2. Timed Loops Configure special timed While loop for desired dt. Timed LoopTime Delay ENGR 100 Section C.")
48
Control & Indicator Properties Properties are characteristics or qualities about an object Properties can be found by right clicking on a Control or Indicator Properties Include: – Size – Color – Plot Style – Plot color Features include: – Cursors – Scaling ENGR 100 Section C

49
Math with the MathScript Node Implement equations and algorithms textually Input and Output variables created at the border Generally compatible with popular m-file script language Terminate statements with a semicolon to disable immediate output Prototype your equations in the interactive MathScript Window. (Functions»Programming » Structures » MathScript) ENGR 100 Section C
 ENGR 100 Section C.")
50
The Interactive MathScript Window Rapidly develop and test algorithms (LabVIEW » Tools » MathScript Window) Output Window Variable Workspace View/Modify Variable Contents User Commands m-file Script Share Scripts and Variables with the Node View /Modify Variable content in 1D, 2D, and 3D ENGR 100 Section C
 Output Window Variable Workspace View/Modify Variable Contents User Commands m-file Script Share Scripts and Variables with the Node View /Modify Variable content in 1D, 2D, and 3D ENGR 100 Section C")
51
Formula Node Practice Homework Practice Problem 5 Requirements: 1.Create a formula node which has 3 inputs(X, Y, Z) and one output. If X>Y output Z, otherwise output 0. 2.Create a subVI which performs the same task as the formula node. (Hint: Use the selection function found in the comparison palette) Structure>>formula node
 Structure>>formula node.")
52
Review of Data Types Found in LabVIEW ENGR 100 Section C

53
DAQ Real World Signal Pressure, Temperature, Distance, Light Sensors Signal Conditioning Voltage Current A/D Convertor D/A Convertor Power Amp Transducer Power Amp Transducer Digital World Signal Processing

54
DAQ Practice ENGR 100 Section C DAQ Assistant Express VI Conti Acq&Graph Voltage int Clk.vi Homework Practice Problem 6 Requirements: 1.Create a data acquisition task which reads data from the audio input on your MyDAQ using the low level DAQmx functions 2.Display the signal on a waveform chart 3.After collecting this data write it to a comma separated file using the Read From Measurement File express VI.

55
MyDAQ ENGR 100 Section C USB Cable 20-Position Screw Terminal Connector Audio Cable DMM Banana Cable

56
MyDAQ ENGR 100 Section C

57
Soft Front Panel (SFP) ENGR 100 Section C
 ENGR 100 Section C")
58
Fun Generator ENGR 100 Section C

62
D I/O ENGR 100 Section C

63
MyDAQ ENGR 100 Section C 1.Create an audio loopback program using the MyDAQ. Read the signal from audio in port and output it to the audio out port. Stop the loop when a user pushes a stop button 2.Display the acquired signal on a graph. 2V

64
State Machines 1. While Loop 2. Shift Register 3. Case Structure

65
State Machines Transitions Several programming techniques exist for transitioning from state to state in LabVIEW using state machines Default transition implies that after one state, another state always follows Transitions between two potential states can be handled by a select function

66
State Machine ENGR 100 Section C Homework Practice Problem 7 Vending Machine (15 cents Gum): 1.Create a state machine driven program which follows the following state diagram 2.Send user message via Display monitor at each state. (Hint: totally 5 states and 2 transition conditions) Insert Change Insert 10 Cents Insert 5 Cents Collect GumCollect Gum/Change
 Insert Change Insert 10 Cents Insert 5 Cents Collect GumCollect Gum/Change.")
67
Communicating between Loops Communicating between loops using data flow is not possible The left loop executes completely before the right loop Variables are needed when communication with wires does not give the desired behavior

68
Local Variables Local Variables allow data to be passed between parallel loops. A single control or indicator can be read or written to from more than one location in the program – Local Variables break the dataflow paradigm and should be used sparingly

69
Creating a Local Variable - Walk Through In this example we will see how Local Variables allow us to share data between parallel loops. We will create a program that toggles two separate LEDs using one switch. It also stops two loops with one button. Create the block diagram and front panel show in the notes.

70
Creating Local Variables Right-click on the Stop Button in the Front Panel and change the Mechanical Action to “Switch When Released” since Local Variables cannot store Latched data.

71
Producer/Consumer Design Pattern

72
Introduction to Clusters Data structure that groups data together Data may be of different types Analogous to struct in ANSI C Elements must be either all controls or all indicators Thought of as wires bundled into a cable Order is important

73
Creating a Cluster 1. Select a Cluster shell. 2. Place objects inside the shell. Controls»Modern»Array, Matrix & Cluster

74
Cluster Functions In the Cluster & Variant subpalette of the Programming palette Can also be accessed by right-clicking the cluster terminal Bundle (Terminal labels reflect data type) Bundle By Name
 Bundle By Name")
75
Using Arrays and Clusters with Graphs The waveform data type contains 3 pieces of data: t0 = Start time dt = Time between samples Y = Array of Y magnitudes You can create a waveform cluster in two ways: Build Waveform (absolute time)Cluster (relative time)
Cluster (relative time)")
76
Switch LEVITION 3-Way Switch4-Way Switch 2-Way Switch ENGR 100 Section C

77
Single 2-Way Switch Layout ENGR 100 Section C

78
3-3 Switch Layout ENGR 100 Section C

79
3-4-3 Switch Layout ENGR 100 Section C

80
Logic Gate ENGR 100 Section C

81
Logic Gate ENGR 100 Section C

82
Logic Gate ENGR 100 Section C

83
Logic Gate ENGR 100 Section C

84
2-Way Logic Switch ENGR 100 Section C

85
2 2-Way Switch (Logic AND) Layout ENGR 100 Section C
 Layout ENGR 100 Section C")
86
Logic Switch AND OR EOR(XOR)… ENGR 100 Section C
… ENGR 100 Section C")
87
3-Way Logic Switch 1 Input 2 Output v.s. 2 Input 1 Output ENGR 100 Section C

88
2 3-Way Switch (Logic ?) Layout ENGR 100 Section C
 Layout ENGR 100 Section C")
89
Assignment: 4-Way Switch and 3-4-3 Switch Layout ENGR 100 Section C

90
3 Phase Power Source ENGR 100 Section C

91
Light Bulb ENGR 100 Section C

92
2-Way Switch LEVITION ENGR 100 Section C

93
2 2-Way Switch (Logic AND) Layout ENGR 100 Section C
 Layout ENGR 100 Section C")
94
3-Way Switch (1 Input 2 Outputs) LEVITION ENGR 100 Section C
 LEVITION ENGR 100 Section C")
95
3-Way Switch (2 Inputs 1 Output) LEVITION ENGR 100 Section C
 LEVITION ENGR 100 Section C")
96
4-Way Switch LEVITION ENGR 100 Section C

97
Electrical Wiring Memo Requirements Remember to use memo format and use proper spelling and grammar. Questions: 1. If you have more than one entrance to a room, it's handy to have more than one switch to turn the light on and off. Can you figure out other way to connect two switches and explain the current flow across the switches? 2. Can you do the three switches configuration? How many different ways of wiring can you come up with? 3. Figure out switch layout configurations for logic AND, OR, NAND, XOR, and NXOR. ENGR 100 Section C

98
Music Instrument Project ENGR 100 Section C Pitch / Gain

99
Digital I/O Hysteresis ENGR 100 Section C Analog signal Vin(t) Digital signal 01011… Pull down resistor +5v Contact bounce
 Digital signal 01011… Pull down resistor +5v Contact bounce")
100
Equal temperament Fnm=f0*2^((n/12)+m-4) The vast majority of Western music is based on the tuning system called equal temperament in which the octave interval (a 2:1 ratio in frequency) is equally subdivided into 12 subintervals called semitones. ENGR 100 Section C A4 Concert A 440Hz(m=4,n=0) C4 Octave A5 880Hz (m=4,n=12)or (m=5,n=0)
 C4 Octave A5 880Hz (m=4,n=12)or (m=5,n=0).")
101
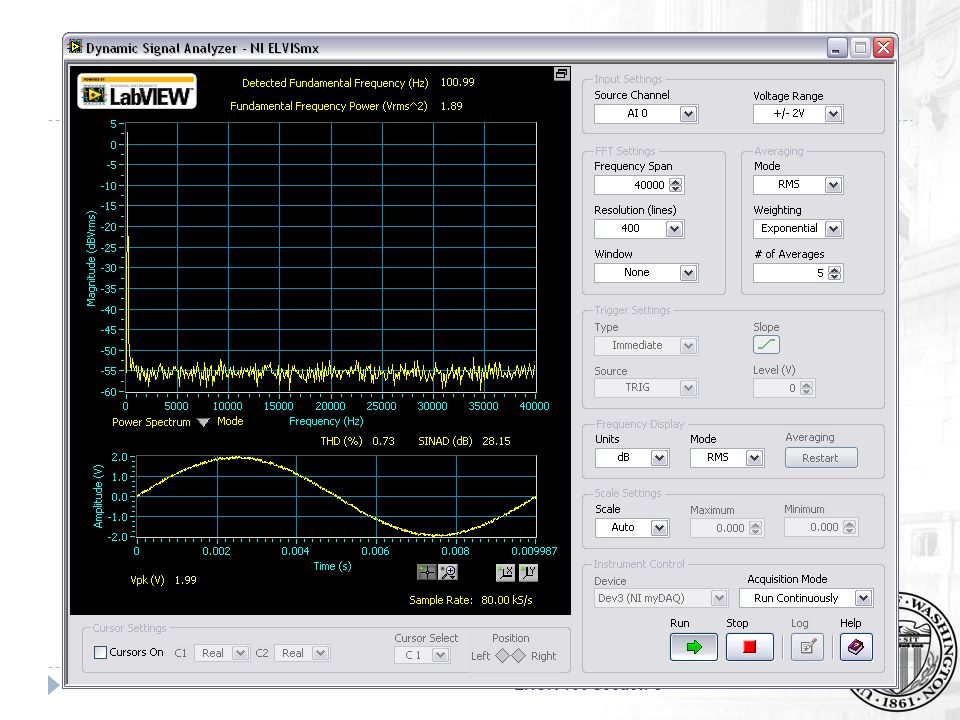
Sine Wave VI ENGR 100 Section C

103
Play music via Laptop audio chip Using “Play Waveform” Express VI Graph & Sound>>Sound>>Output>>Play Waveform Signal Process>>Sig Generation>>Sine Wave Waveform>>Build Waveform ENGR 100 Section C

105
Play music Using low level Sound output VI Graphics& Sound>>Sound>>Output>>Configure Graphics& Sound>>Sound>>Output>>Write Graphics& Sound>>Sound>>Output>>Clear Signal Process>>Signal Generation>>Sine Wave ENGR 100 Section C

106
Play music ENGR 100 Section C Homework Practice Problem 8 Procedure: Create the required VI(s) to play sound at certain freq. Requirements: 1.Modify the play music using express vi with Sampling Frequency (=44.1kHz), A4 Concert Frequency (f0=440 Hz), Duration(=0.1s), Frequency fnm (=f0*2^((n/12)+m-4)), numeric control n (integer 0~12), m(integer 0~12) 2.Add a while loop and shift register so that the sound will be played when the value of frequency fnm is changed.
, A4 Concert Frequency (f0=440 Hz), Duration(=0.1s), Frequency fnm (=f0*2^((n/12)+m-4)), numeric control n (integer 0~12), m(integer 0~12) 2.Add a while loop and shift register so that the sound will be played when the value of frequency fnm is changed..")
107
Simple Read /Write.wav Files ENGR 100 Section C Graphics& Sound>>Sound>>Files>>Simple Read Graphics& Sound>>Sound>>Files>>Simple Write Graphics& Sound>>Sound>>Files>>Info

108
Create 2 channel wave file Signal Processing>>Signal Generation>> Sine Wave Signal Processing>>Signal Generation>> Uniform Noise Signal Processing>>Signal Generation >>Quick scale (Scale audio signal to +/- 1 range before saving to a.wav file) ENGR 100 Section C Free wave editor tool: Audacity
 ENGR 100 Section C Free wave editor tool: Audacity")
109
Property and Invoke Nodes Create Property and Invoke nodes for a VI element by right- clicking the element and selecting Create»Property Node. Use the Property Node to get and set object properties. Invoke object methods with the Invoke Node.

110
Play music file using ActiveX Windows media player ENGR 100 Section C

111
Property Nodes WMPLib.IWMPPlayer4 ENGR 100 Section C (File location, Controls)
")
112
Invoke Node Invoke Method of controls (Play, Pause) ENGR 100 Section C
 ENGR 100 Section C")
113
Invoke Node Invoke Method of WMPLib.IWMPPlayer4 ENGR 100 Section C (Close WMPlayer)
")
114
Close Active X reference ENGR 100 Section C

115
Example (Play, Pause two music files) ENGR 100 Section C
 ENGR 100 Section C")
116
Music Instrument Switch (Digital) Key board Play with Hand/Pam/Foot/ Whole Body? ENGR 100 Section C DI0 DI1 DI2 DI3 DI4 DI5. 5V DC

117
Music Instrument Switch (Analog) Voltage /Current Variation Capacitance Variation Inductance Variation Resistance Variation(Potentiometer) Distance Variation Acoustic Sensor Microphone Optical Sensor (Photo-Diode + Opamp) Optical Theremin ENGR 100 Section C
 Voltage /Current Variation Capacitance Variation Inductance Variation Resistance Variation(Potentiometer) Distance Variation Acoustic Sensor Microphone Optical Sensor (Photo-Diode + Opamp) Optical Theremin ENGR 100 Section C")
Similar presentations