Download presentation
Presentation is loading. Please wait.

1
How well are we doing in preventing HIV and how can we do better?
Peter Piot Institute for Global Health Global HIV/AIDS vaccine enterprise

2
PREVENTION WORKS BUT...

3
Community mobilisation, Thailand’s 100% Condom Program
Pilot in Ratchaburi province Implementation on a national scale Structural approaches that have sought to reduce the HIV vulnerability of sex workers have ranged from policies to enforce condom use to programmes that sought to build solidarity among and empower sex workers. Assessment of the 100% condom use policy in Thailand revealed that condom use climbed to over 90% (figure 3).40 Similar outcomes were reported from a more recent study of the effect of a 100% condom use policy combined with efforts to build community solidarity among sex workers in Puerto Plata in the Dominican Republic (panel 4).41 Figure 3 Full-size image (42K) Increase in condom use reported by sex workers in sentinel serosurveillance Reproduced with permission form UNAIDS.40 Proportion of condom use with Reported STD nationally recent clients Source: UNAIDS Case Study: Evaluation of the 100% Condom Programme in Thailand, 2000.
.40 Similar outcomes were reported from a more recent study of the effect of a 100% condom use policy combined with efforts to build community solidarity among sex workers in Puerto Plata in the Dominican Republic (panel 4).41. Figure 3 Full-size image (42K) Increase in condom use reported by sex workers in sentinel serosurveillance. Reproduced with permission form UNAIDS.40. Proportion of condom use with Reported STD nationally. recent clients. Source: UNAIDS Case Study: Evaluation of the 100% Condom Programme in Thailand,")
4
HIV Prevalence Declines in Pregnant Women
As this slide shows, there have also been declines in HIV prevalence in pregnant women in recent years. There are a number of effective HIV prevention methods available today, including safer sex, safer injection practices, condom use, and male circumcision. There are, however, also social obstacles attached to each of these. And we have seen that, even when these interventions are fully funded and supported by states and social institutions, they have only been able to drive HIV infection rates down to a certain level. In order to further reduce HIV incidence we need new biomedical tools -- the most important of these will be an effective HIV vaccine. Source: National surveillance reports and UNAIDS/WHO/UNICEF, Epidemiological Fact Sheets on HIV and AIDS. July 2008.

5
Behavioural change, impact in urban and semi-urban Zimbabwe
M1: assuming behavioural change, better fit to surveillance data Natural decline in incidence ~1990 Accelerated decline in incidence, due to behaviour change ~2000 M0: without behavioural change Fitted models for Zimbabwe data in urban and semi-urban areas. The posterior modal simulation is plotted for model M0 (without behaviour change: dashed blue line); and for model M1 (with behaviour change: solid black line). The prevalence data are also shown as grey crosses and lines. HIV incidence (per 100 person years at risk) for the entire posterior sample of simulations is plotted. Each thin grey line is one simulation, the thick red line is the mode, and the dashed black lines show the 2.5th and 97.5th percentiles of the distribution of prevalence. Source: Hallett TB, et al. Epidemics 2009;1(2):
; and for model M1 (with behaviour change: solid black line). The prevalence data are also shown as grey crosses and lines. HIV incidence (per 100 person years at risk) for the entire posterior sample of simulations is plotted. Each thin grey line is one simulation, the thick red line is the mode, and the dashed black lines show the 2.5th and 97.5th percentiles of the distribution of prevalence. Source: Hallett TB, et al. Epidemics 2009;1(2):")
6
R0 = β c D Basic reproductive rate Transmission probability
Mean duration of infection Condom use ART Microbicides PrEP PMTCT Circumcision Clean needles VCT ART Mean number of contacts VCT Behavioural change Substitution therapy

7
Effectiveness of condoms in preventing STIs including HIV
This review of prospective studies published identified evidence that consistent condom use is associated with reduced transmission in HIV Source: Holmes KK, et al. Bull World Health Organ. 2004;82(6):
:")
8
Source: UNAIDS, UNICEF & WHO, 2008; data provided by countries.
Number and percentage of HIV-positive pregnant women receiving antiretroviral prophylaxis 2004 2006 2005 Number of HIV-positive pregnant women receiving anti-retrovirals Year % of HIV-positive pregnant women receiving anti-retrovirals 5 30 35 15 20 25 40 10 2007 Only 35% of HIV positive pregnant women receiving ART Source: UNAIDS, UNICEF & WHO, 2008; data provided by countries.

9
Reduction of acquisition risk after male circumcision
(A) South Africa (B) Kenya (C) Uganda >50% reduction in risk of acquisition for men Infection-Free Probability Cumulative sero-incidence Cumulative probabilities of HIV detection Source: (A) Auvert B, et al. PLoS Med 2005;2(11): e298, (B) Bailey RC, et al. Lancet 2007; 369:643–656 and (C)Gray RH, et al. Lancet 2007; 369:657–666.
 South Africa. (B) Kenya. (C) Uganda. >50% reduction in risk of acquisition for men. Infection-Free Probability. Cumulative sero-incidence. Cumulative probabilities of HIV detection. Source: (A) Auvert B, et al. PLoS Med 2005;2(11): e298, (B) Bailey RC, et al. Lancet 2007; 369:643–656 and (C)Gray RH, et al. Lancet 2007; 369:657–666.")
10
RCT: Treatment of STIs Source: Ronald Gray, Plenary lecture - Biomedical HIV Prevention Trials (A Sisyphean Task). Cape Town, IAS conference July 2009.
. Cape Town, IAS conference July")
11
Decriminalisation

13
Concurrency Strong case in modelling for concurrency as a determinant of HIV in southern Africa BUT Empirical evidence is lacking Polygyny protective More research needed on sexual networks Standard definitions needed for concurrency What is the intervention?

14
Population impact of treatment as prevention
Time trends resulting from application of universal voluntary HIV testing and immediate ART strategy for people who test HIV positive, in combination with other adult prevention interventions that reduce incidence by 40% Source: Granich RM, et al. Lancet 2009; 373: 48–57.

15
NO MAGIC BULLET

16
Combination prevention
Source: Coates TJ, et al. Lancet 2008; 372:669–84.

17
Source: Hallett TB, et al. PLoS ONE 2008;3(5): e2212
Interaction of circumcision interventions with existing behaviour change programmes Four epidemic projections show: (i) no interventions, (ii) circumcision intervention with 90% coverage, (iii) a behaviour change intervention that leads to an average 30% reduction in partner change rate and 30% increase in condom use with casual partners, (iv) both the circumcision intervention and the behaviour change intervention. The output is HIV incidence per 100 person-years at risk (pyar). The time-scale relates to years since the circumcision intervention starts. (Note: Unlike in other simulations, here no compensation is made for the potential effects of AIDS mortality modifying the risk distribution in the population Projected effect of different prevention interventions on HIV incidence Source: Hallett TB, et al. PLoS ONE 2008;3(5): e2212
 no interventions, (ii) circumcision intervention with 90% coverage, (iii) a behaviour change intervention that leads to an average 30% reduction in partner change rate and 30% increase in condom use with casual partners, (iv) both the circumcision intervention and the behaviour change intervention. The output is HIV incidence per 100 person-years at risk (pyar). The time-scale relates to years since the circumcision intervention starts. (Note: Unlike in other simulations, here no compensation is made for the potential effects of AIDS mortality modifying the risk distribution in the population. Projected effect of different prevention interventions on HIV incidence. Source: Hallett TB, et al. PLoS ONE 2008;3(5): e2212.")
18
Effectiveness /efficacy and controversies
Rates of HIV infection during typical and perfect use Source: Cates W. Technical advances in HIV prevention, in HIV/AIDS Annual Update In: Phair JP, ed. Clinical Care Options, 2006.

19
Know your epidemic Cambodia, 1988-2004
5000 10000 15000 20000 25000 30000 35000 40000 45000 1988 1989 1990 1991 1992 1993 1994 1995 1996 1997 1998 1999 2000 2001 2002 2003 2004 Male clients Sex workers Wife from husband Husband from wife Mother to child Number of new HIV infections by route of transmission Source: Peerapatanapokin and Brown, using Asia Epidemic Model

20
Know your epidemic Lithuania
2004 2008 Proportion of HIV diagnosed cases by transmission category Source: Strujeva O , et al. Poster CDC079 – HIV infection trends in Lithuania in 2004 – Cape Town, IAS conference July 2009.

21
Source: www.avac.org/timeline-website/
HIV Prevention Research Time-line of Expected Efficacy Trial Results (AVAC) 2007 2008 2009 2010 2011 2012+ STEP (HVTN 502/ Merck 023) HSV-2 SUPPRESSION (HPTN 039) HPTN 035 CDC 4323 iPrEx CDC 4940 PHAMBILI Male Circumcision in HIV+ Men PARTNERS IN PREVENTION CDC 4370 PARTNERS PrEP MIRA CARRAGUARD ALVAC-AIDSVAX CAPRISA 004 FEM-PrEP MDP 301 HVTN 505 VOICE (MTN-003) HPTN 052 Source:
 STEP (HVTN 502/ Merck 023) HSV-2 SUPPRESSION (HPTN 039) HPTN 035. CDC iPrEx. CDC PHAMBILI. Male Circumcision in HIV+ Men. PARTNERS IN PREVENTION. CDC PARTNERS PrEP. MIRA. CARRAGUARD. ALVAC-AIDSVAX. CAPRISA 004. FEM-PrEP. MDP 301. HVTN 505. VOICE (MTN-003) HPTN 052. Source:")
22
AIDS IS NOT OVER

23
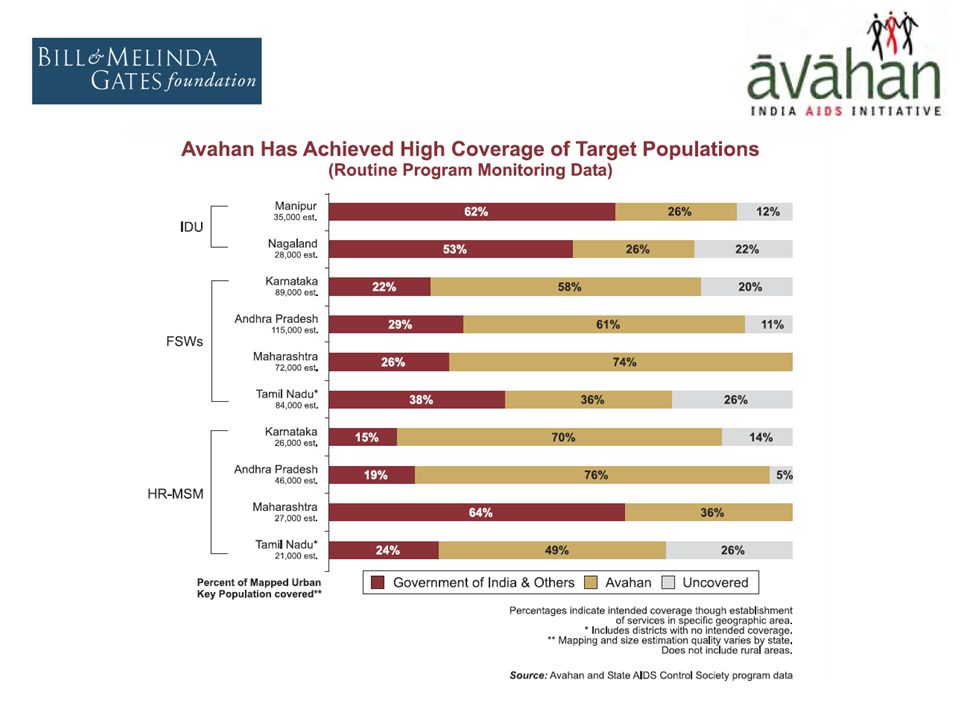
The prevention gap To have an impact with already efficient prevention methods, we need more coverage Percentage of population groups most at risk with access to prevention services, 2008 Source: WHO/UNICEF/UNAIDS. Towards Universal Access. Scaling up priority HIV/AIDS interventions in the health sector. Progress report 2009.

25
Treatment Action Campaign (TAC), South Africa
, South Africa")
26
Source: SIDALAC/UNAIDS. 2001
Preventive expenditure for men who have sex with men and % of AIDS cases among them Source: SIDALAC/UNAIDS. 2001

27
Cost Effectiveness

28
The long term view Stop generic response to heterogeneous problem Start structural interventions NOW Invest in professionals and institutions Donor indicators and incentives focus on long term impact Maximise programme efficiency R&D

29
Combination treatment + Combination prevention + Vaccine???

Similar presentations


 A Research Unit of the University of Cape Town.>")


