Download presentation
Presentation is loading. Please wait.

1
Andrew Schuh 1, Stephen M. Ogle 1, Marek Uliasz 1, Dan Cooley 1, Tristram West 2, Ken Davis 3, Thomas Lauvaux 3, Liza Diaz 3, Scott Richardson 3, Natasha Miles 3, F. Jay Breidt 1, Arlyn Andrews 4, Gabrielle Petron 4, Linda Heath 5, Debbie Huntzinger 6, Kevin Gurney 7, Erandi Lokupitiya 1, Kathy Corbin 8, and Scott Denning 1 Estimating Terrestrial Carbon Fluxes from Atmospheric CO 2 in the Mid- Continent (MCI) Region 1. Colorado State University, 2. The Pennsylvania State University, 3. Oak Ridge National Laboratory, 4. NOAA Earth System Research Laboratory, 5. U.S. Forest Service, 6. University of Michigan, 7. Purdue University, 8. CSIRO, Australia We gratefully acknowledge funding support from the National Aeronautics and Space Administration, Earth Sciences Division, to Colorado State University (agreement #NNX08AK08G).
 Region 1. Colorado State University, 2. The Pennsylvania State University, 3. Oak Ridge National Laboratory, 4. NOAA Earth System Research Laboratory, 5. U.S. Forest Service, 6. University of Michigan, 7. Purdue University, 8. CSIRO, Australia We gratefully acknowledge funding support from the National Aeronautics and Space Administration, Earth Sciences Division, to Colorado State University (agreement #NNX08AK08G)..")
2
2 Basic Atmospheric CO 2 Inversion Components GPP ER Lagrangian Particle Dispersion Model (LPDM) with Regional Atmospheric Modeling System (RAMS) Calibrated CO 2 concentrations Observations from Flux Towers SiB3 model of biosphere fluxes Fossil Fuel Emissions Boundary Conditions WLEF Tower (Park Falls WI, USA)
 with Regional Atmospheric Modeling System (RAMS) Calibrated CO 2 concentrations Observations from Flux Towers SiB3 model of biosphere fluxes Fossil Fuel Emissions Boundary Conditions WLEF Tower (Park Falls WI, USA)")
3
3 “Observed” at 2PM on 7/7/2004: 368 ppm “Calculated” for 2PM on 7/7/2004: 370 ppm - 3 ppm + 1 ppm - 2 ppm = 366 ppm WLEF Tower -2 ppm 1 ppm -3 ppm 370 ppm Transport Model: Conceptualizing Carbon drawdown in upwind areas must be too strong since the observed CO 2 at the tower is higher than what we predict Final: 366 ppm

4
*Big Picture* 4 MgC -4 MgC 1.5 MgC 2007 CarbonTracker Annual NEE Estimate 2007 SiB-CROP a priori NEE Estimate Carbon Sink: 318 TgC NEE, MCI (2007) Carbon SINK: 81 TgC NEE, MCI (2007) 2007 Inventory Annual NEE Estimate Carbon SINK: 130 TgC NEE, MCI (2007) Are the inventory data and the inversion data reconcilable? Are the means relatively close? Does the inventory mean sit within the confidence bounds of the inversion results? What are the sensitivities of the inversion to difficult to quantify uncertainties, e.g. variations in transport and inversion setup. 2 MgC -2 MgC

5
GroupWork Colorado State University Have RAMS transport at 40 km for N. America for 2007. have LPDM footprints for 19 towers (including Ring 2). Performing and investigating inversion results at continental scale and comparing to PSU fine scale results. University of Michigan Waiting on influence functions for geostatistical inversion and working in conjunction with NOAA in the generation of wind fields and stilt footprints. NOAAWorking w/ UM and AER, WRF output is done for 2004-2008 (variety of resolutions) and initial STILT footprints are available for a few months. Using these initial footprints for investigation of CT residuals in Ring 2 area. Generated GlobalView Zonal boundary conditions to supplement CarbonTracker. Penn State University Have WRF meteorology for 4/2007 – 12/2007 (?) and have generated footprints (LPDM) and run inversion for summer of 2007, testing sensitivity over various components such as prior flux estimate.
. Performing and investigating inversion results at continental scale and comparing to PSU fine scale results. University of Michigan Waiting on influence functions for geostatistical inversion and working in conjunction with NOAA in the generation of wind fields and stilt footprints. NOAAWorking w/ UM and AER, WRF output is done for (variety of resolutions) and initial STILT footprints are available for a few months. Using these initial footprints for investigation of CT residuals in Ring 2 area. Generated GlobalView Zonal boundary conditions to supplement CarbonTracker. Penn State University Have WRF meteorology for 4/2007 – 12/2007 ( ) and have generated footprints (LPDM) and run inversion for summer of 2007, testing sensitivity over various components such as prior flux estimate..")
6
“Everything but the kitchen sink” 1.LEF (WI) 2.Argyle (ME) 3.BAO (CO) 4.WKT (TX) 5.West Branch (IA) 6.Martha’s Vineyard (MA) 7.Centerville (IA) 8.Kewanee (IL) 9.Round Lake (MN) 10.Mean (NE) 11.Galesville (WI) 12.Rosemount (MN) 13.Canaan Valley (WV) 14.Ozarks (MO) 15.Metolius (OR) 16.Fraserdale 17.Candle Lake 18.Sable Island 19.LacLabiche
 2.Argyle (ME) 3.BAO (CO) 4.WKT (TX) 5.West Branch (IA) 6.Martha’s Vineyard (MA) 7.Centerville (IA) 8.Kewanee (IL) 9.Round Lake (MN) 10.Mean (NE) 11.Galesville (WI) 12.Rosemount (MN) 13.Canaan Valley (WV) 14.Ozarks (MO) 15.Metolius (OR) 16.Fraserdale 17.Candle Lake 18.Sable Island 19.LacLabiche")
7
Ratio of annual posterior respiration to annual a priori respiration, i.e. 0.4 means that “optimized” flux is 40% of original “Optimized” annual respiration fluxes Reduction in Re Posterior Re (g/m2/yr) Results from “everything but the kitchen sink run”
 Results from everything but the kitchen sink run .")
8
Ratio of annual posterior respiration to annual a priori respiration, i.e. 0.4 means that “optimized” flux is 40% of original “Optimized” annual GPP fluxes Reduction in GPP Posterior GPP (g/m2/yr) North American Inversion Results: GPP
 North American Inversion Results: GPP.")
9
“A priori” assumed annual NEE based upon SiB-CROP. “Optimized” annual NEE fluxes Annual NEE (g/m2/yr) Posterior NEE (g/m2/yr) North American Inversion Results: NEE
 Posterior NEE (g/m2/yr) North American Inversion Results: NEE.")
10
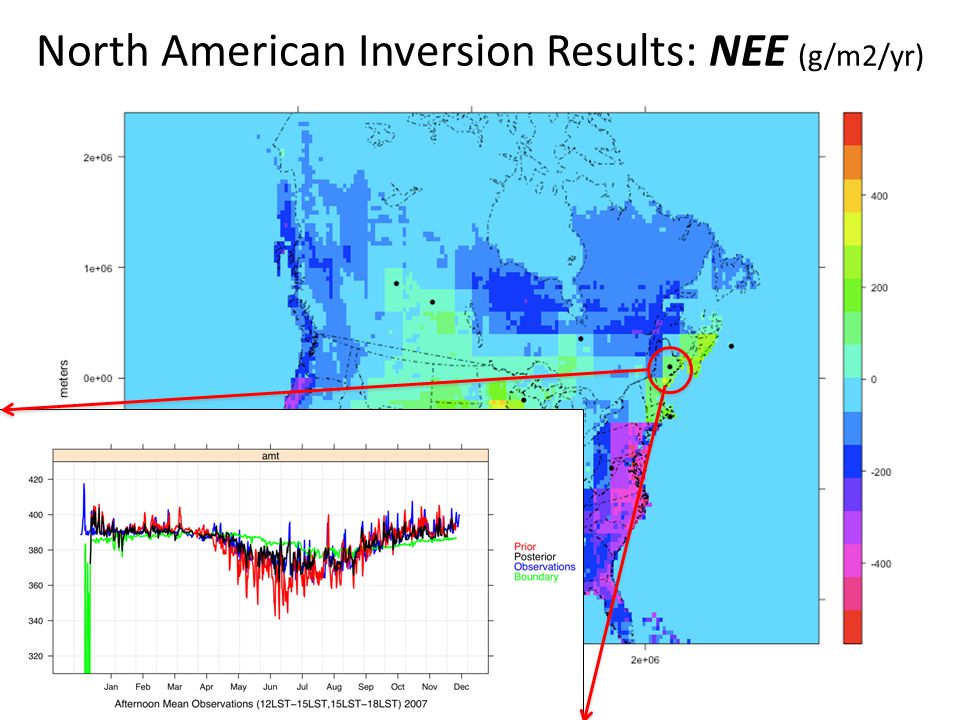
North American Inversion Results: NEE (g/m2/yr)
")
11
NEE estimate over Oregon (constained by Metolius site, Goeckede, Law, et al) seems in line with their regional estimate.
 seems in line with their regional estimate.")
12
North American Inversion Results: NEE (g/m2/yr) This area is likely source? (drought of 2007 in S.E.) Pretty unconstrained, only last few months of year for Canaan Valley and both Canaan Valley and Martha’s Vineyard are very close to fossil sources (a priori CO2 pretty high at Canaan).
 Pretty unconstrained, only last few months of year for Canaan Valley and both Canaan Valley and Martha’s Vineyard are very close to fossil sources (a priori CO2 pretty high at Canaan)..")
13
North American Inversion Results: NEE (g/m2/yr)
")
15
TOO LOW ??? TOO HIGH ???

16
North American Inversion Results: NEE (g/m2/yr) ?? Ethanol ??
 Ethanol")
17
North American Inversion Results: NEE (g/m2/yr) RosemountGalesville Round Lake
 RosemountGalesville Round Lake")
18
Tower Sensitivity Effects: …dropping Rosemount and Galesville

19
Tower Sensitivity Effects: …dropping Ozarks

20
North side of ring2: Just poor conditions? (…and other wildly unjustified hypotheses!) -60 -20 Rosemount 2007 NEE (umol m^-2 sec^- 1) Corn 2 weeks early? Dry and hot?
 Rosemount 2007 NEE (umol m^-2 sec^- 1) Corn 2 weeks early. Dry and hot .")
22
Mean daily NEE (weekly for summer months) for MCI region
 for MCI region")
23
Assumptions to tweak LARGE 200 km infl footprints now. Drop to 100/200 km over N.A. and 40 km over MCI and/or some combination of splitting veg types Diag(6.5ppm) obs error covariance matrix – try tower specific “average” errors – estimate correlations in obs errors Test boundary conditions (Globalview zonal averages) Kalman Filter setup – reset of variance every step (like CT) – currently using full propagate of mean (t=i-1), (unlike CT which uses 3 part smoother, ave(t=0,t=i-2, t=i-1) in estimating time
 obs error covariance matrix – try tower specific average errors – estimate correlations in obs errors Test boundary conditions (Globalview zonal averages) Kalman Filter setup – reset of variance every step (like CT) – currently using full propagate of mean (t=i-1), (unlike CT which uses 3 part smoother, ave(t=0,t=i-2, t=i-1) in estimating time.")
24
Preliminary Analysis on WRF-Stilt and RAMS-LPDM Very

25
AMT WKT LEF WBI Difference in passive tracer contribution to towers (WRF-STILT, RAMS-LPDM) Afternoon
 Afternoon")
26
Kewannee Galesville Mead Round Lake Difference in passive tracer contribution to towers (WRF-STILT, RAMS-LPDM) Afternoon
 Afternoon")
27
Summary Test inversion assumptions, obs err correlations, decorrelation length scale, etc. Investigate specific residuals and footprints, i.e. how much are north ring2 residuals a function of local fluxes? Investigate the Lagrangian model differences and/or use both as transport and incorporate into inversion uncertainty. Spot check WRF/RAMS simulation as well.

Similar presentations


 Natasha Miles 1, Marie Obiminda.>")


