Download presentation
Presentation is loading. Please wait.

2
Principles of Systems Dynamics Modeling and Analysis Pål I. Davidsen pal.davidsen@geog.uib.no Department of Geography, University of Bergen, N-5020 Bergen, fax. 55 584107 tel. 55 584134 Pål I. Davidsen pal.davidsen@geog.uib.no Department of Geography, University of Bergen, N-5020 Bergen, fax. 55 584107 tel. 55 584134

3
Knowledge elicitation Problem identification Problem solving Management Knowledge dissemination Knowledge dissemination System Dynamics Backlog Backlog Management

4
University of Bergen HIA, NTNU, BI University of Bergen HIA, NTNU, BI L.B.S., L.S.E., Leeds & Portsmouth Scranton & Sunderland L.B.S., L.S.E., Leeds & Portsmouth Scranton & Sunderland Istanbul Mannheim & Stuttgart Cottbus & Mainz Mannheim & Stuttgart Cottbus & Mainz Bologna, Bocconi Carla Cattaneo & Palermo Bologna, Bocconi Carla Cattaneo & Palermo Sevilla & Pamplona Sevilla & Pamplona Lisboa & Algarve Lisboa & Algarve Lugano Utrecht

5
Structure Events Behavior

6
Structure (underlying causes) Structure (underlying causes) Events (symptoms) Events (symptoms) Behavior (dynamics) Behavior (dynamics)
 Structure (underlying causes) Events (symptoms) Events (symptoms) Behavior (dynamics) Behavior (dynamics)")
7
Structure (underlying causes) Structure (underlying causes) Events (symptoms) Events (symptoms) Behavior (dynamics) Behavior (dynamics) Decision Making
 Structure (underlying causes) Events (symptoms) Events (symptoms) Behavior (dynamics) Behavior (dynamics) Decision Making")
8
Structure (underlying causes) Structure (underlying causes) Events (symptoms) Events (symptoms) Behavior (dynamics) Behavior (dynamics) Decision Making Policy Design
 Structure (underlying causes) Events (symptoms) Events (symptoms) Behavior (dynamics) Behavior (dynamics) Decision Making Policy Design")
9
Structure (underlying causes) Structure (underlying causes) Events (symptoms) Events (symptoms) Behavior (dynamics) Behavior (dynamics) Policy Design
 Structure (underlying causes) Events (symptoms) Events (symptoms) Behavior (dynamics) Behavior (dynamics) Policy Design")
10
Structure Behavior Policy Design

11
Structure Behavior Policy Design

12
Structure Behavior Policy Design Structure Behavior Policy Design

13
Structure Behavior Policy Design Structure Behavior Policy Design Structure Behavior Policy Design

14
Structure Behavior Policy Design Structure Behavior Policy Design Structure Behavior Policy Design Strategy Development

15
Point of Departure: Problem behavior Point of Departure: Problem behavior

16
t

17
t Identify: Underlying Problem Structure Identify: Underlying Problem Structure

18
t

19
Identify: New Solution Structure Identify: New Solution Structure t

20
t

21
t Goal: Desired behavior

22
t t

23
t t New Solution Structure New Solution Structure Underlying Problem Structure Underlying Problem Structure Desired behavior Problem behavior Hypothesis Development & Testing

24
Strategy Development => System dynamics a problem-oriented multidisciplinary approach => System dynamics a problem-oriented multidisciplinary approach

25
t Underlying Problem Structure Underlying Problem Structure Problem behavior The model should generate the original behavior for the right reasons

26
t New Solution Structure New Solution Structure Desired behavior => The model will generate the desired behavior for the right reasons

27
t The model should explain not “just” predict t

28
t t The model must constitute a causal feedback theory

29
Strategy Development Behavior Structure

30
Behavior Structure

31
Behavior Structure

32
Behavior Structure

33
Behavior Structure

34
Behavior System Dynamics: Identify, understand, and utilize the relationship:

35
Structure Behavior System Dynamics: Identify, understand, and utilize the relationship: in complex, dynamic systems

36
S S D D Complexity Simplicity

37
S S D D Realism Abstraction

38
Realism Abstraction It is better to find …

39
than … a satisfying solution to a problem that exists … … a satisfying solution to a problem that exists … … an optimal solution to a non-existing problem … an optimal solution to a non-existing problem

40
Challenge: potential shifts in Domin. structure Domin. structure Challenge: potential shifts in Domin. structure Domin. structure tt Behavior

41
Maintaining Realism

42
We must not only model explicitly “the plumbing of the system”

43
Make observations Form expectations Establish attitudes Act on incentives (decide) We need to describe how we;
 We need to describe how we;")
44
Actual Observed Confirmed Projected Desired Expected magnitudes We need to differentiate between;

45
Petroleum Exploration PerceivedProductivity ReportedProductivity EstimatedProductivity ActualProductivity Exploration Efforts DesiredDiscoveries EstimatedDiscoveries IdealDiscoveries

46
Petroleum Exploration PerceivedProductivity Nominal Productivity Productivity ReportedProductivity EstimatedProductivity ActualProductivity DesiredProductivity ProductivityIncentives Exploration Efforts DesiredDiscoveries EstimatedDiscoveries IdealDiscoveries

47
Petroleum Exploration PerceivedProductivity Nominal Productivity Productivity ReportedProductivity EstimatedProductivity ActualProductivity DesiredProductivity ProductivityIncentives Exploration Efforts DesiredDiscoveries EstimatedDiscoveries IdealDiscoveries

48
Structure Behavior System Dynamics: Identify, understand, and utilize the relationship: in complex, dynamic systems

49
Complexity Accumulation Feedback Non-linearity

50
Complexity a synergy of Complexity a synergy of Feedbacks Non-linearities Accumulations ≡ Latencies / Delays Accumulations ≡ Latencies / Delays

51
Accumulations ≡ Latencies/ Delays Accumulations ≡ Latencies/ Delays Complexity … the origin of dynamics

52
Instantaneous causality Causality playing out over time

53
0 t 01 t 01 In a causality that spans time nothing happens instantaneously In a causality that spans time nothing happens instantaneously

54
0 t 01 t 01 Effects unfold over time Effects unfold over time 90 0

55
Accumulations distribute and form the effects of a change across a system (in space) over time
 over time")
56
Inventory Production Rate Shipment Rate A first order accumulation process (building up distance)
")
57
Manpower Inventory Hiring & Training Rate Production Rate Shipment Rate Attrition Rate A second order accumulation process (building up speed)
")
58
Manpower Inventory Trainers Hiring & Training Rate Production Rate Shipment Rate Attrition Rate Training Cap. Building Rate Training Cap. Decay Rate A third order accumulation process (building up accell.)
.")
59
Manpower Inventory Trainers Hiring & Training Rate Production Rate Shipment Rate Attrition Rate Training Cap. Building Rate Training Cap. Decay Rate

60
Manpower Inventory Trainers Hiring & Training Rate Production Rate Shipment Rate Attrition Rate Training Cap. Building Rate Training Cap. Decay Rate

61
Manpower Inventory Trainers Hiring & Training Rate Production Rate Shipment Rate Attrition Rate Training Cap. Building Rate Training Cap. Decay Rate

62
Manpower Inventory Trainers Hiring & Training Rate Production Rate Shipment Rate Attrition Rate Training Cap. Building Rate Training Cap. Decay Rate

63
Manpower Inventory Trainers Hiring & Training Rate Production Rate Shipment Rate Attrition Rate Training Cap. Building Rate Training Cap. Decay Rate

64
Multiple accumulations introduce intransparency that leads us to focus on short-term problems while ignoring long-term benefits

65
Multiple accumulations introduce intransparency that leads us to focus on short-term benefits while ignoring long-term problems

66
Gain Additional Complexity Reputation Loss

67
Gain Indicated Rep. > Reputation Reputation Loss Indicated Reputation Indicated Reputation Time to Gain Reputation Time to Gain Reputation

68
Gain Indicated Rep. < Reputation Reputation Loss Indicated Reputation Indicated Reputation Time to Loose Reputation Time to Loose Reputation

69
Gain Additional Complexity Reputation Loss Indicated Reputation Indicated Reputation Time to Loose Reputation Time to Loose Reputation Time to Gain Reputation Time to Gain Reputation

70
Latencies and the time over which the effects play out are often misperceived more often underestimated than overestimated

71
Stocks + Flows

72
Backlog Order Placement Rate Order Execution Rate

73
Inventory Production Rate Delivery Rate

74
Cash Revenue Rate Payment Rate

75
Personnel Hiring Rate Attrition Rate

76
Capital Acquisition Rate Discard Rate

77
Payment Rate Depreciation Rate Book Value Capital Acquisition Rate Discard Rate

78
Payment Rate Depreciation Rate Book Value Capital Acquisition Rate Discard Rate Price

79
Payment Rate Depreciation Rate Book Value Capital Acquisition Rate Discard Rate Price Annual Fraction Depreciated Annual Fraction Discarded

80
Identified Reserves Discovery Rate Production Rate

81
Depreciation Rate Book Value Identified Reserves Discovery Rate Production Rate Exploration Expenditures

82
Depreciation Rate Book Value Identified Reserves Discovery Rate Production Rate Exploration Expenditures Cum Production Recovery Technology Total Recoverable Resource Remaining (CumulativeProduction + IdentifiedReserves)*FractionRecoverable - CumulativeProduction)
*FractionRecoverable - CumulativeProduction)")
83
Depreciation Rate Book Value Identified Reserves Discovery Rate Production Rate Unit Exploration Expenditures Exploration Expenditures Total Recoverable Resource Remaining Recovery Technology Cum Production

84
Depreciation Rate Book Value Identified Reserves Discovery Rate Production Rate Unit Exploration Expenditures Exploration Expenditures Total Recoverable Resource Remaining Recovery Technology Cum Production

85
No stocks, no state

86
No flows, no dynamics

87
Stocks act as buffers they de-couple flows

88
Stocks integrate flows

89
Debt Import RateExport Rate Stocks integrate flows

90
Debt Import RateExport Rate

91
Debt - Export Rate Net Import Rate = Import Rate The Debt Model

92
Debt 0 t 01 t 01 - Export Rate Import Rate

93
Debt 0 t 01 t 01 - Export Rate Import Rate

94
Debt 0 t 01 t 01 Stocks constitute delays - Export Rate Import Rate

95
Just like driving a car....... Capital Personnel Shipments Inventory Exp. Demand Attrition Recruitment Acquisitions Phase-outs Production Adj. Exp. Demand Market Demand

96
Complexity Dynamics Delay Feedback Non-linearity

97
Delay Distributes the effect of our efforts through the system over time

98
Price - + DemandSupply Perceived Shortages + - Delay distributes the effect of our efforts through the system over time Delay distributes the effect of our efforts through the system over time

99
Price - + DemandSupply Perceived Shortages + - Delay obscures the relationship between cause and effect Delay obscures the relationship between cause and effect

100
Price - + DemandSupply Perceived Shortages + - => It is difficult to … => It is difficult to …

101
Price + + Perceived Shortages Demand - Supply identify problems (what are their causes) -
 -")
102
Price + + Perceived Shortages Demand - Supply take effective actions (what do they cause) -
 -")
103
Price - + + Perceived Shortages Demand - Supply … and feedback... + … does not make it less difficult

104
Price - + + Perceived Shortages Demand - Supply A note on... + … econometrics

105
Price - + + Perceived Shortages Demand - Supply A note on... + … the significance of the time horizon

106
Management from a System Dynamics perspective ensure short- and long-term sustainability

108
Complexity Feedback Non-linearity Accumulation

109
Accumulations ≡ Latencies/ Delays Accumulations ≡ Latencies/ Delays Complexity From the origin of dynamics to…

110
Feedback Complexity Accumulations ≡ Latency/ Delay Accumulations ≡ Latency/ Delay … circular causality

111
Circular causality lead us to reason in circles: Cause becomes effect and effect becomes cause

112
This is why we need to say Some change in B leads to a change in A … which over a period of time leads to a change in B A B

113
Price - + + Perceived Shortages Demand - Supply Speculative Demand + + Speculative Supply - - -- ++ +

114
Price - + + Perceived Shortages Demand - Supply + Speculative Demand + + Speculative Supply - - --

115
Price - + Perceived Shortages DemandSupply + Speculative Demand + + Speculative Supply - - -- + -

116
More Feedback (FblExmpls)FblExmpls
FblExmpls")
117
Management from a System Dynamics perspective

118
Management from a System Dynamics perspective Strengthen favorable loops

119
Management from a System Dynamics perspective Strengthen favorable loops Weaken unfavorable loops

120
NOTE: What loops are favorable or unfavorable varies from one point in time to the next because of …

121
Price - + + Perceived Shortages Demand - Supply + Speculative Demand + + Speculative Supply - - -- ++

122
Challenge: What loops are favorable or unfavorable varies from one point in time to the next because …

123
Effects take time Effects feed back... not only do

124
Effects take time Effects feed back Effects also synergize

125
Feedbacks Non-linearities Complexity a composite of Complexity a composite of Accumulations ≡ Latency/ Delay Accumulations ≡ Latency/ Delay

126
Complexity Feedback Non-linearity Accumulation

127
Non-linearity causes the response to a change in a variable to be conditioned by the state of the system… Non-linearity causes the response to a change in a variable to be conditioned by the state of the system…

128
Efficiency in Exploration 50 25 00.51 Fract. Total Resource Remaining Undiscovered 0...(1) by the value of the variable itself..
 by the value of the variable itself...")
129
Nominal Rework Effort Needed Per Error 0.6 0.2 0.250.751.0 0.4 0.50 % of Job Completed D e s i g n C o d i n g 0 0

130
% Active Errors 100 33 0.250.751.0 66 0.50 % of Job Completed D e s i g n C o d i n g 0 0

131
% Active Error Retirement Fraction 1.0 0.33 0.250.751.0 0.66 0.50 % of Job Completed D e s i g n C o d i n g 0 0

132
Efficiency in Exploration 50 25 00.51 Fract. Total Resource Remaining Undiscovered 0

133
Non-linearity causes the response to a change in a variable to be conditioned by the state of the system… Non-linearity causes the response to a change in a variable to be conditioned by the state of the system…

134
Z = X * Y or X / Y rather than X + Y or X - Y Z = X * Y or X / Y rather than X + Y or X - Y X Y.. (2) by the value of other variables.. Subsystem ISubsystem II
 by the value of other variables.. Subsystem ISubsystem II.")
135
Yield = Investments * Productivity = Investments * Productivity From Technology * Effect Of Exploration On Productivity Yield = Investments * Productivity = Investments * Productivity From Technology * Effect Of Exploration On Productivity Technology Exploration Finance Investments Productivity Eff. Of Exploration On Productivity

136
To be continued...

137
Cumulative Identified Resource Additions to Total Resource (TR) Undiscovered Resource (UR)
 Undiscovered Resource (UR)")
138
Cumulative Identified Resource Additions to Technically Undiscoverable Resource Remaining TechnicallyDiscoverable Resource Remaining (TDRR) UndiscoveredResource(UR) Total Resource (TR)
 UndiscoveredResource(UR) Total Resource (TR)")
139
Cumulative Identified Resource Additions to Technically Undiscoverable Resource Remaining TechnicallyDiscoverable Resource Remaining (TDRR) UndiscoveredResource(UR) Total Resource (TR)TechnologicalProgress
 UndiscoveredResource(UR) Total Resource (TR)TechnologicalProgress")
140
Cumulative Identified Resource Additions to Technically Undiscoverable Resource Remaining TechnicallyDiscoverable Resource Remaining (TDRR) UndiscoveredResource(UR) Total Resource (TR)TechnologicalProgress ExplorationProgress
 UndiscoveredResource(UR) Total Resource (TR)TechnologicalProgress ExplorationProgress")
141
Cumulative Identified Resource Additions to Technically Undiscoverable Resource Remaining TechnicallyDiscoverable Resource Remaining (TDRR) Total Resource (TR)UndiscoveredResource(UR) Productivity From Technology = Techn. Discoverable Resource Remaining (TDRR) / Undiscovered Resource (UR)
 / Undiscovered Resource (UR).")
142
Cumulative Identified Resource Additions to Technically Undiscoverable Resource Remaining TechnicallyDiscoverable Resource Remaining (TDRR) UndiscoveredResource(UR) Total Resource (TR) Productivity From Technology = Techn. Discoverable Resource Remaining (TDRR) / Undiscovered Resource (UR) TechnologicalProgress
 / Undiscovered Resource (UR) TechnologicalProgress.")
143
Cumulative Identified Resource Additions to Technically Undiscoverable Resource Remaining TechnicallyDiscoverable Resource Remaining (TDRR) UndiscoveredResource(UR) Total Resource (TR) Effect of Exploration On Productivity = Undiscovered Resource (UR) / Total Resource (TR)
 UndiscoveredResource(UR) Total Resource (TR) Effect of Exploration On Productivity = Undiscovered Resource (UR) / Total Resource (TR)")
144
Cumulative Identified Resource Additions to Technically Undiscoverable Resource Remaining TechnicallyDiscoverable Resource Remaining (TDRR) UndiscoveredResource(UR) Total Resource (TR)ExplorationProgress Effect of Exploration On Productivity = Undiscovered Resource (UR) / Total Resource (TR)
 UndiscoveredResource(UR) Total Resource (TR)ExplorationProgress Effect of Exploration On Productivity = Undiscovered Resource (UR) / Total Resource (TR)")
145
Yield = Investments * Productivity = Investments * Productivity From Technology * Effect Of Exploration On Productivity Yield = Investments * Productivity = Investments * Productivity From Technology * Effect Of Exploration On Productivity Technology Exploration Finance Investments Productivity Eff. Of Exploration On Productivity

146
Yield = Investments * Productivity = Investments * Techn. Discoverable Resource Remaining (TDRR) / Undiscovered Resource (UR) * Undiscovered Resource (UR) / Total Resource (TR) Yield = Investments * Productivity = Investments * Techn. Discoverable Resource Remaining (TDRR) / Undiscovered Resource (UR) * Undiscovered Resource (UR) / Total Resource (TR) Cumulative Identified Resource Additions to Technically Undiscoverable Resource Remaining TechnicallyDiscoverable Resource Remaining (TDRR) Total Resource (TR)
 / Undiscovered Resource (UR) * Undiscovered Resource (UR) / Total Resource (TR) Yield = Investments * Productivity = Investments * Techn. Discoverable Resource Remaining (TDRR) / Undiscovered Resource (UR) * Undiscovered Resource (UR) / Total Resource (TR) Cumulative Identified Resource Additions to Technically Undiscoverable Resource Remaining TechnicallyDiscoverable Resource Remaining (TDRR) Total Resource (TR).")
147
Yield = Investments * Productivity = Investments * Techn. Discoverable Resource Remaining (TDRR) / Total Resource (TR) Yield = Investments * Productivity = Investments * Techn. Discoverable Resource Remaining (TDRR) / Total Resource (TR) TechnicallyDiscoverable Resource Remaining (TDRR) Total Resource (TR)
 / Total Resource (TR) Yield = Investments * Productivity = Investments * Techn. Discoverable Resource Remaining (TDRR) / Total Resource (TR) TechnicallyDiscoverable Resource Remaining (TDRR) Total Resource (TR).")
148
TechnicallyDiscoverable Resource Remaining (TDRR) Total Resource (TR)TechnologicalProgress ExplorationProgress
 Total Resource (TR)TechnologicalProgress ExplorationProgress")
149
…so that non-linearity causes effects to become blended …so that non-linearity causes effects to become blended

150
=> Non-linearity makes it difficult to establish experience with respect to underlying causes (diagnosis) and leverage points, doses and timing (treatment) Non-linearity makes it difficult to establish experience with respect to underlying causes (diagnosis) and leverage points, doses and timing (treatment)
 and leverage points, doses and timing (treatment) Non-linearity makes it difficult to establish experience with respect to underlying causes (diagnosis) and leverage points, doses and timing (treatment)")
151
Demand - Investm. in Prod. % of Investments in Production Investm. in R&D Qlt + + R&D Efficiency Price Price/QLTSales Revenue Production Capacity Production Rate Inventory Level + + + -- + + + + - - + + + + + + -

152
Demand - Investm. in Prod. % of Investments in Production Investm. in R&D Qlt + + R&D Efficiency Price Price/QLTSales Revenue Production Capacity Production Rate Inventory Level + + + -- + + + + - - + + + + + + -

153
Demand - Investm. in Prod. % of Investments in Production Investm. in R&D Qlt + + R&D Efficiency Price Price/QLTSales Revenue Production Capacity Production Rate Inventory Level + + + -- + + + + - - + + + + + + -

154
Demand - Investm. in Prod. % of Investments in Production Investm. in R&D Qlt + + R&D Efficiency Price Price/QLTSales Revenue Production Capacity Production Rate Inventory Level + + + -- + + + + - - + + + + + + -

155
Demand - Investm. in Prod. % of Investments in Production Investm. in R&D Qlt + + R&D Efficiency Price Price/QLTSales Revenue Production Capacity Production Rate Inventory Level + + + -- + + + + - - + + + + + + -

156
Demand - Investm. in Prod. % of Investments in Production Investm. in R&D Qlt + + R&D Efficiency Price Price/QLTSales Revenue Production Capacity Production Rate Inventory Level + + + -- + + + + - - + + + + + + -

157
Demand - Investm. in Prod. % of Investments in Production Investm. in R&D Qlt + + R&D Efficiency Price Price/QLTSales Revenue Production Capacity Production Rate Inventory Level + + + -- + + + + - - + + + + + + -

158
Demand - Investm. in Prod. % of Investments in Production Investm. in R&D Qlt + + R&D Efficiency Price Price/QLTSales Revenue Production Capacity Production Rate Inventory Level + + + -- + + + + - - + + + + + + -

159
Demand - Investm. in Prod. % of Investments in Production Investm. in R&D Qlt + + R&D Efficiency Price Price/QLTSales Revenue Production Capacity Production Rate Inventory Level + + + -- + + + + - - + + + + + + -

160
Demand - Investm. in Prod. % of Investments in Production Investm. in R&D Qlt + + R&D Efficiency Price Price/QLTSales Revenue Production Capacity Production Rate Inventory Level + + + -- + + + + - - + + + + + + -

161
Demand - Investm. in Prod. % of Investments in Production Investm. in R&D Qlt + + R&D Efficiency Price Price/QLTSales Revenue Production Capacity Production Rate Inventory Level + + + -- + + + + - - + + + + + + -

162
Non-linearity makes it difficult to utilize formal analysis Non-linearity makes it difficult to utilize formal analysis

163
S S D D Realism Abstraction

164
It is better to be almost right (ca. 7.5) … It is better to be almost right (ca. 7.5) … …precisely wrong (3.85564923557) …precisely wrong (3.85564923557) than
 … …precisely wrong ( ) …precisely wrong ( ) than.")
165
Non-linearity => Endogenous shifts in structural dominance Non-linearity => Endogenous shifts in structural dominance

166
Interdisciplinary analogies Reality checks Defining loops that serve a purpose

167
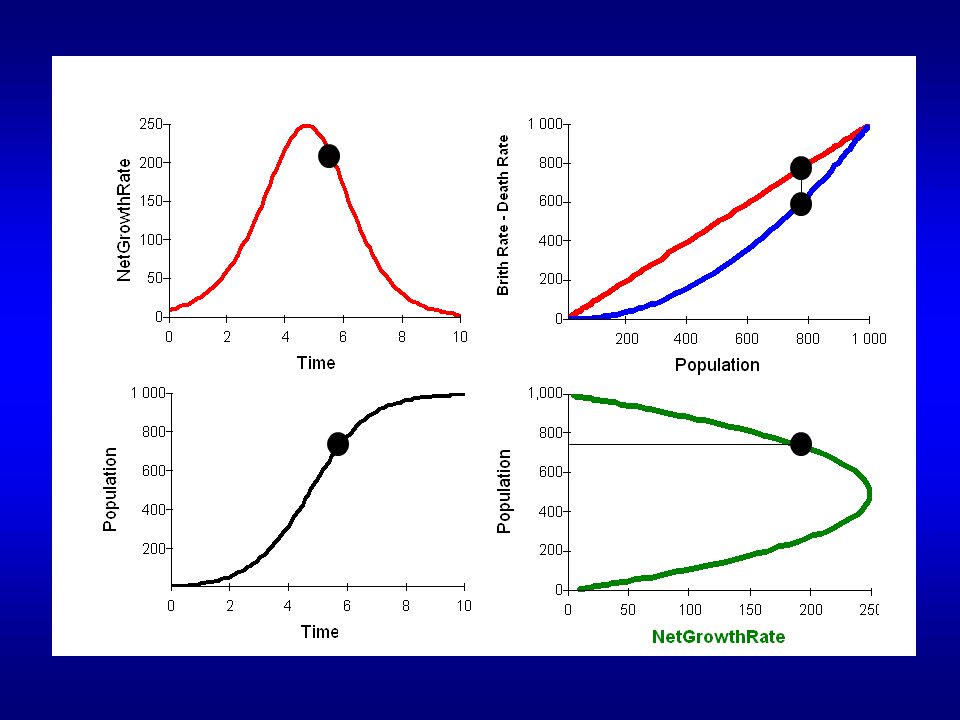
Population

168
Birth Rate

169
Death Rate Population

170
RGF Reference Growth Fraction Birth RateDeath Rate Population

171
RGF Reference Growth Fraction Birth RateDeath Rate RGF*P Population

172
RGF Reference Growth Fraction Birth RateDeath Rate RGF*P Population

173
RGF Reference Growth Fraction Birth RateDeath Rate C RGF*P Carrying Capacity Population

174
RGF Reference Growth Fraction Birth RateDeath Rate P/C Stress C RGF*P Carrying Capacity Population

175
RGF Reference Growth Fraction Birth RateDeath Rate P/C Stress C RGF*S*PRGF*P Carrying Capacity Population

176
RGF Reference Growth Fraction Birth RateDeath Rate P/C Stress C RGF*P*P/CRGF*P Carrying Capacity Population

177
RGF Reference Growth Fraction Birth RateDeath Rate RGF*P 2 /CRGF*P Population

178
RGF Reference Growth Fraction Birth RateDeath Rate RGF*P + - Population RGF*P 2 /C

179
5 000- 0 10 000- 010 + - 5 Months Population +

181
5 000- 0 10 000- 010 + - 5 Months + Population

182
5 000- 0 10 000- 010 + - 5 Months Infectious + Population

183
5 000- 0 10 000- 010 + - 5 Months Susceptible Infectious + Population

184
Infectious c * i * S/N * I Susceptible Net Recruitment Rate - + Prob Of Mtg. Susc.Hot Contacts Per Week S/N c * I Contact Frequency c Infectivity i

185
RGF Reference Growth Fraction Population Birth RateDeath Rate P/C Stress C RGF*P*SRGF*P Carrying Capacity - + -

186
c*i Reference Growth Fraction Infectious Potential Recruitment Rate c * i * I Note: If the entire population was susceptible, then all meetings with an infections is potentially a recruitment: - + -

187
c*i Reference Growth Fraction Infectious Potential Recruitment Rate I/N Growth Resistance N c * i * I Total Population Note: No more than the total population N may become infectious i.e. the total population is the carrying capacity - + -

188
c*i Reference Growth Fraction Infectious Potential Recruitment RateFailed Recruitment Rate I/N Growth Resistance N c*i*I*GRc * i * I Total Population Note: The fraction I/N of the population has already been infected and a meeting between such a person and another infected does NOT contribute to recruitment - + -

189
c*i Reference Growth Fraction Infectious Potential Recruitment RateFailed Recruitment Rate c*i*I*I/Nc * i * I N - + -

190
c*i Reference Growth Fraction Infectious Potential Recruitment RateFailed Recruitment Rate c * i * I Recruitment under the assumption that the total population is susceptible c*i*I*I/N - +

191
c*i Reference Growth Fraction Infectious Potential Recruitment RateFailed Recruitment Rate c * i * I Recruitment under the assumption that the total population is susceptible Recruitment failing because a fraction (I/N) of the total population is not susceptible c*i*I*I/N - +
 of the total population is not susceptible c*i*I*I/N - +")
192
c*i Reference Growth Fraction Infectious Potential Recruitment RateFailed Recruitment Rate c*i*I 2 /Nc * i * I - +

193
c*i Reference Growth Fraction Infectious Potential Recruitment RateFailed Recruitment Rate c*i*I 2 /Nc * i * I Net Recruitment Rate c * i * I - c*i*I 2 /N - +

194
c*i Reference Growth Fraction Infectious Potential Recruitment RateFailed Recruitment Rate c*i*I 2 /Nc * i * I Net Recruitment Rate c * i * I * (1 - I/N) Recruitment succeeding because a fraction (1 - I/N) of the total population is still susceptible - +
 Recruitment succeeding because a fraction (1 - I/N) of the total population is still susceptible - +")
195
Infectious Potential Recruitment RateFailed Recruitment Rate c*i*I 2 /Nc * i * I Net Recruitment Rate - + c * i * I * (1 - I/N)
")
196
Infectious Potential Recruitment RateFailed Recruitment Rate c*i*I 2 /Nc * i * I Net Recruitment Rate - + c * i * I * (1 - I/N)
")
197
Infectious c*i*I 2 /N Net Recruitment Rate c * i * I - + c * i * I * (1 - I/N)
")
198
Infectious c*i*I 2 /N c * i * I Net Recruitment Rate - + c * i * I * (1 - I/N)
")
199
Infectious c * i * I - c*i*I 2 /N Net Recruitment Rate

200
Infectious c * i * (1 - I/N) * I Net Recruitment Rate
 * I Net Recruitment Rate")
201
Infectious c * i * (1 - I/N) * I Net Recruitment Rate
 * I Net Recruitment Rate")
202
Infectious Susceptible c * i * (1 – (N-S)/N) * I Net Recruitment Rate - +
/N) * I Net Recruitment Rate - +")
203
Infectious Susceptible c * i * ((N – (N-S))/N) * I Net Recruitment Rate - +
)/N) * I Net Recruitment Rate - +")
204
Infectious c * i * S/N * I Susceptible Net Recruitment Rate - + Infectious c * i * S/N * I Susceptible Net Recruitment Rate - + Prob Of Mtg. Susc.Hot Contacts Per Week S/N c * I Contact Frequency c Infectivity i

205
Infectious c * i * I/N * S Susceptible Net Recruitment Rate - + Infectious c * i * I/N * S Susceptible Net Recruitment Rate - + Prob Of Mtg. Susc.Hot Contacts Per Week S/N c * I Contact Frequency c Infectivity i

206
Infectious Net Recruitment Rate c * i * I *S/N Susceptible Infectious Potential Recruitment RateFailed Recruitment Rate (c * i) * I(c*i*I/N)*I NOTE: Although the models are equivalent, the positive and negative loops in these two models are not the same! They ”tell the story” in two very different ways - +

207
5 000- 0 10 000- 010 + - 5 Months Susceptible Infectious +

208
- NetRecruitmentRate Infectious Susceptible NetRecruitmentRate Susceptible + Summary

209
Endogenous Shifts in Structural Significance Diffusion and Depletion Processes Masking a negative loop by a positive loop Endogenous Shifts in Structural Significance Diffusion and Depletion Processes Masking a negative loop by a positive loop

210
Exploration Rate Exploration Potential - Exploration Rate

211
Expl. / Exploit. Pot Exploration Rate - Exploration Potential Exploration Rate + Expl. / Exploit. Pot Exploration Potential

212
Exploitation Rate - Exploration Potential Exploration Rate + - Exploitation Rate Exploration Potential Exploration Rate Expl. / Exploit. Pot

213
- Exploration Potential Exploration Rate + - Exploitation Rate Exploration Rate Exploited Exploitation Rate Expl. / Exploit. Pot Exploited Exploration Potential

214
Exploited - Exploration Potential Exploration Rate + - Exploitation Rate Exploration Rate Exploitation Rate Expl. / Exploit. Pot Exploited Exploration Potential

215
- Exploration Rate + - Exploitation Rate Expl. / Exploit. Pot Exploited

216
Investments in Exploration - Exploration Potential Exploration Rate + - Exploitation Rate Expl. / Exploit. Pot Revenues Exploited

217
Investments in Exploration Productivity in Exploration - Exploration Potential Exploration Rate + - Exploitation Rate Expl. / Exploit. Pot Revenues Exploited

218
Investments in Exploration Effect of Exploration on Investment Productivity - Exploration Potential Exploration Rate + - Exploitation Rate Expl. / Exploit. Pot Revenues Exploited Productivity of Investments in Exploration

219
- Exploration Potential Exploration Rate + - Exploitation Rate Investments in Exploration Productivity of Investments in Exploration Investments in Exploration Technology Exploration Technology + Expl. / Exploit. Pot Effect of Exploration on Investment Productivity Revenues Exploited

220
Productivity of Investments in Technology Investments in Exploration Technology - Exploration Potential Exploration Rate + - Exploitation Rate Investments in Exploration Revenues Productivity of Investments in Exploration Investments in Exploration Technology Exploration Technology + Expl. / Exploit. Pot Effect of Exploration on Investment Productivity Investments in Technology Exploited Exploration Technology

221
Investments in Technology Productivity of Investments in Technology - Exploration Potential Exploration Rate + - Exploitation Rate Revenues Expl. / Exploit. Pot Effect of Exploration on Investment Productivity Exploited Exploration Technology

222
Investments in Technology Productivity of Investments in Technology - Exploration Potential Exploration Rate + Revenues Effect of Exploration on Investment Productivity Exploited Exploration Technology

223
Investments in Technology Productivity of Investments - Exploration Potential Exploration Rate + Revenues Effect of Exploration on Investment Productivity Exploited Exploration Technology

224
- Exploration Potential Exploration Rate + Exploited Exploration Technology + - + Exploited Exploration Technology

225
- Exploration Potential Exploration Rate + - Exploitation Rate Investments in Exploration Productivity of Investments in Exploration Investments in Exploration Technology Exploration Technology + Expl. / Exploit. Pot Effect of Exploration on Investment Productivity Revenues Exploited

226
- Exploration Potential Exploration Rate + - Exploitation Rate Investments in Exploration Productivity of Investments in Exploration Investments in Exploration Technology Exploration Technology + Expl. / Exploit. Pot Effect of Exploration on Investment Productivity Revenues Exploited

227
- Exploration Potential Exploration Rate + - Exploitation Rate Investments in Exploration Productivity of Investments in Exploration Expl. / Exploit. Pot Effect of Exploration on Investment Productivity Revenues Exploited Exploration Technology

228
- Exploration Potential Exploration Rate + Exploitation Rate Investments in Exploration Productivity of Investments in Exploration Expl. / Exploit. Pot Effect of Exploration on Investment Productivity Revenues

229
Investments in Exploration Productivity of Investments - Exploration Potential Exploration Rate + Revenues Effect of Exploration on Investment Productivity Exploitation Rate Expl. / Exploit. Pot

230
- Exploration Potential Exploration Rate + Expl. / Exploit. Pot + - + Explored / Exploit. Pot

231
- Undiscovered Discovery Rate + Discovered + - +

232
CAIR TUdRR Technically Discoverable Resource Remaining (TDRR) Total Resource (TR)TechnologicalProgress ExplorationProgress Investment and technology loop dominance 5 000- 0 10 000- 0100 + 50 Years + Undiscovered Discovered Discovery Rate +
 Total Resource (TR)TechnologicalProgress ExplorationProgress Investment and technology loop dominance Years + Undiscovered Discovered Discovery Rate +")
233
CAIR TUdRR Technically Discoverable Resource Remaining (TDRR) Total Resource (TR)TechnologicalProgress ExplorationProgress - Undiscovered Depletion loop dominance Discovered Discovery Rate + 5 000- 0 10 000- 0100 + - 50 Years Undiscovered Discovered +
 Total Resource (TR)TechnologicalProgress ExplorationProgress - Undiscovered Depletion loop dominance Discovered Discovery Rate Years Undiscovered Discovered +")
234
TUdRR Technically Discoverable Resource Remaining (TDRR) Total Resource (TR)DTP EP - Undiscovered Depletion loop dominance Discovered Discovery Rate + 5 000- 0 10 000- 0100 + - 50 Years Undiscovered Discovered + CAIR
 Total Resource (TR)DTP EP - Undiscovered Depletion loop dominance Discovered Discovery Rate Years Undiscovered Discovered + CAIR")
235
TUrRR Technically Recoverable Resource Remaining (TRRR) TUdRR Technically Discoverable Resource Remaining (TDRR) Total Resource (TR)DTP EP - Undiscovered Depletion loop dominance Discovered Discovery Rate + 5 000- 0 10 000- 0100 + - 50 Years Undiscovered Discovered + CAIR RTP PP
 TUdRR Technically Discoverable Resource Remaining (TDRR) Total Resource (TR)DTP EP - Undiscovered Depletion loop dominance Discovered Discovery Rate Years Undiscovered Discovered + CAIR RTP PP")
236
TUrRR Technically Recoverable Resource Remaining (TRRR) TUdRR Technically Discoverable Resource Remaining (TDRR) Total Resource (TR)DTP EP Recovered Production Rate + 5 000- 0 10 000- 0100 + 50 Years Undiscovered Discovered CAIR RTP PP + Investment and technology loop dominance
 TUdRR Technically Discoverable Resource Remaining (TDRR) Total Resource (TR)DTP EP Recovered Production Rate Years Undiscovered Discovered CAIR RTP PP + Investment and technology loop dominance")
237
TUrRR Technically Recoverable Resource Remaining (TRRR) TUdRR Technically Discoverable Resource Remaining (TDRR) Total Resource (TR)DTP EP - Unrecovered Depletion loop dominance Recovered Production Rate + 5 000- 0 10 000- 0100 + 50 Years Undiscovered Discovered CAIR RTP PP - +
 TUdRR Technically Discoverable Resource Remaining (TDRR) Total Resource (TR)DTP EP - Unrecovered Depletion loop dominance Recovered Production Rate Years Undiscovered Discovered CAIR RTP PP - +")
238
Could this model be applied in the health sector ?

239
Patients who, techno- logically considered, cannot be treated Patients who, techno- logically considered, may be treated Alle Pasienter Technologicalprogress Progress in utilization - Untreated Shift in loop-dominance Treated Progress + Patients treated

240
A diffusion model

241
Management from a System Dynamics perspective Strengthen favorable loops Weaken unfavorable loops

242
What loops are favorable or unfavorable varies from one point in time to the next ! Note

243
Management from a System Dynamics perspective In developing robust policies, management must establish a surveillance of loop dominance

244
Management from a System Dynamics perspective so as to decide on which to weaken and which to strengthen at any point in time In developing robust policies, management must establish a surveillance of loop dominance

245
Behavior Structure

246
SPREAD SHEET Multimedia databases Modern Problem Statement Format:

247
Point of departure Source Material

248
Formalization Source Material SD-model

249
Documentation Source Material SD-model

250
Design and Control Source Material SD-model ILE

251
Source Material SD-model ILE Illustration

252
Source Material SD-model ILE Transparency

253
The Modeling Process

254
Problem articulation Formulation of dynamic hypothesis Formulation of simulation model Testing Policy design & evaluation

255
A predator prey model HLstart HL5 HL6 HLstart HL5 HL6

256
Peter M. Senge: The Fifth Discipline From Archetypes to Generic Structures & Behavior and back again.....

257
F Limits to Growth F Eroding Goals F Escalation => Success to the Sucessful F Tragedy of the Commons F Fixes that Fail F Shifting the Burden to the Intervener=> Dependency & Addiction Archetypes

258
Class of Challenges Problem Symptom Own solution -

259
Class of Solutions: Shifting the burden to an intervener Intervention Own solution - - Problem Symptom

260
Class I of Side Effects: Dependence Intervention Own solution Ability to solve + - - Problem Symptom

261
+ Class II of Side Effects: Addiction Intervention Own solution Ability to solve - - Quality of Intervention Problem Symptom +

262
A Dynamic Story Problem Behavior

264
Backlog

268
Backlog Management

269
Backlog Backlog Management

270
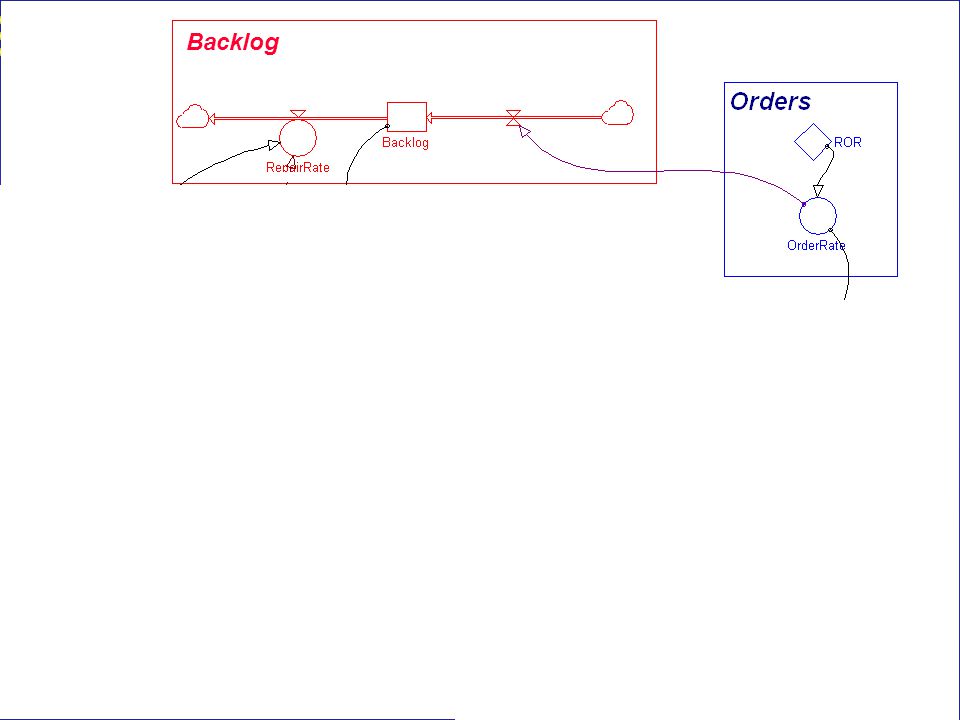
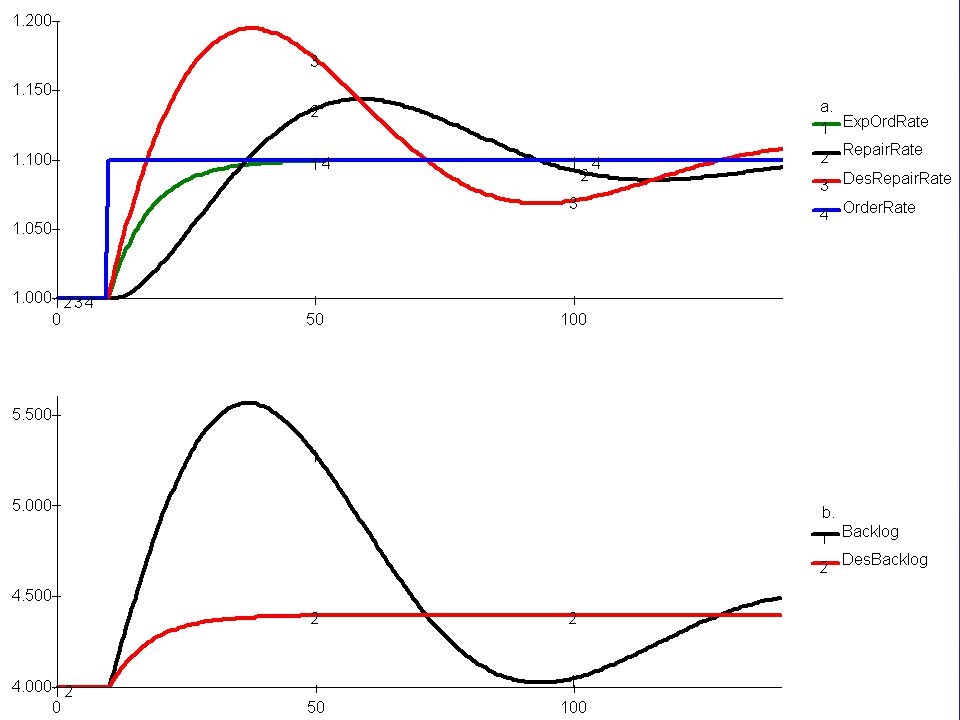
- Backlog Adjustment Backlog Order Rate Ideal Structure Des Repair Rate Repair Rate

272
A Dynamic Story Additional Evidence

274
Backlog Backlog Management

275
Backlog Backlog Management

276
- Des Workforce Workforce Backlog Adjustment Backlog Order Rate Problem Structure Normal Repair Rate Hire Rate Des Repair Rate Repair Rate

278
Solution Overtime

279
Backlog Backlog Management

280
Backlog Backlog Management

281
Schedule Pressure Des Workforce Workforce Backlog Adjustment Backlog Effect of Over- time On Repair Rate Order Rate Long term solution - - Normal Repair Rate Hire Rate Des Repair Rate Repair Rate

282
Schedule Pressure Des Workforce Workforce Normal Repair Rate Backlog Adjustment Backlog Hire Rate Effect of Over- time On Repair Rate Order Rate Des Repair Rate Repair Rate Long term solution - - +

283
Schedule Pressure Des Workforce Workforce Backlog Adjustment Backlog Effect of Over- time On Repair Rate Order Rate Expected Over- time Trouble I: Dependence + - - + Normal Repair Rate Hire Rate Des Repair Rate Repair Rate

284
MTBF Schedule Pressure Des Workforce Workforce Backlog Adjustment Backlog Effect of Over- time On Repair Rate Order Rate Expected Over- time Trouble II: Addiction + - - + + Normal Repair Rate Hire Rate Des Repair Rate Repair Rate

285
MTBF Schedule Pressure Des Workforce Workforce Backlog Adjustment Backlog Effect of Over- time On Repair Rate Order Rate Expected Over- time Trouble II: Addiction + - - + + Normal Repair Rate Hire Rate Des Repair Rate Repair Rate

286
MTBF Complexity Schedule Pressure Des Workforce Workforce Backlog Adjustment Backlog Effect of Over- time On Repair Rate Order Rate Expected Over- time Normal Repair Rate Hire Rate Des Repair Rate Repair Rate

287
MTBF Neg. Feedback Schedule Pressure Des Workforce Workforce Backlog Adjustment Backlog Effect of Over- time On Repair Rate - - Order Rate Expected Over- time Normal Repair Rate Hire Rate Des Repair Rate Repair Rate

288
MTBF Pos. Feedback Schedule Pressure Des Workforce Workforce Backlog Adjustment Backlog Effect of Over- time On Repair Rate + - - + + Order Rate Expected Over- time Normal Repair Rate Hire Rate Des Repair Rate Repair Rate

289
MTBF Delay Schedule Pressure Des Workforce Workforce Backlog Adjustment Backlog Effect of Over- time On Repair Rate + - - + Order Rate Expected Over- time + Normal Repair Rate Hire Rate Des Repair Rate Repair Rate

290
MTBF Non-linearity Schedule Pressure Des Workforce Workforce Backlog Adjustment Backlog Effect of Over- time On Repair Rate + - - + Order Rate Expected Over- time + Normal Repair Rate Hire Rate Des Repair Rate Repair Rate

291
Schedule pressure 1 1- o.8- 1.25- o.51.5 Overtime Graph

292
1 1- o.51.5 MTBF Graph ? ? Schedule pressure

293
MTBF Non-linearity Schedule Pressure Des Workforce Workforce Backlog Adjustment Backlog Effect of Over- time On Repair Rate + - - + Order Rate Expected Over- time + Normal Repair Rate Hire Rate Des Repair Rate Repair Rate

294
MTBF Schedule Pressure Des Workforce Workforce Backlog Adjustment Backlog Effect of Over- time On Repair Rate + - - + Order Rate Expected Over- time + Normal Repair Rate Hire Rate Des Repair Rate Repair Rate Uncertainty

295
Class of Challenges Own solution - Problem

296
Instance of a Challenge - Recruitment Under-/Over- Capacity

297
Class of Solutions: Shifting the burden to an intervener Intervention Own solution - - Problem

298
Instance of a Solution: Shifting the burden to the workforce - - Overtime Recruitment Under-/Over- Capacity

299
Class I of Side Effects: Dependence Intervention Own solution Ability to solve - - + Problem

300
Instance I of a Side Effect: Dependence on Overtime Recruitment Ability/willingn. to recruit - - Overtime Under-/Over- Capacity +

301
Class II of Side Effects: Addiction Intervention Own solution Ability to solve - - Quality of Intervention + + Problem

302
Instance II of a Side Effect: Increasing load through decreased MTBF Under-/Over- Capacity Recruitment + - - MTBF Overtime Ability/willingn. to recruit +

304
SPREAD SHEET Multimedia databases Modern Problem Statement Format:

305
Point of departure Source Material

306
Formalization Source Material SD-model

307
Documentation Source Material SD-model

308
Design and Control Source Material SD-model ILE

309
Source Material SD-model ILE Illustration

310
Source Material SD-model ILE Transparency

311
5 000- 0 10 000- 0100 + - 50 Ubehandlede Behandlede + Years Utnyttlesesløkke-dominans

Similar presentations


>")


