Download presentation
Presentation is loading. Please wait.

1
Combinatorial Optimization in Computational Biology Dan Gusfield Computer Science, UC Davis

2
Some Applications of optimization methods Dynamic Programming in sequence alignment TSP and Euler paths in DNA sequencing Integer Programming in Haplotype inference Graphic Matroid Recognition in Haplotype inference Integer Programming for Virus Identification Weighted matching in genetic partition analysis

3
Apology This talk focuses (mostly) on my own work, for simplicity of preparation. But, many other wonderful examples exist in the literature. At present, there is no coherent story about the ways that combinatorial optimization arises in Computational Biology. Must be alert for meaningful applications.

4
Topic 1: Sequence Alignment Intended to show the similarity of two sequences (strings). Definition: An alignment of two strings S and S’ is obtained by inserting spaces into, or at the ends of, the two strings, so that the resulting strings (including the spaces) have the same lengths. A -- T C A C T C A A
 have the same lengths. A -- T C A C T C A A.")
5
Matches, Mismatches and Indels Two aligned, identical characters in an alignment are a match. Two aligned, unequal characters are a mismatch. A character aligned with a space, represents an indel (insertion/deletion). A A C T A C T -- C C T A A C A C T -- -- -- -- C T C C T A C C T -- -- T A C T T T 10 matches, 2 mismatches, 7 indels the bars show mismatches
. A A C T A C T -- C C T A A C A C T C T C C T A C C T T A C T T T 10 matches, 2 mismatches, 7 indels the bars show mismatches.")
6
Basic Algorithmic Problem Biologically, under the point mutation model, a mismatch represents a mutation, while an indel represents a historical insertion or deletion of a single character. Find an alignment of the two strings that Maximizes the # matches - # mismatches - # spaces in the alignment of strings S and S’. That maximum number defines the similarity of the two strings. Also called Optimal Global Alignment

7
Solution By Dynamic Programming Def: Let V(I, J) be the Maximimum Value obtainable in any alignment of the first I characters of S and the first J characters of S’. If S has N characters and S’ has M characters, then we want to compute V(N, M), and the associated alignment. Let M(I, J) = -1 if S(I) mismatches S’(J) and M(I, J) = 1 if S(I) matches S’(J)
, and the associated alignment. Let M(I, J) = -1 if S(I) mismatches S’(J) and M(I, J) = 1 if S(I) matches S’(J).")
8
DP Solution The DP recurrences are: They can be evaluated in O(NM) operations. I and J aligned I opposite a space J opposite a space General Cases Base Cases

9
Many Variations on the Theme The most important alignment variant is Optimal Local Alignment: Given S and S’ find a substring A of S, and a substring B of S’ such that the value of the Global Alignment of A and B is maximized over all pairs of substrings of S and S’. The point is to find a pair of substrings of S and S’ which are highly similar to each other, even if S and S’ are not. Many biological reasons for this: DNA problems, Protein Domains etc. Naively, we would need to do O((NM)**2) global alignments, for a time bound of O((NM)**3) operations overall.
**2) global alignments, for a time bound of O((NM)**3) operations overall..")
10
DP solution to Local Alignment But the optimal value is no longer V(N, M) as in global alignment. Instead the optimal Local Alignment Value is the largest V value computed over all the NM values. The time is again O(NM). This is the Smith-Waterman Local Alignment Algorithm.
. This is the Smith-Waterman Local Alignment Algorithm..")
11
Adding Operation Weights Find an alignment of the two strings that Maximizes Vm x (# matches) - Cm x (# mismatches) - Cs x (# spaces) in the alignment of strings S and S’. The modification to the DP is immediate, but now the modeling question is what Vm, Cm and Cs should be. Those values greatly determine the biological utility of the alignment. This leads to Parametric Alignment: Find the optimal alignment as a function of unknown values of Vm, Cm, and Cs

12
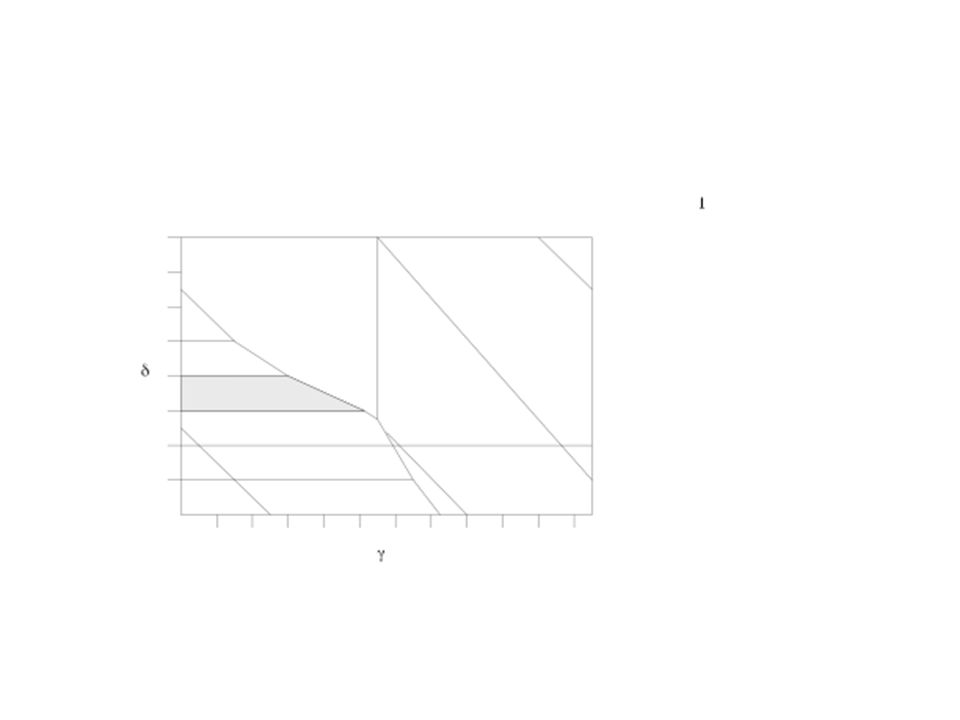
Parametric Sequence Alignment As a function of two selected weight parameters Vm, Cm, Cs, Cg, decompose the two dimensional parameter space into convex polygons, so that in each polygon, an alignment inside the polygon is optimal for any point in the polygon, and nowhere else. The time for this decomposition is O(NM) per polygon. In the case of global alignment, the number of polygons is bounded by 0.88(N^(2/3)), where N < M. package XPARAL to find the polygons is available on the web. Gusfield, Naor, Stelling in several papers (see the web)
 per polygon. In the case of global alignment, the number of polygons is bounded by 0.88(N^(2/3)), where N < M. package XPARAL to find the polygons is available on the web. Gusfield, Naor, Stelling in several papers (see the web).")
14
Adding Gaps to the Model A Gap in an alignment is a contiguous run of spaces in one sequence. Example: A T T -- -- -- C C -- -- -- T C T G C C C has six spaces in three gaps Now the objective function for alignment is Maximize Vm x (#matches) - Cm x (#mis) - Cs x (#spaces) - Cg x (#gaps) This is the affine gap model, the dominant model for studying protein sequence similarity. The choice of Cs and Cg are critical for the biological utility. The DP in this case can also be solved in O(NM) time.
 - Cm x (#mis) - Cs x (#spaces) - Cg x (#gaps) This is the affine gap model, the dominant model for studying protein sequence similarity. The choice of Cs and Cg are critical for the biological utility. The DP in this case can also be solved in O(NM) time..")
15
Topic 2: Sequencing By Hybridization The technology allows you to determine all the K-tuples, for a fixed K, that are contained in a DNA string S. The goal is to try to determine the string S from the given K-tuples. One can cast this problem as a Hamilton Path problem on a graph, but it is more productive to view it as an Euler Path Problem. This approach was introduced by Pavel Pavzner. A proposed approach to sequencing DNA

16
I will focus on the results in Graph Traversals, Genes and Matroids: An Efficient Special Case of the Traveling Salesman Problem D. Gusfield, R. Karp, L. Wang, P. Stelling Discrete Applied Math 88 special issue on Computational Molecular Biology, 1998, p. 167-180.

17
Sequencing by Hybridization Example: S = ACTTAAACGCGCACAA K = 3 So we learn that ACT, CTT etc. are in S, but we learn these in no predictable order.

18
The Hamilton Path View Each node represents a K-tuple, and a directed edge from one node to another if the second K-tuple can be obtained from the first by deleting the left character, and adding a right character: i.e, a shift and add. ACG CGC add a C on the left Then a Hamilton Path in this graph generates a sequence S’ that has the same K-tuples as S

19
The Euler Path View The Euler Path view is more productive, leading to more efficient algorithms both for the base problem, and for variants of the problem. Due to P. Pevzner

20
AA AC CA TA TT CT CG GC A A A T T C A A C A G C Observed triples from S: AAA, AAC, ACA, CAA, CAC, ACG, CGC, GCA, GCC, ACT, CTT, TTA, TAA Graph G: One node for every k-1 tuple, and one edge for every observed k-tuple

21
Any Euler path in G produces a string which has the same K-tuples as the original string S. So if there is only one Euler path in G, then you have reconstructed S. The problem is that typically there is more than one Euler path. So how to choose one Euler path as a most promising one? That is, one that is most likely to correspond to S? Frequently there is additional information about the K-tuples, for example the rough distances between K-tuples in S. So, we can give a value to each pair of successive edges in G, which roughly reflects the probability that the two edges would appear successively in the Euler Path for S. Another way to state this is that we evaluate the goodness of S’ according to the (k+1)-tuples that it contains.
-tuples that it contains..")
22
Back to the Hamilton View Now we are back to the Hamilton Path view, where each node is a K-tuple of S, but now each edge has a distance reflecting the goodness of any (K+1)-tuple that would be generated by a Hamilton path, and we want the Maximum distance Hamilton Path in the graph. This sounds hard, but there is structure in this problem: the graphs are not arbitrary.

23
The structure of the Hamilton Graph The Hamilton Graph for the data, where nodes represent K-tuples in S, and edges represent (K+1)-tuples in a solution string S’, is the line di-graph of the Euler Graph for the data, where nodes represent (K-1) tuples, and edges represent K-tuples.
-tuples in a solution string S’, is the line di-graph of the Euler Graph for the data, where nodes represent (K-1) tuples, and edges represent K-tuples.")
24
How Euler Relates to Hamilton The Hamilton graph is the line di-graph L(G) of the Euler Graph G. Each red edge has the value of the successive pair of black edges. Each edge of G becomes a node in L(G), and each edge in L(G) represents a successive pair of edges in G. So the problem now is to find a Maximum Value TSPath.
, and each edge in L(G) represents a successive pair of edges in G. So the problem now is to find a Maximum Value TSPath..")
25
In the case that each node has only two in and two out edges (which happens when using a simplified DNA alphabet), this TSP problem has a polynomial time solution. In fact, if L(G) is any line digraph where every node has in and out degrees at most 2, then even for arbitrary edge distances, the TSP problem can be solved in O(n log n) time. Moreover, if every edge value is distinct, then the TSP solution is unique. The Hamilton paths for such 2-in, 2-out-degree graphs have a matroid structure that reveals many features of the TSP solutions. When degrees are greater than 2, we branch-and-bound down to cases of degree 2, which we then can solve optimally.
 is any line digraph where every node has in and out degrees at most 2, then even for arbitrary edge distances, the TSP problem can be solved in O(n log n) time. Moreover, if every edge value is distinct, then the TSP solution is unique. The Hamilton paths for such 2-in, 2-out-degree graphs have a matroid structure that reveals many features of the TSP solutions. When degrees are greater than 2, we branch-and-bound down to cases of degree 2, which we then can solve optimally..")
26
Approximations When the in and out-degrees are bounded by X, a greedy algorithm is guaranteed to find a Hamilton path whose value is within 1/X that of the optimal. So 1/3 or 1/4 for the case of DNA. Use of this approximation can speed up the branch-and- bound until the in and out-degree bound of 2 is reached.

28
Topic 3: Combinatorial Algorithms for Haplotype Inference True Parsimony and Perfect Phylogeny Dan Gusfield

29
Genotypes and Haplotypes Each individual has two “copies” of each chromosome. At each site, each chromosome has one of two alleles (states) denoted by 0 and 1 (motivated by SNPs) 0 1 1 1 0 0 1 1 0 1 1 0 1 0 0 1 0 0 2 1 2 1 0 0 1 2 0 Two haplotypes per individual Genotype for the individual Merge the haplotypes
 denoted by 0 and 1 (motivated by SNPs) Two haplotypes per individual Genotype for the individual Merge the haplotypes.")
30
Haplotyping Problem Biological Problem: For disease association studies, haplotype data is more valuable than genotype data, but haplotype data is hard to collect. Genotype data is easy to collect. Computational Problem: Given a set of n genotypes, determine the original set of n haplotype pairs that generated the n genotypes. This is hopeless without a genetic model.

31
We consider two models in this talk Pure (True) Parsimony Model, Gusfield unpublished (Note added 3/18/03 technical report is available on the web, and will appear in the 2003 CPM conference) Perfect Phylogeny Model, Gusfield RECOMB Proceedings April 2002
 Parsimony Model, Gusfield unpublished (Note added 3/18/03 technical report is available on the web, and will appear in the 2003 CPM conference) Perfect Phylogeny Model, Gusfield RECOMB Proceedings April 2002")
32
Topic 3a: The Pure Parsimony Objective For a set of genotypes, find a Smallest set H of haplotypes, such that each genotype can be explained by a pair of haplotypes in H.

33
Example of Parsimony 02120 00100 01110 22110 01110 10110 20120 00100 10110 3 distinct haplotypes set S has size 3

34
Pure Parsimony Explain the N genotypes using the fewest number of distinct haplotypes. Why? Empirically few haplotypes are seen in populations; Coalescent theory; analogy to other parsimony criteria; common attempts to interpret Clark’s haplotype inferral method as a parsimony method.

35
Pure Parsimony is NP-hard Earl Hubbel (Affymetrix) showed that Pure Parsimony is NP-hard. However, for a range of parameters of current interest (number of sites and genotypes) a Pure Parsimony solution can be computed efficiently, using Integer Linear Programming, and one speed-up trick. For larger parameters (100 sites and 50 genotypes) A near-parsimony solution can be found efficiently.
 a Pure Parsimony solution can be computed efficiently, using Integer Linear Programming, and one speed-up trick. For larger parameters (100 sites and 50 genotypes) A near-parsimony solution can be found efficiently..")
36
The Conceptual Integer Programming Formulation For each genotype (individual) j, create one integer programming variable Yij for each pair of haplotypes whose merge creates genotype j. If j has k 2’s, then This creates 2^(k-1) Y variables. Create one integer programming variable Xq for Each distinct haplotype q that appears in one of the pairs for a Y variable.
 Y variables. Create one integer programming variable Xq for Each distinct haplotype q that appears in one of the pairs for a Y variable..")
37
Conceptual IP For each genotype, create an equality that says that exactly one of its Y variables must be set to 1. For each variable Yij, whose two haplotypes are given variables Xq and Xq’, include an inequality that says that if variable Yij is set to 1, then both variables Xq and Xq’ must be set to 1. Then the objective function is to Minimize the sum of the X variables.

38
Example 02120 Creates a Y variable Y1 for pair 00100 X1 01110 X2 and a Y variable Y2 for pair 01100 X3 00110 X4 Y1 + Y2 = 1 Y1 - X1 <= 0 Y1 - X2 <= 0 Y2 - X3 <= 0 Y2 - X4 <= 0 Include the following (in)equalities into the IP The objective function will include the subexpression X1 + X2 + X3 + X4 But any X variable is included exactly once no matter how many Y variables it is associated with.
equalities into the IP The objective function will include the subexpression X1 + X2 + X3 + X4 But any X variable is included exactly once no matter how many Y variables it is associated with.")
39
Efficiency Trick Ignore any Y variable and its two X variables if those X variables are associated with no other Y variable. The Resulting IP is much smaller, and can be used to find the optimal to the conceptual IP. Also, we need not first enumerate all X pairs for a given genotype, but can efficiently recognize the pairs we need. Another simple trick.

40
How Fast? How Good? Depends on the level of recombination in the underlying data. Pure Parsimony can be computed in seconds to minutes for most cases with 50 genotypes and up to 60 sites, faster as the level of recombination increases. As the level of recombination increases, the accuracy of the Pure Parsimony Solution falls, but remains within 10% of the quality of PHASE (for comparison).
..")
41
Topic 3b: Haplotyping via Perfect Phylogeny Conceptual Framework and Efficient (almost linear-time) Solutions Dan Gusfield U.C. Davis

42
The Perfect Phylogeny Model We assume that the evolution of extant haplotypes can be displayed on a rooted, directed tree, with the all-0 haplotype at the root, where each site changes from 0 to 1 on exactly one edge, and each extant haplotype is created by accumulating the changes on a path from the root to a leaf, where that haplotype is displayed. In other words, the extant haplotypes evolved along a perfect phylogeny with all-0 root.

43
The Perfect Phylogeny Model 00000 1 2 4 3 5 10100 10000 01011 00010 01010 12345 sites Ancestral haplotype Extant haplotypes at the leaves Site mutations on edges

44
Justification for Perfect Phylogeny Model In the absence of recombination each haplotype of any individual has a single parent, so tracing back the history of the haplotypes in a population gives a tree. Recent strong evidence for long regions of DNA with no recombination. Key to the NIH haplotype mapping project. (See NYT October 30, 2002) Mutations are rare at selected sites, so are assumed non-recurrent. Connection with coalescent models.
 Mutations are rare at selected sites, so are assumed non-recurrent. Connection with coalescent models..")
45
The Haplotype Phylogeny Problem Given a set of genotypes S, find an explaining set of haplotypes that fits a perfect phylogeny. 12 a22 b02 c10 sites A haplotype pair explains a genotype if the merge of the haplotypes creates the genotype. Example: The merge of 0 1 and 1 0 explains 2 2. Genotype matrix S

46
The Haplotype Phylogeny Problem Given a set of genotypes, find an explaining set of haplotypes that fits a perfect phylogeny 12 a22 b02 c10 12 a10 a01 b00 b01 c10 c10

47
The Haplotype Phylogeny Problem Given a set of genotypes, find an explaining set of haplotypes that fits a perfect phylogeny 12 a22 b02 c10 12 a10 a01 b00 b01 c10 c10 1 c c a a b b 2 10 01 00

48
The Alternative Explanation 12 a22 b02 c10 12 a11 a00 b00 b01 c10 c10 No tree possible for this explanation

49
When does a set of haplotypes to fit a perfect phylogeny? Classic NASC: Arrange the haplotypes in a matrix, two haplotypes for each individual. Then (with no duplicate columns), the haplotypes fit a unique perfect phylogeny if and only if no two columns contain all three pairs: 0,1 and 1,0 and 1,1 This is the 3-Gamete Test
, the haplotypes fit a unique perfect phylogeny if and only if no two columns contain all three pairs: 0,1 and 1,0 and 1,1 This is the 3-Gamete Test.")
50
The Alternative Explanation 12 a22 b02 c10 12 a11 a00 b00 b01 c10 c10 No tree possible for this explanation

51
12 a22 b02 c10 12 a10 a01 b00 b01 c10 c10 1 c c a a b b 2 0 0 1 0 The Tree Explanation Again

52
Solving the Haplotype Phylogeny Problem (PPH) Simple Tools based on classical Perfect Phylogeny Problem. Complex Tools based on Graph Realization Problem (graphic matroid realization).
..")
53
Simple Tools – treeing the 1’s 1)For any row i in S, the set of 1 entries in row i specify the exact set of mutations on the path from the root to the least common ancestor of the two leaves labeled i, in every perfect phylogeny for S. 2)The order of those 1 entries on the path is also the same in every perfect phylogeny for S, and is easy to determine by “leaf counting”.
The order of those 1 entries on the path is also the same in every perfect phylogeny for S, and is easy to determine by leaf counting ..")
54
Leaf Counting 1234567 a1010000 b0101000 c2200202 d2200020 In any column c, count two for each 1, and count one for each 2. The total is the number of leaves below mutation c, in every perfect phylogeny for S. So if we know the set of mutations on a path from the root, we know their order as well. S Count 4 4 2 2 1 1 1

55
The Subtree of 1’s is Forced The columns of S with at least one 1 entry specify a unique upper subtree that must be in every perfect phylogeny for S. 1234567 a1010000 b0101000 c2200202 d2200020 S 1 4 3 2 a a b b 4 4 2 2 1 1 1

56
Corollary: A Useful Sufficient Condition If every column of S has at least one 1, then there is a unique perfect phylogeny for S, if there is any. Build the forced tree based on the 1-entries, then every mutation (site) is in the tree, and any 2-entries dictate where the remaining leaves must be attached to the tree.
 is in the tree, and any 2-entries dictate where the remaining leaves must be attached to the tree..")
57
What to do when the Corollary does not apply? Build the forced tree of 1-entries. 2-entries in columns with 1-entries are done. Remaining problem: 2-entries in columns without any 1-entries

58
Uniqueness without 1’s A 0 2 2 B 2 2 0 C 2 0 2 There are 8 haplotype solutions that can explain the data, but only one that fits a perfect phylogeny, i.e. only one solution to the PPH problem.

59
More Simple Tools 3)For any row i in S, and any column c, if S(i,c) is 2, then in every perfect phylogeny for S, the path between the two leaves labeled i, must contain the edge with mutation c. Further, every mutation c on the path between the two i leaves must be from such a column c.

60
From Row Data to Tree Constraints Root The order is known for the red mutations 1 2 3 4 5 6 7 i:0 1 0 2 2 1 2 ii Subtree for row i data 4,5,7 order unknown 2626 sites

61
The Graph Theoretic Problem Given a genotype matrix S with n sites, and a red-blue fork for each row i, create a directed tree T where each integer from 1 to n labels exactly one edge, so that each fork is contained in T. ii

62
Complex Tool: Graph Realization Let Rn be the integers 1 to n, and let P be an unordered subset of Rn. P is called a path set. A tree T with n edges, where each is labeled with a unique integer of Rn, realizes P if there is a contiguous path in T labeled with the integers of P and no others. Given a family P1, P2, P3…Pk of path sets, tree T realizes the family if it realizes each Pi. The graph realization problem generalizes the consecutive ones problem, where T is a path.

63
Graph Realization Example 1 2 4 5 6 3 8 7 P1: 1, 5, 8 P2: 2, 4 P3: 1, 2, 5, 6 P4: 3, 6, 8 P5: 1, 5, 6, 7 Realizing Tree T

64
Graph Realization Polynomial time (almost linear-time) algorithms exist for the graph realization problem – Whitney, Tutte, Cunningham, Edmonds, Bixby, Wagner, Gavril, Tamari, Fushishige. The algorithms are not simple; no known implementations of the near linear-time methods. But an implementation from UCD CS of a slightly slower method is available on the web.

65
Recognizing graphic Matroids The graph realization problem is the same problem as determining if a binary matroid is graphic, and the algorithms come from that literature. The fastest algorithm is due to Bixby and Wagner. For n rows and m columns the time is O(nm x alpha(nm). Representation methods due to Cunningham et al.
. Representation methods due to Cunningham et al..")
66
Reducing PPH to graph realization We solve any instance of the PPH problem by creating appropriate path sets, so that a solution to the resulting graph realization problem leads to a solution to the PPH problem instance. The key issue: How to encode a fork by path sets.

67
From Row Data to Tree Constraints Root The order is known for the red mutations 1 2 3 4 5 6 7 i:0 1 0 2 2 1 2 ii Subtree for row i data 4,5,7 order unknown 2626 sites

68
Encoding a Red path, named g 2 5 7 P1: U, 2 P2: U, 2, 5 P3: 2, 5 P4: 2, 5, 7 P5: 5, 7 P6: 5, 7, g P7: 7, g 2 5 7 g U U is a universal glue edge, used for all red paths. g is used for all red paths identical to this one – i.e. different forks with the identical red path. forced In T

69
Encoding and gluing a blue path For a specific blue path, simply specify a single path set containing the integers in the blue path. However, we need to force that path to be glued to the end of a specific red path g, or to the root of T. In the first case, just add g to the path set. In the second case, add U to the path set.

70
Encoding and gluing a blue path to the end of red path g 2 5 7 4, 9, 18, 20 g P: g, 4, 9, 18, 20

71
After the Reduction After all the paths are given to the graph realization algorithm, and a realizing tree T is obtained (assuming one is), contract all the glue edges to obtain a perfect phylogeny for the original haplotyping problem (PPH) instance. Conversely, any solution can be obtained in this way. The reduction takes time O(nm) for n rows and m columns.
 for n rows and m columns..")
72
Uniqueness In 1932, Whitney established the NASC for the uniqueness of a solution to a graph realization problem: Let T be the tree realizing the family of required path sets. For each path set Pi in the family, add an edge in T between the ends of the path realizing Pi. Call the result graph G(T). T is the unique realizing tree, if and only if G(T) is 3-vertex connected. e.g., G(T) remains connected after the removal of any two vertices.
. T is the unique realizing tree, if and only if G(T) is 3-vertex connected. e.g., G(T) remains connected after the removal of any two vertices..")
73
Uniqueness of PPH Solution Apply Whitney’s theorem, using all the paths implied by the reduction of the PPH problem to graph realization. (Minor point) Do not allow the removal of the endpoints of the universal glue edge U.
 Do not allow the removal of the endpoints of the universal glue edge U..")
74
Multiple Solutions In 1933, Whitney showed how multiple solutions to the graph realization problem are related. Partition the edges of G into two, connected graphs, each with at least two edges, such that the two graphs have exactly two nodes in common. Then twist one graph around those nodes. Any solution can be transformed to another via a series of such twists.

75
Twisting Example xy xy 1 2 3 4 5 6 7 8 1 2 3 4 5 6 7 8 All the cycle sets are preserved by twisting

76
Representing all the solutions All the solutions to the PPH problem can be implicitly represented in a data structure which can be built in linear time, once one solution is known. Then each solution can be generated in linear time per solution. Method is a small modification of ones developed by Cunningham and Edwards, and by Hopcroft and Tarjan. See Gusfield’s web site for errata.

77
The biological meaning Each subgraph in the representation identifies a set of mutations (columns) whose 0/1 settings are invariant over all PPH solutions. However, by switching all 0/1 values that had been 2, in all of those mutations, the relative 0/1 settings between columns in different subgraphs can be set arbitrarilly, and all PPH solutions can be generated in this way.

78
1 2 2 2 0 0 0 1 2 2 2 0 0 0 2 0 2 0 0 0 2 2 0 2 0 0 0 2 1 2 2 2 0 2 0 1 2 2 2 0 2 0 1 2 2 0 2 0 0 1 2 2 0 2 0 0 2 2 0 0 0 2 0 2 2 0 0 0 2 0 a a b b c c d e d e 1 2 3 4 5 6 7 An example. Each row starts duplicated for simplicity.

79
1 1 0 0 0 0 0 1 0 1 1 0 0 0 1 0 1 0 0 0 0 0 0 0 0 0 0 1 1 1 0 0 1 0 0 1 0 1 1 0 0 0 1 1 0 0 0 1 0 1 0 1 0 0 0 0 1 1 0 0 1 0 0 0 0 0 0 0 0 0 a a b b c c d e d e 1 2 3 4 6 5 7 Starting from a PPH Solution, if all shaded cells in a block switch value, then the result is also a PPH solution, and any PPH solution can be obtained in this way, i.e. by choosing in each block whether to switch or not.

80
Corollary In a single connected component C of G with k connected components in Gf, there are exactly 2^(k-1) different solutions to the PPH problem in the columns of M represented by C. If G has r connected components and t connected components of Gf, then there are exactly 2^(t-r) solutions to the PPH problem. There is one unique PPH solution if and only if each connected component in G is a connected component in Gf.
 solutions to the PPH problem. There is one unique PPH solution if and only if each connected component in G is a connected component in Gf..")
81
Secondary information and optimization The partition shows explicitly what added information is useful and what is redundant. Information about the relationship of a pair of columns is redundant if and only if they are in the same block of the column partition. Apply this successively as additional information is obtained. Problem: Minimize the number of haplotype pairs (individuals) that need be laboratory determined in order to find the correct tree. Minimize the number of (individual, site1, site2) triples whose phase relationship needs to be determined, in order to find the correct tree.
 that need be laboratory determined in order to find the correct tree. Minimize the number of (individual, site1, site2) triples whose phase relationship needs to be determined, in order to find the correct tree..")
82
The implicit representation of all solutions provides a framework for solving these secondary problems, as well as other problems involving the use of additional information, and specific tree-selection criteria.

83
A Phase-Transition Problem, as the ratio of sites to genotypes changes, how does the probability that the PPH solution is unique change? For greatest utility, we want genotype data where the PPH solution is unique. Intuitively, as the ratio of genotypes to sites increases, the probability of uniqueness increases.

84
Frequency of a unique solution with 50 and 100 sites, 5% rule and 2500 datasets per entry 100.0018 200.0032 220.7646 400.7488 420.9611 700.994 1300.999 1401 # geno. Frequency of unique solution 100 200 220.78 400.725 420.971 600.983 1000.999 1101

85
The case of the unknown root The 3-Gamete Test is for the case when the root is assumed to be the all-0 vector. When the root is not known then the NASC is that the submatrix 00 10 must not appear in the matrix. This is 10 called the 4-Gamete Test. 11

86
An alternative solution Recently, we developed an algorithm that is not based on graph realization, and which is much easier to understand. However, it runs in O(nm^2) time. See Gusfield’s website.
 time. See Gusfield’s website..")
87
Implementations See wwwcsif.cs.ucdavis.edu/~gusfield/ for papers and software.

Similar presentations


 Problem Zhihong Ding, Vladimir Filkov, Dan Gusfield Department of Computer Science.>")
 A Fundamental Decomposition Theory for Phylogenetic Networks and Incompatible Characters.>")


 with a Single Homoplasy or Recombnation Event Yun S. Song, Yufeng Wu and Dan Gusfield University.>")


 Solutions Dan Gusfield U.C. Davis RECOMB 02, April 2002.>")