Download presentation
Presentation is loading. Please wait.

1
Interactive Visualization of Small World Graphs An implementation in prefuse

2
The Problem How do we display Small World Graphs?

3
Why is this hard? Clusters! Hierarchies!

4
The proposed solution Physics Dendrogram Clustering Degree of Abstraction (DOA) Details in paper
 Details in paper")
5
The Gist

10
Prefuse

11
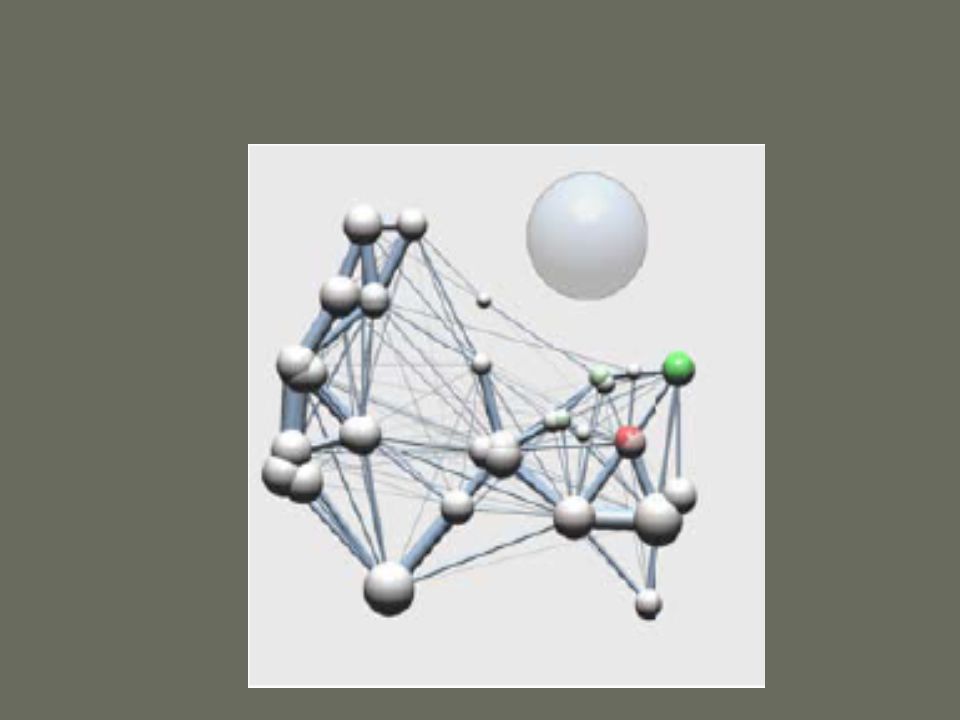
SMALL WORLD GRAPH

12
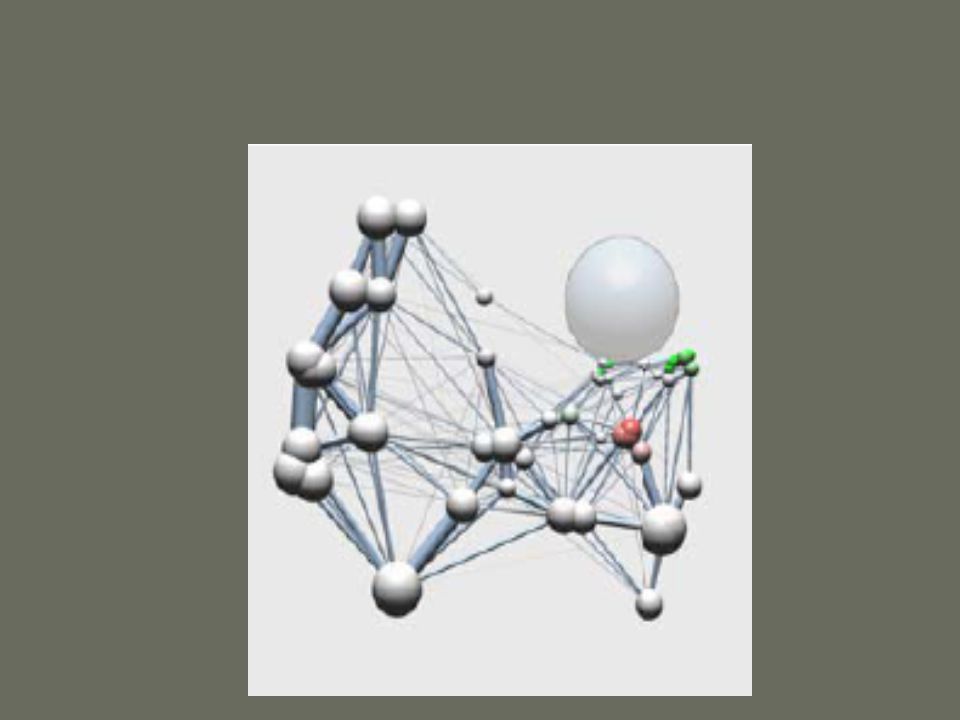
Physics and Clustering

13
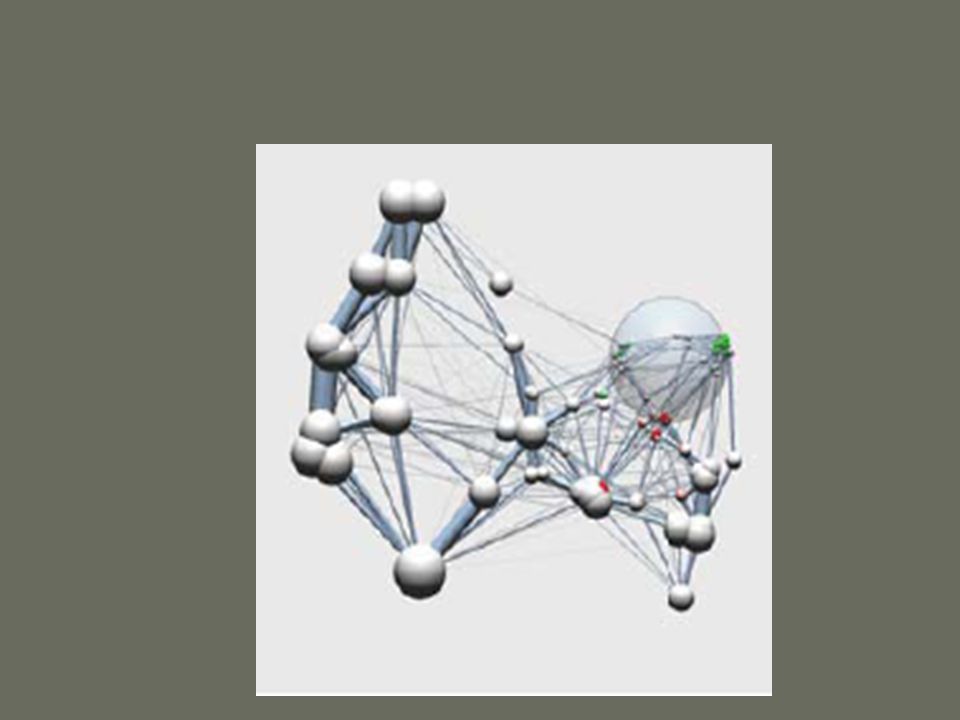
SMALL WORLD GRAPH Physics and Clustering DOA Layout Handle Occlusion in 2D

14
What’s Done? SMALL WORLD GRAPH Physics and Clustering DOA Layout Handle Occlusion in 2D

15
SMALL WORLD GRAPH Physics and Clustering DOA Layout Handle Occlusion in 2D 80% Done Tubes as rectangles with gradient Draw nodes as X layers one layer at a time Explicitly compute Voronoi regions Occlusion in 2D

16
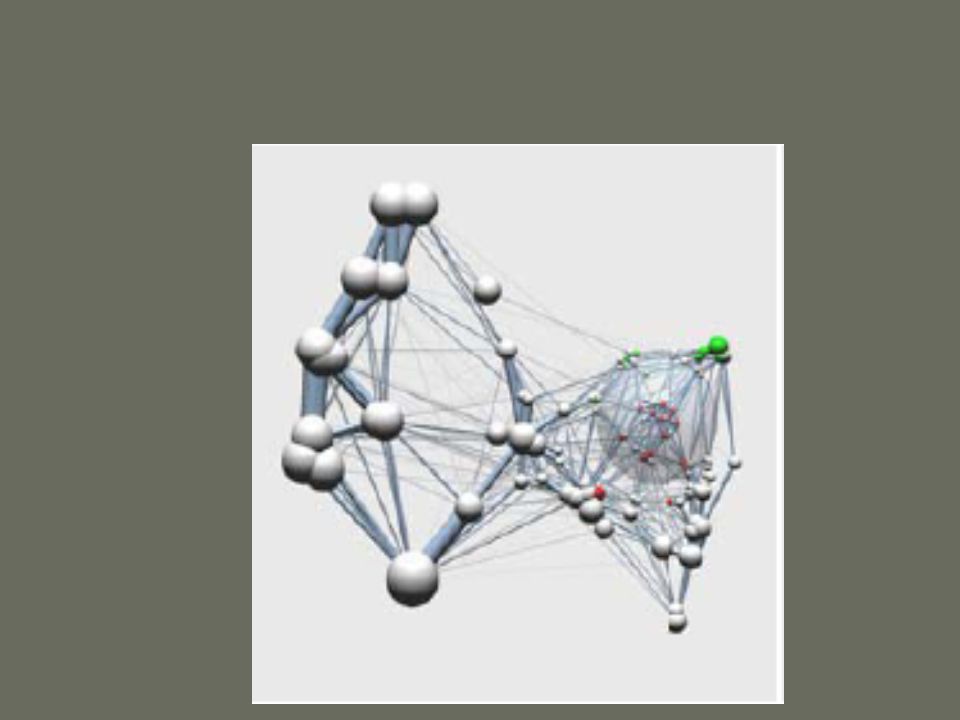
SMALL WORLD GRAPH Physics and Clustering DOA Layout Handle Occlusion in 2D 50% Done DOA Layout Things become more/less abstract in relation to the cursor 3 different focal areas BUT Some strange discontinuities (bugs) Need to integrate geometric distortion
 Need to integrate geometric distortion")
Similar presentations
 - Tiles -. You can find T TT TILES in bathrooms and kitchens. The decorations alternate colours to make patterns.>")


 Yu.>")
![1 Presented by Jean-Daniel Fekete. 2 Motivation Mélange [Elmqvist 2008] Multiple Focus Regions.](/15/4851107/big_thumb.jpg "1 Presented by Jean-Daniel Fekete. 2 Motivation Mélange [Elmqvist 2008] Multiple Focus Regions.>")


 2.>")


