Download presentation
Presentation is loading. Please wait.

1
Hubbert and the Oil Peak VT Law School Class 2 Gary Flomenhoft http://www.uvm.edu/~gflomenh/ VTLAW-EcoEcon

2
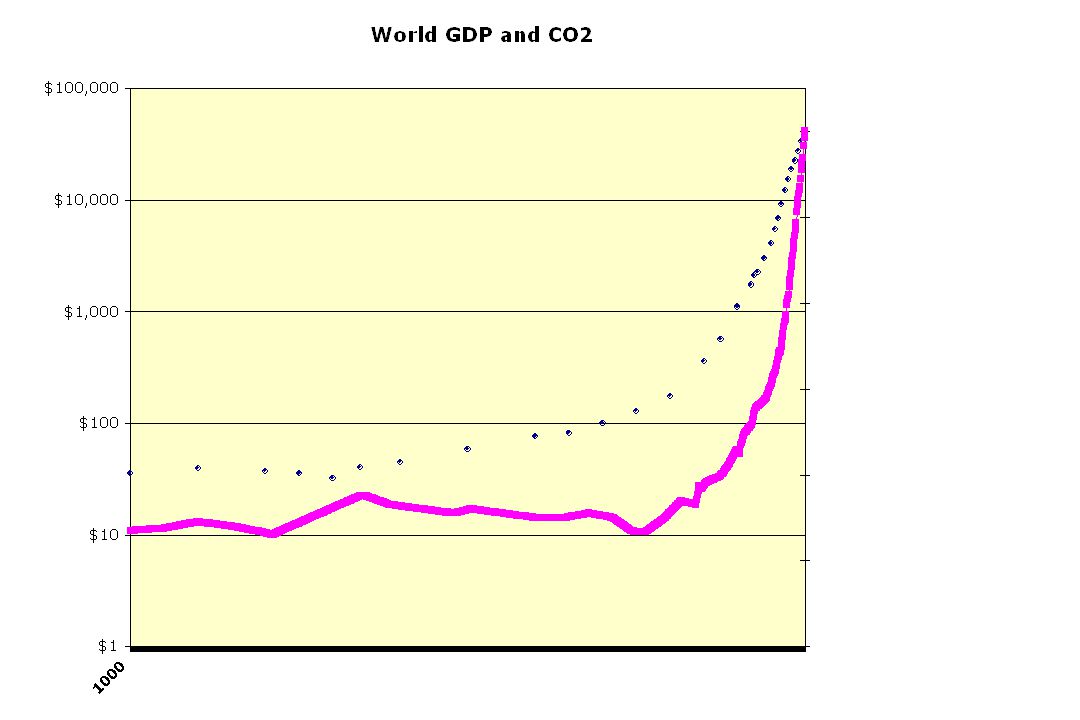
The “OIL PEAK”

3
Source: Smil (1991)
")
4
0 25 50 75 100 180018251850187519001925195019752000 Composition of U.S. Energy Use wood animal feed coal oil gas electricity Percent of total energy use

6
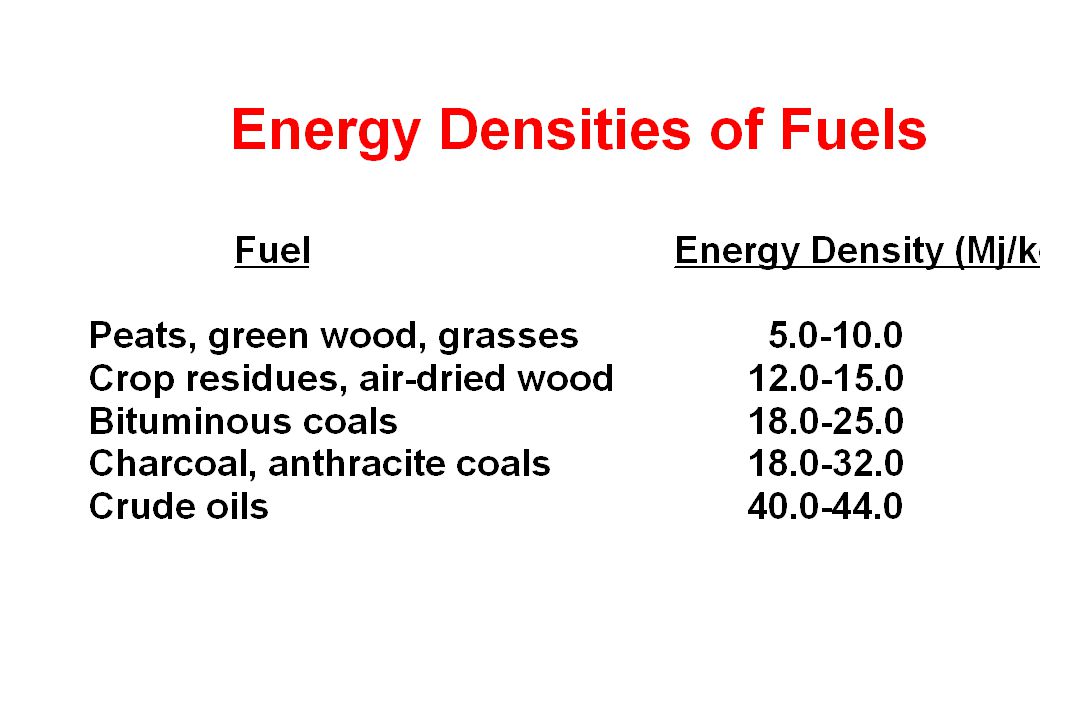
Energy Rate of Return

8
Fuel Domesticated Animals Labor Work Done in the U.S. Economy, 1850-1970

9
The Epoch of Fossil Fuel Exploitation (after Hubbert, 1969) 0 -5 -4-3 -2 +1 +2+3 +4 +5 Iron in Middle East Stonehenge Built Parthenon completed Pyramids constructed Mayan culture Inquisition Black Death Magellan's Circumnavigation Steam Engine 100 200 300 Trillion kwh per year
 Iron in Middle East Stonehenge Built Parthenon completed Pyramids constructed Mayan culture Inquisition Black Death Magellan s Circumnavigation Steam Engine Trillion kwh per year")
10
Hubbert Oil Cycle

11
US Oil Extraction

12
Results- Various Countries Algeria (EUR=26.09 BBO) Mexico (EUR=65.0 BBO) Norway (EUR=35.2 BBO) Romania (EUR=7.3 BBO)
 Mexico (EUR=65.0 BBO) Norway (EUR=35.2 BBO) Romania (EUR=7.3 BBO)")
13
World Oil Extraction

14
Various National Patterns USA – E.g.. of a net consumer Venezuela – E.g. of a net producer High reserves (~ 3000 BBO) and low economic growth scenario
 and low economic growth scenario.")
15
Various National Patterns Mexico– E.g.. of a country that switches over from net producer to net consumer in the future. U.A.E. – E.g. of a swing producer. High reserves (~ 3000 BBO) and low economic growth scenario
 and low economic growth scenario.")
16
Forecasting Oil Production Source : US DOE (EIA), website. U = ~ 3000 (mean estimate of the USGS 2000). Peak Production = 2037
. Peak Production =")
17
World Oil Extraction

19
World Oil Consumption

20
World Oil Flows

21
Julian Simon view: technological developments and human ingenuity will yield more resourcesJulian Simon view: technological developments and human ingenuity will yield more resources –“Drowning in oil” The Economist, March 6 th - 12 th 1999, pp. 23-25 Colin Campbell, et al. use Hubbert curves to predict the end of oilColin Campbell, et al. use Hubbert curves to predict the end of oil –“The End of Cheap Oil” Scientific American, March 1998, pp. 78-83 (Campbell and Laherrere) Two Views S. Gürcan Gülen, Ph.D.
 Two Views S. Gürcan Gülen, Ph.D..")
22
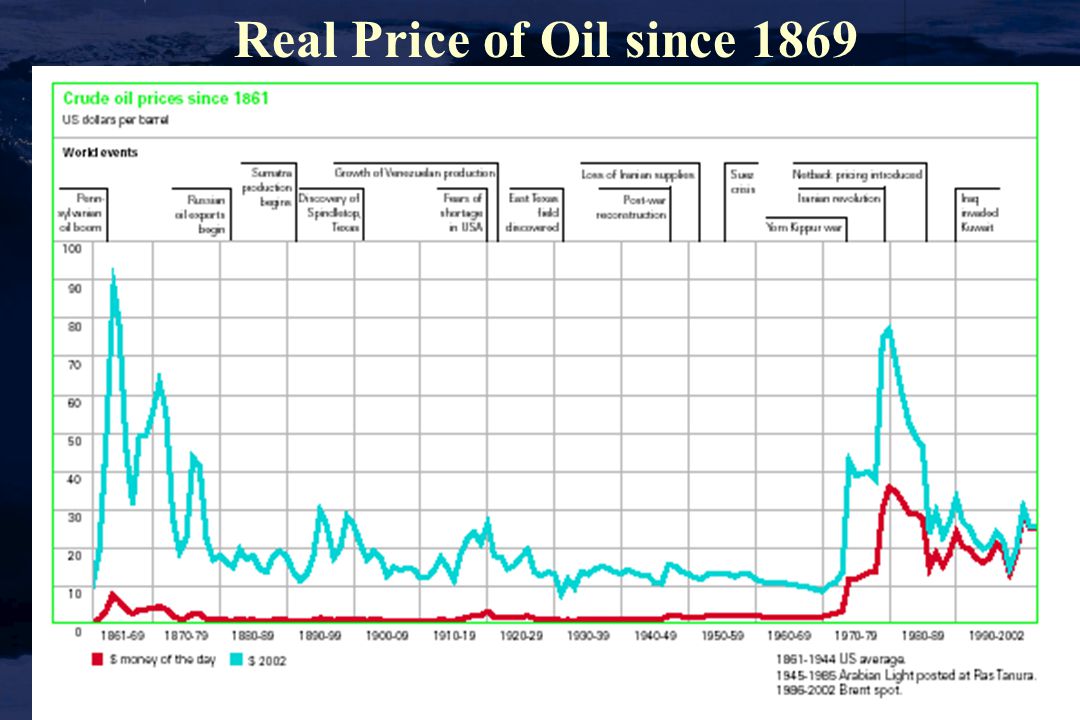
Real Price of Oil since 1869

24
Oil Reserve/Production ratio

25
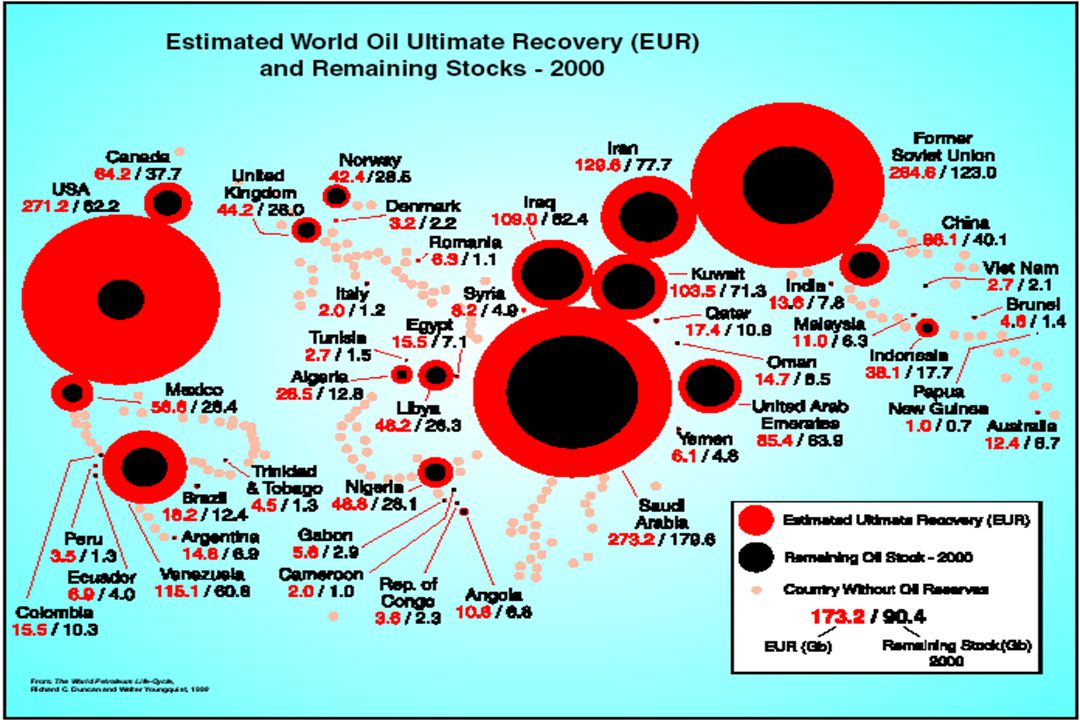
Oil Reserves

26
“Proven” oil reserves

27
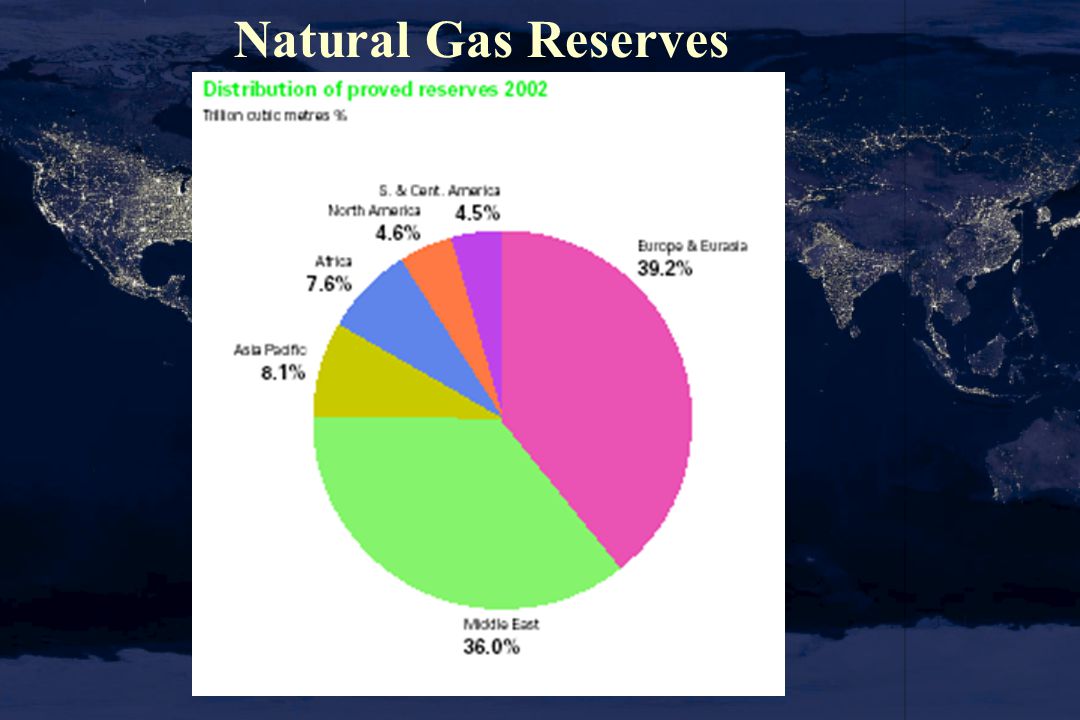
Natural Gas Reserves

29
Coal Reserves

31
Hummer H1 Sticker price $106,185 Current law Equipment deduction $25,000 Total tax deduction* $60,722 Bush economic plan Equipment deduction $75,000 Total tax deduction* $88,722 * Includes bonus tax write-off enacted by Congress in March 2002 and a deduction for normal depreciation. Sources: Detroit News research, IRS, Taxpayers for Common Sense Gas Hog Tax Credit

32
Cars per Thousand People Source: JustAuto.com “Today there are 670 million vehicles in the world. By 2050 that number is expected to increase to 4.5 billion or maybe more.” Thomas Gross, US DOE

34
China Energy use 1997

36
Source: EPA

37
Heinberg Chapter 1 How to gain an Energy Subsidy 1) Takeover 2) Tool Use 3) Specialization 4) Scope Enlargement 5) Drawdown
 Takeover 2) Tool Use 3) Specialization 4) Scope Enlargement 5) Drawdown")
38
Takeover Biotic Potential / Competitive exclusion Use / divert: 40% Earth’s terrestrial NPP 25% Total NPP

39
Drawdown Deplete non-renewable stocks: Coal, oil, natural gas, uranium, minerals, etc. Dangers of Drawdown: Pollution Climate change Depletion

40
Complexity-diminishing returns

41
Complexity Increasing costs of: Maintaining organization and control Controlling conquered territory Taxation

42
American success Great natural resources Energy subsidies: slaves then fossil fuels Global trade

45
Other Extinct cultures Rapa Nui- (Easter Island) Mangaia Mangereva Pitcairn Henderson Exception: Tikopia
 Mangaia Mangereva Pitcairn Henderson Exception: Tikopia")
Similar presentations


 Three reasons for concern: 1. Volatile.>")


