Download presentation
Presentation is loading. Please wait.

1
Results from the 2006 National Survey on Drug Use and Health (NSDUH) Briefing for DHHS, September 5, 2007 Joe Gfroerer Office of Applied Studies Substance Abuse and Mental Health Services Administration
 Briefing for DHHS, September 5, 2007 Joe Gfroerer Office of Applied Studies Substance Abuse and Mental Health Services Administration")
2
2 NSDUH Design Representative nationally and in each State Civilian, noninstitutional population, age 12+ Face-to-face interview Computer-assisted, self-administered 67,802 respondents in 2006 Data comparable with 2002, 2003, 2004, and 2005, but not with data prior to 2002

3
3 Illicit Drug Use

4
4 Past Month Use of Specific Illicit Drugs among Persons Aged 12 or Older: 2006 Numbers in Millions Psychotherapeutics Inhalants Heroin Hallucinogens Cocaine Marijuana Illicit Drugs

5
5 Past Month Use of Selected Illicit Drugs among Persons Aged 12 or Older: 2002-2006 Fig 2.2 Percent Using in Past Month + Difference between this estimate and the 2006 estimate is statistically significant at the.05 level.

6
6 Past Month Nonmedical Use of Prescription Drugs (Psychotherapeutics) among Persons 12+:2002-2006 Percent Using in Past Month + Difference between this estimate and the 2006 estimate is statistically significant at the.05 level.
 among Persons 12+: Percent Using in Past Month + Difference between this estimate and the 2006 estimate is statistically significant at the.05 level.")
7
7 Source Where Pain Relievers Were Obtained for Most Recent Nonmedical Use among Past Year Users Aged 12 or Older: 2006 Note: Totals may not sum to 100% because of rounding or because suppressed estimates are not shown. 1 The Other category includes the sources: “Wrote Fake Prescription,” “Stole from Doctor’s Office/Clinic/Hospital/Pharmacy,” and “Some Other Way.” Bought/Took from Friend/Relative 14.8% Drug Dealer/ Stranger 3.9% Bought on Internet 0.1% Other 1 4.9% Free from Friend/Relative 7.3% Bought/Took from Friend/Relative 4.9% One Doctor 80.7% Drug Dealer/ Stranger 1.6% Other 1 2.2% Source Where Respondent Obtained Source Where Friend/Relative Obtained One Doctor 19.1% More than One Doctor 1.6% Free from Friend/Relative 55.7% More than One Doctor 3.3%

8
8 Past Month Illicit Drug Use among Persons Aged 12+, by Age: 2002-2006 Percent Using in Past Month Age in Years + Difference between this estimate and the 2006 estimate is statistically significant at the.05 level.

9
9 Past Month Use of Selected Illicit Drugs among Youths Aged 12 to 17: 2002-2006 Fig 2.5 Percent Using in Past Month + Difference between this estimate and the 2006 estimate is statistically significant at the.05 level.

10
10 Past Month Marijuana Use among Youths Aged 12 to 17, by Gender: 2002-2006 Fig 2.9 Percent Using in Past Month + Difference between this estimate and the 2006 estimate is statistically significant at the.05 level.

11
11 Past Month Use of Selected Illicit Drugs among Young Adults Aged 18 to 25: 2002-2006 Fig 2.6 Percent Using in Past Month + Difference between this estimate and the 2006 estimate is statistically significant at the.05 level.

12
12 Past Month Nonmedical Use of Prescription Drugs among Young Adults Aged 18 to 25: 2002-2006 Percent Using in Past Month + Difference between this estimate and the 2006 estimate is statistically significant at the.05 level.

13
13 Illicit Drug Use among Adults Aged 50 to 54, by Type of Drug: 2002-2006 Percent Using in Past Month 3.4 + 3.9 + 5.2 4.8 6.0 + Difference between this estimate and the 2006 estimate is statistically significant at the.05 level.

14
14 New Estimates of Methamphetamine Use New questions added to 2005 and 2006 NSDUH outside core stimulants module to capture meth use among those who may have failed to report it in core Resulted in 15-25% increase in prevalence of meth use However, estimates for meth incidence, and composite prevalences (e.g., any stimulant, any psychotherapeutic, any illicit) do not incorporate data from the new meth questions. Estimates of meth use for 2002-2005 are statistically adjusted for comparability with new 2006 meth estimates Issue: Respondents may underreport use of methamphetamine because questions are embedded in core prescription stimulant module.

15
15 Past Year Methamphetamine Use among Persons Aged 12+, by Age: 2002-2006 Percent Using in Past Year Age in Years + Difference between this estimate and the 2006 estimate is statistically significant at the.05 level. Note: Estimates are based on new 2006 questions. 2002-2005 estimates are adjusted for comparability.

16
16 Past Year Methamphetamine Use among Persons Aged 12+, by Region: 2002 and 2006 Percent Using in Past Year + Difference between this estimate and the 2006 estimate is statistically significant at the.05 level. Note: Estimates are based on new 2006 questions. 2002 estimates are adjusted for comparability.

17
17 Past Month Alcohol Use Any Use: 51%(125 million) Binge Use:23%(57 million) Heavy Use: 7%(17 million) (Current, Binge, and Heavy Use estimates are similar to those in 2002, 2003, 2004, and 2005)
 Binge Use:23%(57 million) Heavy Use: 7%(17 million) (Current, Binge, and Heavy Use estimates are similar to those in 2002, 2003, 2004, and 2005)")
18
18 Past Month Alcohol Use among Persons Aged 12 to 20, by Age: 2002-2006 Percent Using in Past Month + Difference between this estimate and the 2006 estimate is statistically significant at the.05 level.

19
19 Heavy Alcohol Use among Adults Aged 18 to 22, by College Enrollment: 2002-2006 Fig 3.4 Percent Using in Past Month + Difference between this estimate and the 2006 estimate is statistically significant at the.05 level.

20
20 Driving Under the Influence of Alcohol in the Past Year among Persons Aged 12 or Older: 2002-2006 Fig 3.5 Percent Driving Under the Influence in Past Year + Difference between this estimate and the 2006 estimate is statistically significant at the.05 level.

21
21 Tobacco Use

22
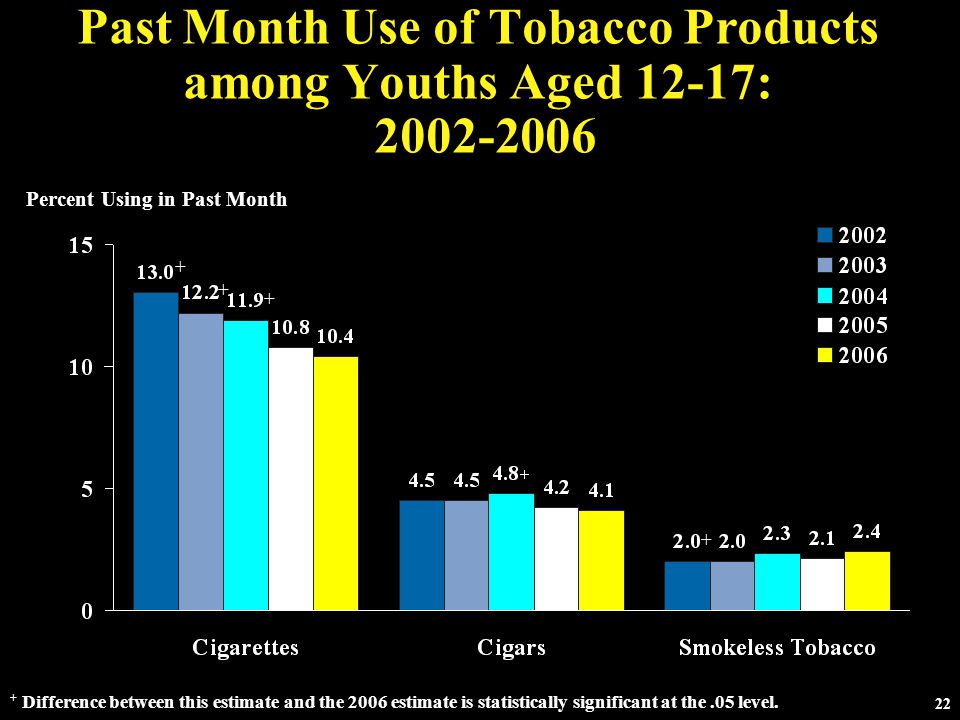
22 Past Month Use of Tobacco Products among Youths Aged 12-17: 2002-2006 Percent Using in Past Month + Difference between this estimate and the 2006 estimate is statistically significant at the.05 level. + + + +
23
23 Past Month Cigarette Use among Persons Aged 12 or Older, by Age: 2006 Percent Using in Past Month Age in Years Fig 4.3

24
24 Past Month Cigarette Use among Women Aged 15 to 44, by Age and Pregnancy Status: 2005-2006 Combined Fig 4.5 Percent Using in Past Month Age in Years

25
25 Initiation of Substance Use

26
26 Past Year Initiates for Specific Illicit Drugs among Persons Aged 12 or Older: 2006 Fig 5.1 Numbers in Thousands MarijuanaHeroin Pain Relievers Cocaine LSDTranquilizersPCPInhalantsEcstasy StimulantsSedatives

27
27 Mean Age at First Use for Specific Illicit Drugs among Past Year Initiates Aged 12 to 49: 2006 Fig 5.2 Age in Years PCP StimulantsHeroin Ecstasy Marijuana TranquilizersLSD CocaineInhalants Pain Relievers Sedatives

28
28 Past Year Marijuana Initiates among Persons Aged 12 or Older and Mean Age at First Use of Marijuana among Past Year Marijuana Initiates Aged 12 to 49: 2002-2006 Fig 5.3 Numbers in Millions Past Year Initiates Age in Years Mean Age at First Use 1 1 Mean-age-at-first-use estimates are for recent initiates aged 12 to 49. + Difference between this estimate and the 2006 estimate is statistically significant at the.05 level.

29
29 Past Year Ecstasy Initiates among Persons Aged 12 or Older and Mean Age at First Use of Ecstasy among Past Year Ecstasy Initiates Aged 12 to 49: 2002-2006 Fig 5.4 Numbers in Thousands Past Year Initiates Age in Years Mean Age at First Use 1 1 Mean-age-at-first-use estimates are for recent initiates aged 12 to 49. + Difference between this estimate and the 2006 estimate is statistically significant at the.05 level.

30
30 Past Year Methamphetamine Initiates among Persons Aged 12 or Older and Mean Age at First Use of Methamphetamine among Past Year Methamphetamine Initiates Aged 12 to 49: 2002-2006 Fig 5.5 Numbers in Thousands Past Year Initiates Age in Years Mean Age at First Use 1 1 Mean-age-at-first-use estimates are for recent initiates aged 12 to 49. + Difference between this estimate and the 2006 estimate is statistically significant at the.05 level.

31
31 Past Year Cigarette Initiates among Persons Aged 12 or Older, by Age at First Use: 2002-2006 Numbers in Millions 1.9 + 2.0 + 2.3 Fig 5.6 2.1 + + Difference between this estimate and the 2006 estimate is statistically significant at the.05 level. 2.4

32
32 Youth Prevention-Related Measures: Perceived Risk of Harm (“physically and in other ways”) and Perceived Availability (“fairly or very easy to get”)
 and Perceived Availability ( fairly or very easy to get )")
33
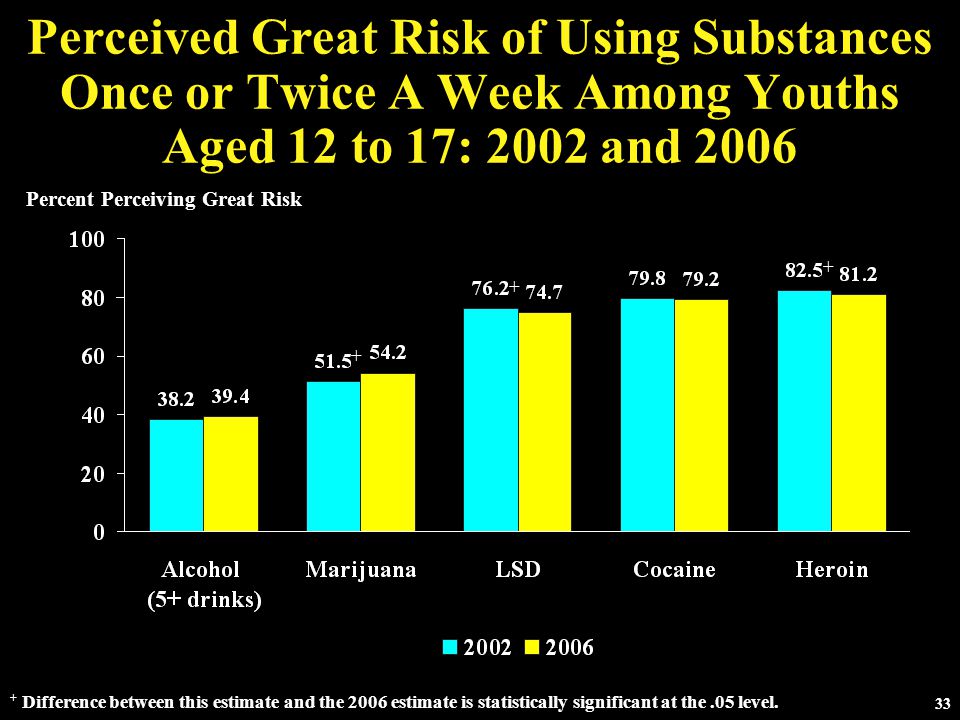
33 Perceived Great Risk of Using Substances Once or Twice A Week Among Youths Aged 12 to 17: 2002 and 2006 Percent Perceiving Great Risk + Difference between this estimate and the 2006 estimate is statistically significant at the.05 level. + + +
34
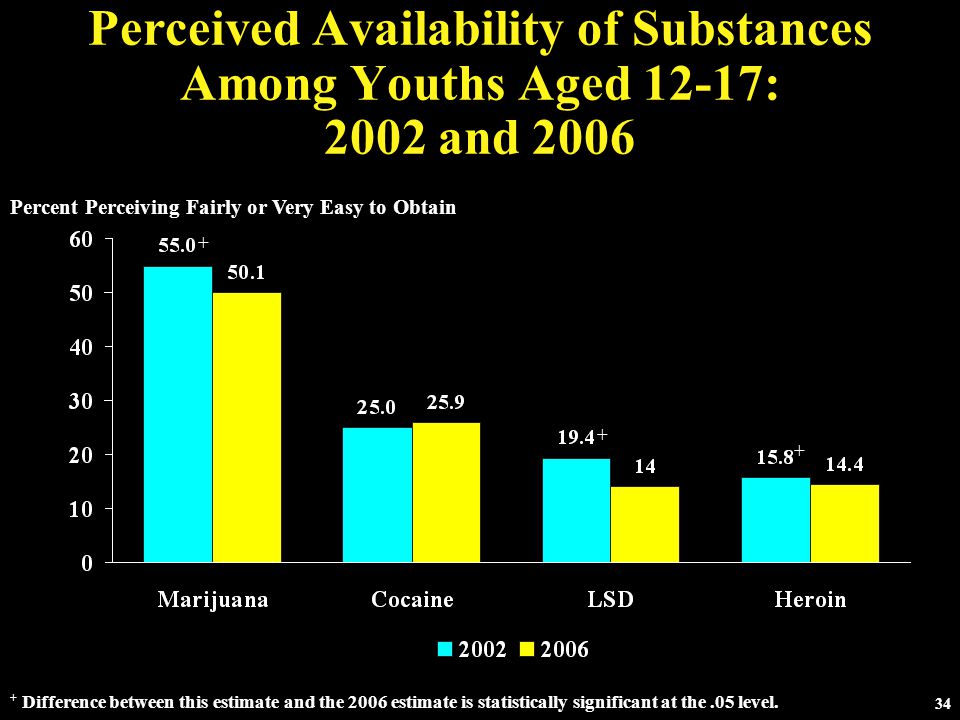
34 Perceived Availability of Substances Among Youths Aged 12-17: 2002 and 2006 Percent Perceiving Fairly or Very Easy to Obtain + Difference between this estimate and the 2006 estimate is statistically significant at the.05 level. + + +
35
35 Substance Dependence and Abuse (DSM-IV) and Treatment
 and Treatment")
36
36 Substance Dependence or Abuse in the Past Year among Persons Aged 12+: 2002-2006 Fig 7.1 Numbers in Millions 3.2 3.1 3.3 3.4 3.2 22.0 21.6 22.2 22.5 22.6 + Difference between this estimate and the 2006 estimate is statistically significant at the.05 level. Note: Due to rounding, the percentages may not add to the total.

37
37 Dependence on or Abuse of Specific Illicit Drugs in the Past Year among Persons Aged 12 or Older: 2006 Fig 7.2 Numbers in Thousands

38
38 Need for and Receipt of Specialty Treatment in the Past Year for Illicit Drug or Alcohol Use among Persons Aged 12 or Older: 2006 Numbers in Millions Needing Treatment in Past Year 7.8 19.5 23.6 (20%)(8%)(11%) Note: Percentages in parentheses represent the percentage of persons who received specialty treatment among those who needed treatment. Note: Due to rounding, the estimates may not add to the total.

39
39 21.1 Million Needing But Not Receiving Treatment for Illicit Drug or Alcohol Use Felt They Needed Treatment and Did Make an Effort (314,000) Did Not Feel They Needed Treatment (20,114,000) Felt They Needed Treatment and Did Not Make an Effort (625,000) 1.5% 95.5% Past Year Perceived Need for and Effort Made to Receive Treatment among Persons Aged 12+ Needing But Not Receiving Specialty Treatment for Illicit Drug or Alcohol Use: 2006 Fig 7.7
 Did Not Feel They Needed Treatment (20,114,000) Felt They Needed Treatment and Did Not Make an Effort (625,000) 1.5% 95.5% Past Year Perceived Need for and Effort Made to Receive Treatment among Persons Aged 12+ Needing But Not Receiving Specialty Treatment for Illicit Drug or Alcohol Use: 2006 Fig 7.7")
40
40 Reasons for Not Receiving Substance Use Treatment among Persons Aged 12+ Who Needed and Made Effort to Get Treatment But Did Not Receive Specialty Treatment and Felt They Needed Treatment: 2004-2006 Combined Fig 7.8 Percent Reporting Reason Not Ready to Stop Using No Program Having Type of Treatment No Health Coverage and Could Not Afford Cost No Transportation/Inconvenient Might Cause Neighbors/Community to Have Negative Opinion Able to Handle Problem without Treatment

41
41 Locations Where Past Year Substance Use Treatment Was Received among Persons Aged 12 or Older: 2006 Fig 7.5 Numbers in Thousands * Specialty Substance Use Treatment.

42
42 Substances for Which Most Recent Treatment Was Received in the Past Year among Persons Aged 12 or Older: 2006 Fig 7.6 Numbers in Thousands

43
43 Substances for Which Most Recent Treatment Was Received in the Past Year among Youths Aged 12 to 17: 2006 Numbers in Thousands

44
44 Prevalence and Treatment of Mental Health Problems

45
45 Major Depressive Episode in the Past Year among Youths Aged 12 to 17, by Year, Gender, and Age: 2004-2006 Percent with MDE in Past Year 2004 + Difference between this estimate and the 2006 estimate is statistically significant at the.05 level. 20052006MaleFemale 2006 12-1314-1516-17

46
46 Major Depressive Episode in the Past Year among Adults Aged 18 or Older, by Year, Gender, and Age: 2004-2006 Percent with MDE in Past Year 2004 + Difference between this estimate and the 2006 estimate is statistically significant at the.05 level. 20052006MaleFemale18-2526-4950+ 2006

47
47 Serious Psychological Distress in the Past Year among Adults Aged 18 or Older, by Year, Gender, and Age: 2004-2006 Percent with SPD in Past Year 2004 + Difference between this estimate and the 2006 estimate is statistically significant at the.05 level. 20052006MaleFemale18-2526-4950+ 2006

48
48 Co-Occurrence of Serious Psychological Distress and Substance Use Disorder in the Past Year among Adults Aged 18 or Older: 2006 15.0 Million 19.3 Million Co-Occurring SUD and SPD Substance Use Disorder (SUD) Only Serious Psychological Distress (SPD) Only 5.6 Million
 Only Serious Psychological Distress (SPD) Only 5.6 Million")
49
49 Past Year Treatment among Adults Aged 18 or Older with Both Serious Psychological Distress and a Substance Use Disorder: 2006 Fig 8.2 5.6 Million Adults with Co-Occurring SPD and Substance Use Disorder Treatment for Substance Use Problems Only (154,000) Treatment for Both Mental Health and Substance Use Problems (467,000) No Treatment (2,737,000) 39.6% 49.2% 8.4% 2.8% Treatment for Mental Health Problems Only (2,197,000)
 Treatment for Both Mental Health and Substance Use Problems (467,000) No Treatment (2,737,000) 39.6% 49.2% 8.4% 2.8% Treatment for Mental Health Problems Only (2,197,000)")
50
50 Past Year Treatment for Mental Health Problems among Adults Aged 18 or Older, by Type of Treatment: 2002-2006 Fig 8.6 Percent Receiving Treatment in the Past Year + Difference between this estimate and the 2006 estimate is statistically significant at the.05 level.

51
51 Reasons for Not Receiving Mental Health Treatment in the Past Year among Adults Aged 18 or Older with an Unmet Need for Treatment Who Did Not Receive Treatment: 2006 Fig 8.7 Percent among Adults Who Did Not Receive Treatment Could Not Afford Cost Did Not Have Time Could Handle Problem without Treatment at the Time Did Not Know Where to Go for Services Might Cause Neighbors/Community to Have Negative Opinion Did Not Feel Need for Treatment Might Have Negative Effect on Job Treatment Would Not Help Fear of Being Committed/ Have to Take Medicine Did Not Want Others to Find Out

52
52 Trends: Comparisons with Other Surveys

53
53 Average Annual Percent Changes in Youth Substance Use, by Survey NSDUH (Aged 12-17) 2002-2006 MTF (8 th, 10 th, 12 th ) 2001-2006 YRBS (9 th – 12 th ) 2001-2005 Illicit Drugs (PM)-4.1%-6.3%N.A. Marijuana (PM)-4.9%-6.7%-4.2% Cocaine (LT)-5.0%-2.1%-5.2% Methamph. (LT)-6.4%-12.7%-10.8% Alcohol (PM)-1.4%-3.3%-2.1% Cigarettes (PM)-5.4%-8.2%-5.2% Note:Numbers reflect the percent change occurring each year that would result in the overall change in prevalence from the base year to 2006. PM=Past Month; LT=Lifetime.
-4.9%-6.7%-4.2% Cocaine (LT)-5.0%-2.1%-5.2% Methamph. (LT)-6.4%-12.7%-10.8% Alcohol (PM)-1.4%-3.3%-2.1% Cigarettes (PM)-5.4%-8.2%-5.2% Note:Numbers reflect the percent change occurring each year that would result in the overall change in prevalence from the base year to PM=Past Month; LT=Lifetime..")
54
54 Marijuana and Cocaine Use among Young Adults: NSDUH and MTF, 2002-2006 Percent Using in Past Year Marijuana Cocaine

55
55 Ecstasy and LSD Use among Young Adults: NSDUH and MTF, 2002-2006 Percent Using in Past Year Ecstasy LSD

56
56 Next from NSDUH Short reports using 2006 data Report on impact of Katrina and Rita on Gulf region (Fall 2007) (2004-2006 data) Report on underage alcohol use (Spring 2008) (2002-2006 data) 2006 State report (Spring 2008) 2006 Substate Report (Summer 2008) 2006 public use data file (Fall 2007)
 ( data) Report on underage alcohol use (Spring 2008) ( data) 2006 State report (Spring 2008) 2006 Substate Report (Summer 2008) 2006 public use data file (Fall 2007)")
Similar presentations


>")


, get through the day (cigarettes),>")