Download presentation
Presentation is loading. Please wait.

1
Detecting topological patterns in protein networks Sergei Maslov Brookhaven National Laboratory

2
What defines a complex system? Complex system has many interacting components (10 11 neurons, 10 4 types of proteins, 10 6 routers, 10 9 web pages) All components are different from each other Systems traditionally studied by physics also have many interacting components (10 23 electrons in a superconductor) But they are all the same!
 All components are different from each other Systems traditionally studied by physics also have many interacting components (10 23 electrons in a superconductor) But they are all the same!.")
3
Networks in complex systems The simplest question about a complex system: who interacts with whom? The answer can be visualized as a network Network is the backbone of a complex system

4
Why study the topology of complex networks? Lots of easily available data: that’s where the state of the art information is (at least in biology) Large networks may contain information about basic design principles and/or evolutionary history of the complex system This is similar to paleontology: learning about an animal from its backbone
 Large networks may contain information about basic design principles and/or evolutionary history of the complex system This is similar to paleontology: learning about an animal from its backbone.")
5
Complex networks are the right description when things are interconnected

6
Internet From Y. Tu, “How robust is the Internet?”, Nature 406, 353 (2000)
")
8
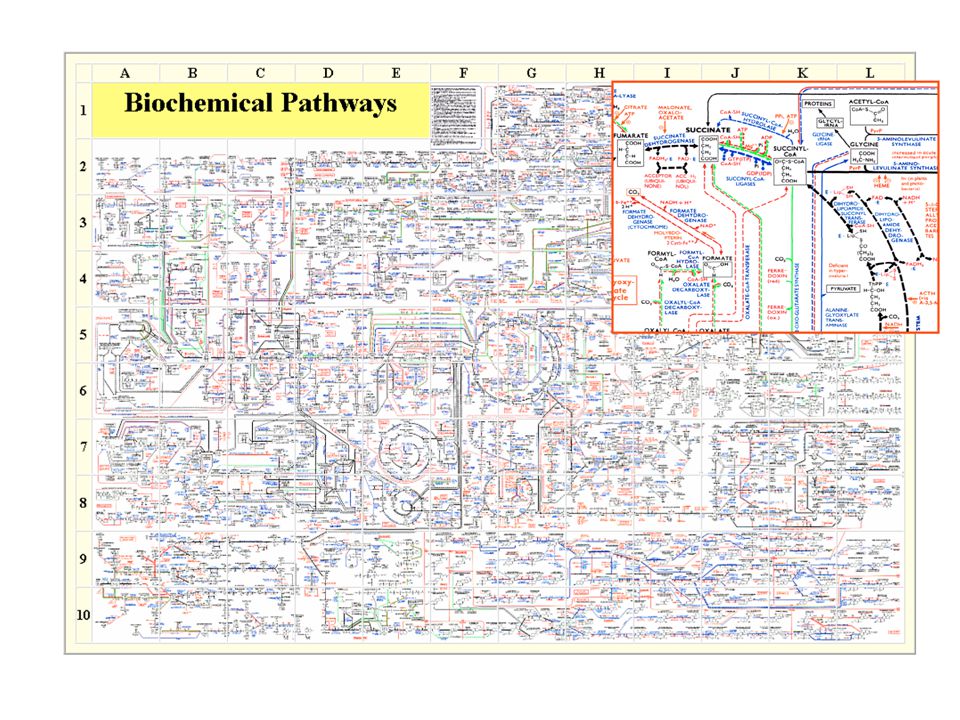
Hierarchy of bio-networks Metabolic network: production of necessary chemical compounds Binding network: enzymes bind to their substrates in a metabolic network and to other proteins to form complexes Regulatory network: turns on and off particular groups of proteins in response to signals HIGHER LEVELS: cell-to cell communication (e.g. neurons in a brain), food webs, social networks, etc.
, food webs, social networks, etc..")
9
Protein binding network

11
Transcription regulatory networks Prokaryotic bacterium: E. coli Single-celled eukaryote: S. cerevisiae

12
General properties Densely interconnected Not very modular: functional modules talk to each other Have many random features Few proteins (hubs) interact with a lot of neighbors: but most – with just one
 interact with a lot of neighbors: but most – with just one")
13
in- and out-degree of nodes Out-degree K out =5 In-degree K in =2

14
How many transcriptional regulators are out there?

15
Fraction of transcriptional regulators in bacteria from Stover et al., Nature (2000)
")
16
From E. van Nimwegen, Trends in Genetics, 2003

17
Complexity of regulation grows with complexity of organism N R =N =number of edges N R /N= / increases with N grows with N In bacteria N R ~N 2 (Stover, et al. 2000) In eucaryots N R ~N 1.3 (van Nimwengen, 2002) Networks in more complex organisms are more interconnected then in simpler ones Life is not just a bunch of independent modules!
 In eucaryots N R ~N 1.3 (van Nimwengen, 2002) Networks in more complex organisms are more interconnected then in simpler ones Life is not just a bunch of independent modules!.")
18
Complexity is manifested in K in distribution E. coli vs. S. cerevisiae vs. H. sapiens

19
Beyond degree distributions: How is it all wired together?

20
Central vs peripheral network architecture central (hierarchical) peripheral (anti-hierarchical) From A. Trusina, P. Minnhagen, SM, K. Sneppen, Phys. Rev. Lett. (2004) random
 random.")
21
Correlation profile Count N(k 0,k 1 ) – the number of links between nodes with connectivities k 0 and k 1 Compare it to N r (k 0,k 1 ) – the same property in a random network Qualitative features are very noise- tolerant with respect to both false positives and false negatives
 – the number of links between nodes with connectivities k 0 and k 1 Compare it to N r (k 0,k 1 ) – the same property in a random network Qualitative features are very noise- tolerant with respect to both false positives and false negatives")
22
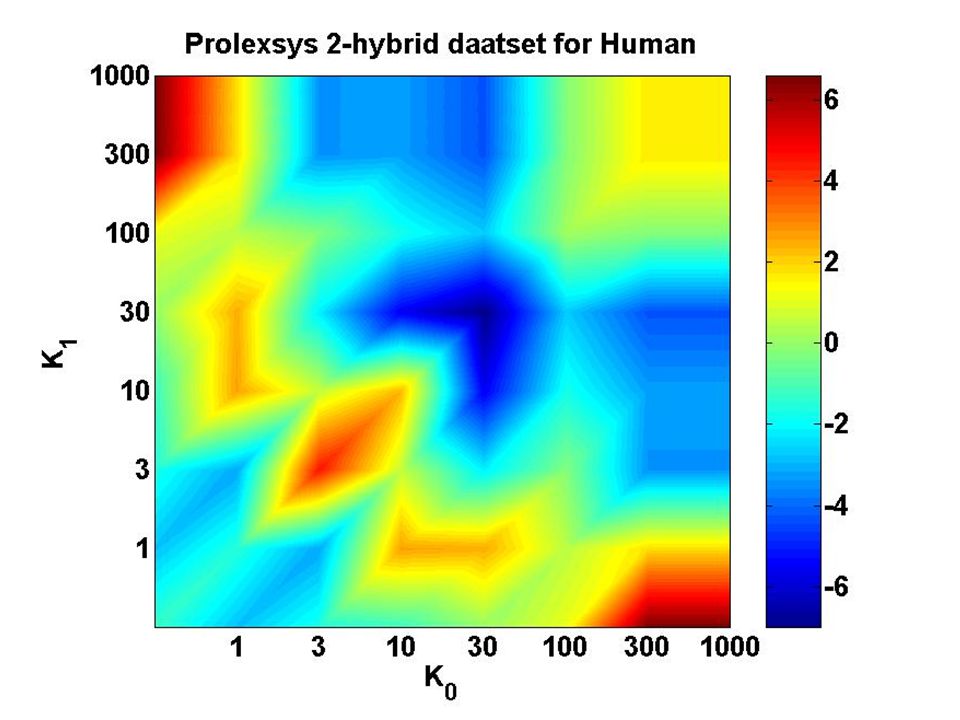
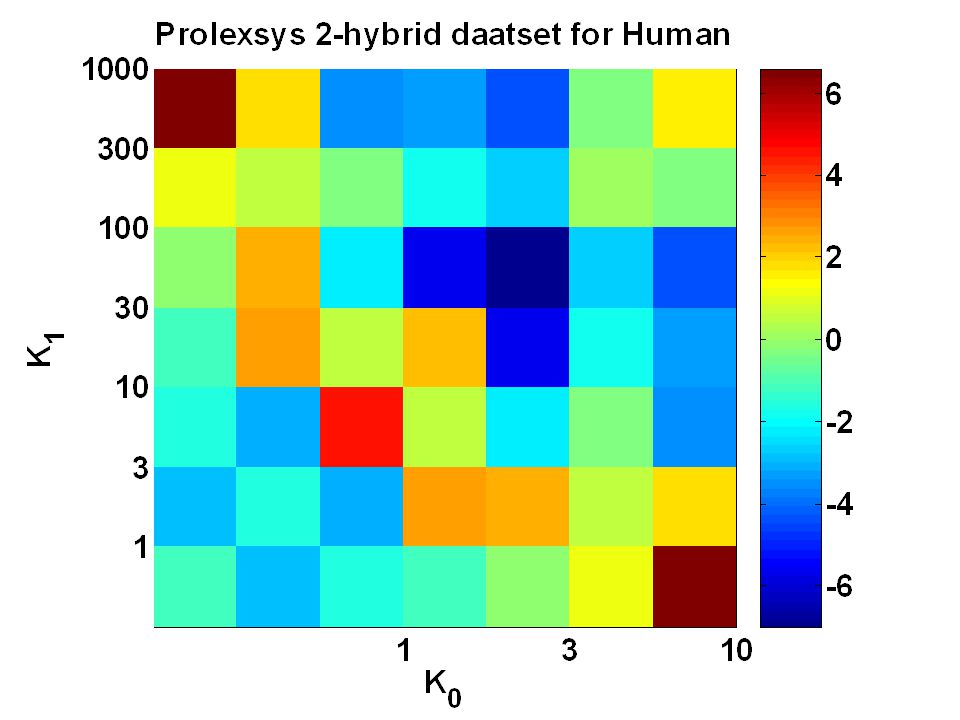
Correlation profile of the protein interaction network R(k 0,k 1 )=N(k 0,k 1 )/N r (k 0,k 1 ) Z(k 0,k 1 ) =(N(k 0,k 1 )-N r (k 0,k 1 ))/ N r (k 0,k 1 ) Similar profile is seen in the yeast regulatory network
=N(k 0,k 1 )/N r (k 0,k 1 ) Z(k 0,k 1 ) =(N(k 0,k 1 )-N r (k 0,k 1 ))/ N r (k 0,k 1 ) Similar profile is seen in the yeast regulatory network")
23
Some scale-free networks may appear similar In both networks the degree distribution is scale-free P(k)~ k - with ~2.2-2.5
~ k - with ~")
24
But: correlation profiles give them unique identities InternetProtein interactions

25
How to construct a proper random network?

26
Null-model of a network Distribution of degrees is non-random: the degree of every node has to be conserved in a random network Other topological properties may be also conserved as well: The extent of modularity (by function, sub-cellular localization, etc.) Small motifs (e.g feed-forward loops)
 Small motifs (e.g feed-forward loops)")
27
Randomization given complex network random

28
Edge swapping (rewiring) algorithm Randomly select and rewire two edges Repeat many times SM, K. Sneppen, Science (2002)
.")
29
Metropolis rewiring algorithm Randomly select two edges Calculate change E in “energy function” E=(N actual -N desired ) 2 /N desired Rewire with probability p=exp(- E/T) “energy” E “energy” E+ E SM, K. Sneppen: preprint (2002), Physica A (2004)
, Physica A (2004).")
30
How do protein networks evolve?

31
Gene duplication Pair of duplicated proteins Shared interactions Pair of duplicated proteins Shared interactions Right after duplicationAfter some time

32
Yeast regulatory network SM, K. Sneppen, K. Eriksen, K-K. Yan 2003

33
100 million years ago

34
Network properties of self-binding proteins AKA homodimers

35
There are just TOO MANY homodimers Null-model P self ~ /N N dimer =N P self = Not surprising as homodimers have many functional roles

36
Network properties around homodimers

37
Fly: two-hybrid dataHuman: database data Likelihood to self-interact vs. K P self ~0.05, P others ~0.0002P self ~0.003, P others ~0.0002

38
What we think it means? In random networks p dimer (K)~K 2 not ~K like our empirical observation K is proportional to the “stickiness” of the protein which in its turn scales with the area of hydrophobic residues on the surface # copies/cell its’ popularity (in datasets taken from databases) etc. Real interacting pair consists of an “active” and “passive” protein and binding probability scales only with the “stickiness” of the active protein “Stickiness” fully accounts for higher than average connectivity of homodimers
~K 2 not ~K like our empirical observation K is proportional to the stickiness of the protein which in its turn scales with the area of hydrophobic residues on the surface # copies/cell its’ popularity (in datasets taken from databases) etc. Real interacting pair consists of an active and passive protein and binding probability scales only with the stickiness of the active protein Stickiness fully accounts for higher than average connectivity of homodimers.")
39
Summary Living cells contain many complex protein networks Networks in more complex organisms are more interconnected Most have hubs – highly connected proteins Hubs often avoid each other (networks are anti- hierarchical) Networks evolve by gene duplications There are many self-interacting proteins. Probability to self-interact linearly scales with the degree K.

40
Collaborators: Kim Sneppen – U. of Copenhagen Kasper Eriksen – U. of Lund Koon-Kiu Yan – Stony Brook Ilya Mazo, Jaroslav Ispolatov, Anton Yuryev – Ariadne Genomics

41
THE END

42
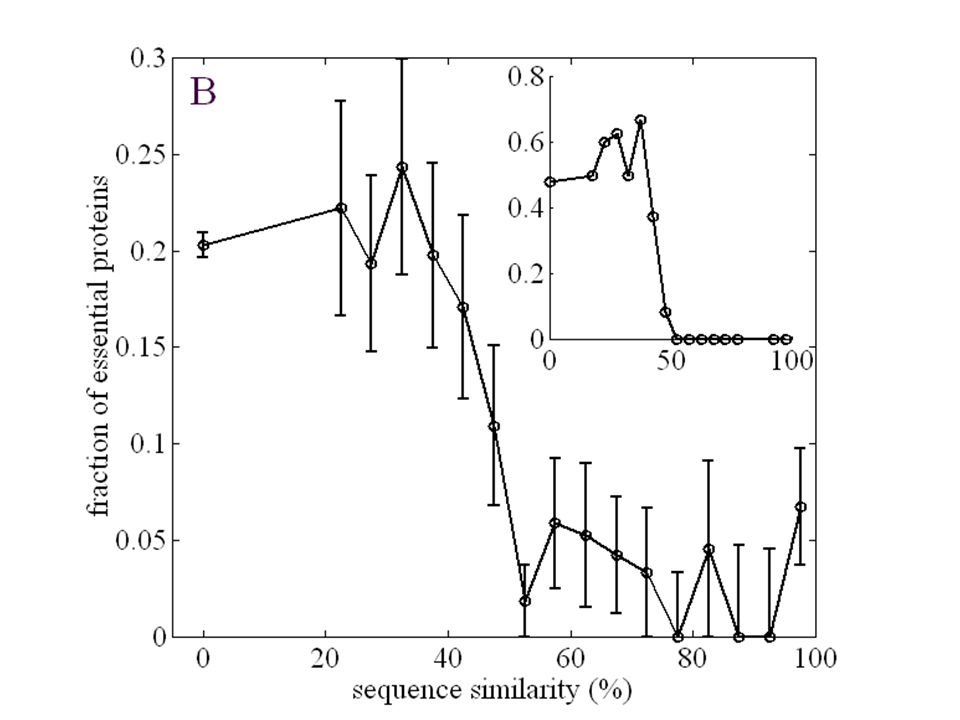
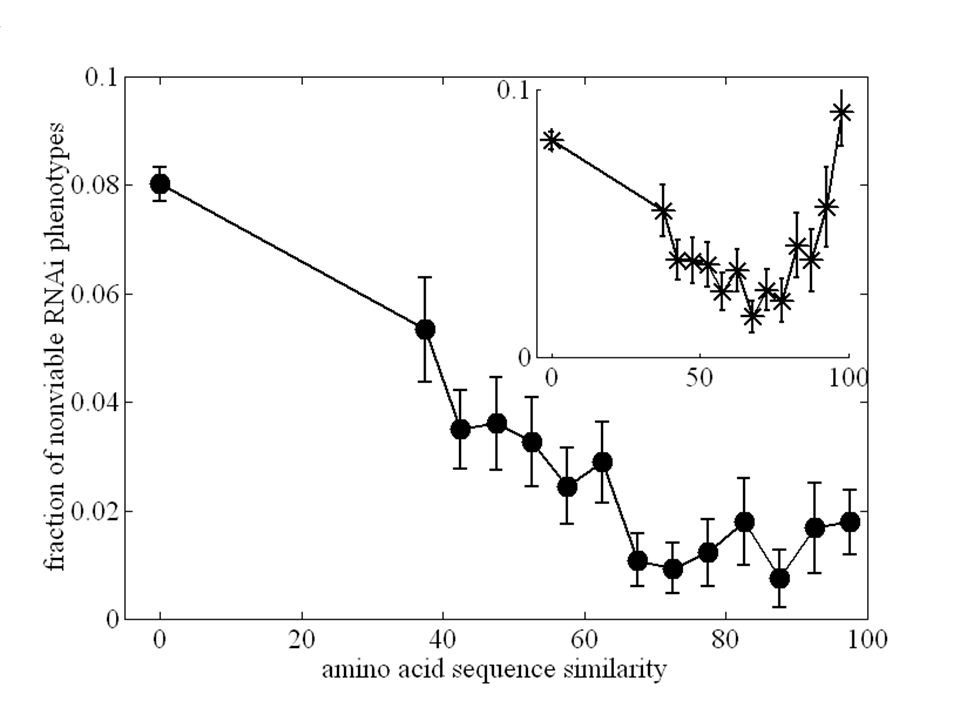
Protective effect of duplicates Gu, et al 2003 Maslov, Sneppen, Eriksen, Yan 2003 YeastWorm Maslov, Sneppen, Eriksen, Yan 2003

46
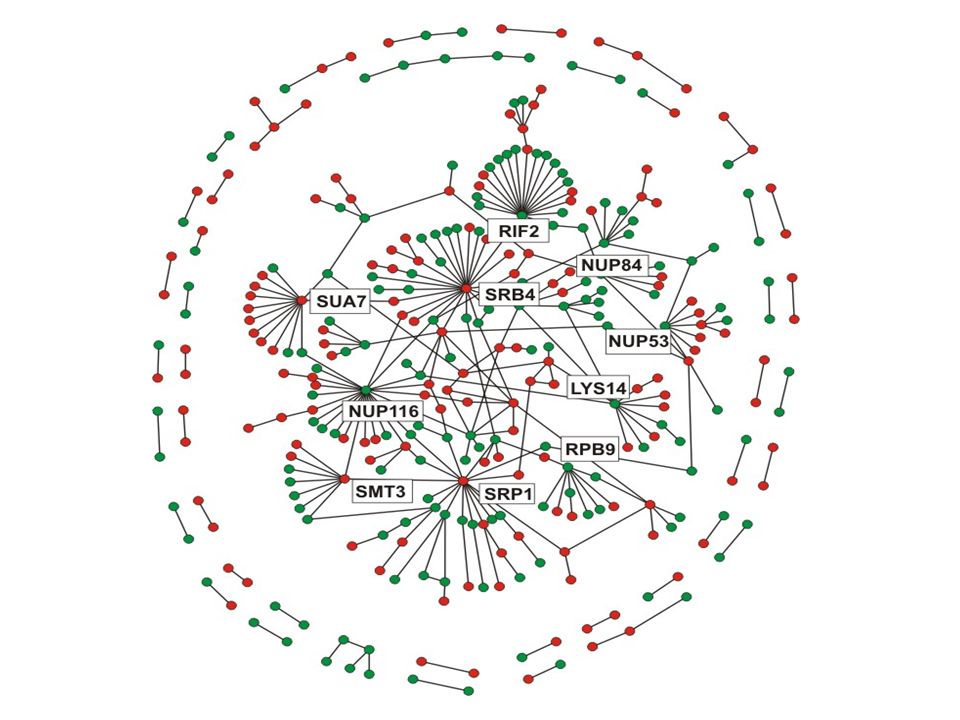
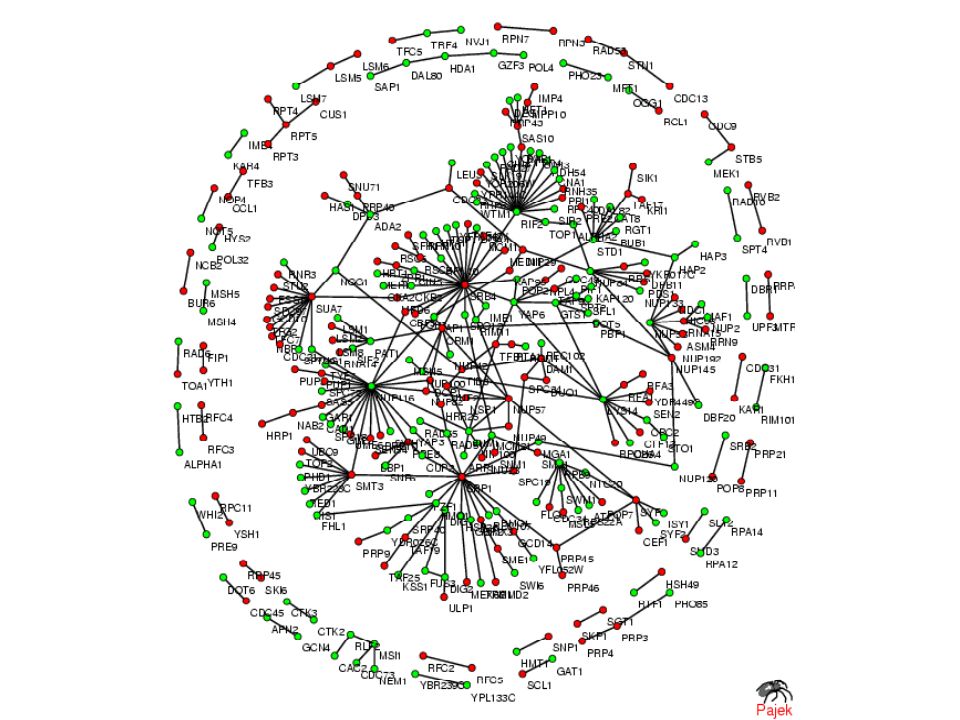
Protein interaction networks SM, K. Sneppen, K. Eriksen, K-K. Yan 2003

47
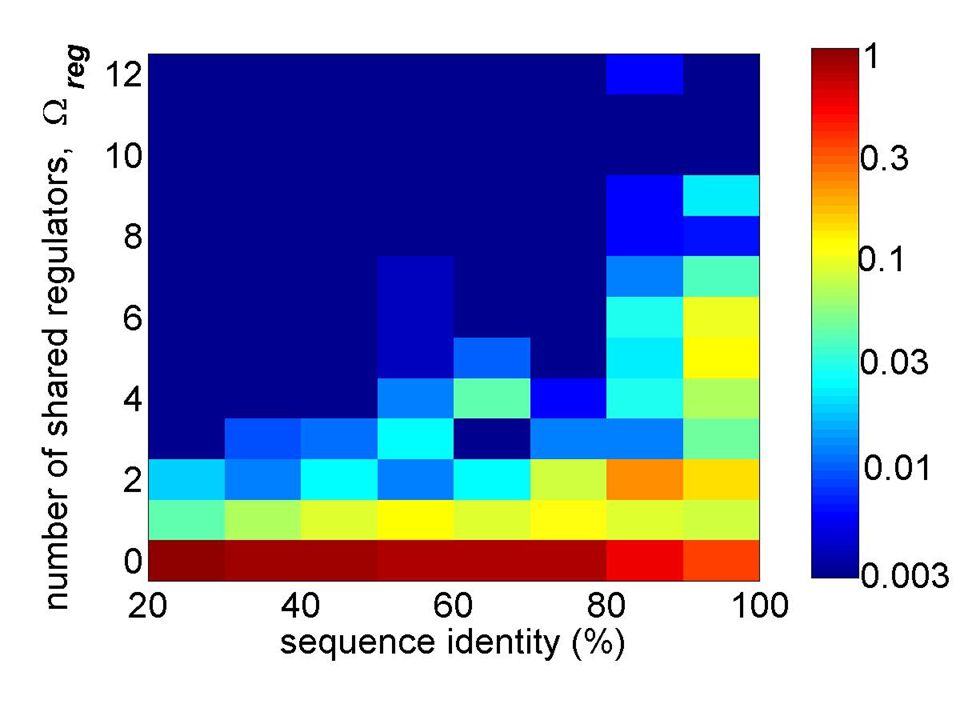
What shapes the topology of protein networks? Duplication-divergence models CAN account for their basic topological features BUT: functional organization dominates: Most pairs with many shared interactions are NOT homologs Hubs are not caused by mult. duplications Functional organization is more important than duplication-divergence

48
Genome-wide protein networks Nodes - proteins Edges – interactions between proteins Bindings (physical interactions) Regulations (transcriptional, protein modifications, etc.) Etc, etc, etc.
 Regulations (transcriptional, protein modifications, etc.) Etc, etc, etc.")
49
Correlation profile of the yeast regulatory network R(k out, k in )=N(k out, k in )/N r (k out,k in )Z(k out,k in )=(N(k out,k in )-N r (k out,k in ))/ N r (k out,k in )
=N(k out, k in )/N r (k out,k in )Z(k out,k in )=(N(k out,k in )-N r (k out,k in ))/ N r (k out,k in )")
50
YPD full regulatory network O <-2 standard deviations O > 2 standard deviations

51
Regulators: Workhorse:

52
Amplification ratios A (dir) : 1.08 - E. Coli, 0.58 - Yeast A (undir) : 10.5 - E. Coli, 13.4 – Yeast A (PPI) : ? - E. Coli, 26.3 - Yeast
 : . - E. Coli, Yeast.")
53
Two-hybrid experiment To test if A interacts with B create two hybrids A* (with Gal4p DNA-binding domain) and B* (with Gal4p activation domain) High-throughput: all pairs among 6300 yeast proteins are tested: Uetz, et al. Nature (2000), Ito, et al., PNAS (2001). Gal4-activated reporter gene, say GAL2::ADE2Gal4-binding domain A*B*
, Ito, et al., PNAS (2001). Gal4-activated reporter gene, say GAL2::ADE2Gal4-binding domain A*B*.")
56
DIP core correlation profile

59
Protein binding networks Two-hybrid nuclearDatabase (DIP) core set S. cerevisiae
 core set S. cerevisiae")
60
SM, K. Sneppen, K. Eriksen, K-K. Yan 2003

61
Pathway vs. network paradigm Pathway Network

62
How to deal with feedback loops?

63
Propagation of signals often involves feedback loops Feedback could be used as a checkpoint that the signal reached its destination: The main direction of information flow A B C “Weak” feedback signal C A Some closed loops like A B C A are not used to send feedback but to regulate periodic processes: Cell cycle Circadian rhythms

64
Finding the feedback links Feedback links go against the main direction of the information flow Feedback edge

65
Algorithm Goal: remove the smallest number of edges to make the network feedback-free Solution: Randomly assign hierarchy weights H i to all nodes. Links i j such that H i <H j are candidate feedback links Try to switch H m and H n on randomly selected nodes m,n. Accept if this switch reduces the number of feedback links. If increases – accept with a small probability (a la Metropolis) The final network obtained by removing feedback links is feedback-free
 The final network obtained by removing feedback links is feedback-free.")
66
Bow-tie diagram SCC: 93 nodes In: 96 nodes wormholes dangling ends and isolated components Out: 553 nodes Human protein modification network: 1100 nodes

67
Feedback loops in human protein-modification network Removal of only 48 out of 2200 edges makes human protein modification network feedback- free Most links are “reproducible”: rerunning experiment gives almost the same answer Run algorithm 10 times. Each time record all upstream-downstream relations. Look for reproducible relationships: the correspond to main direction of the information flow

69
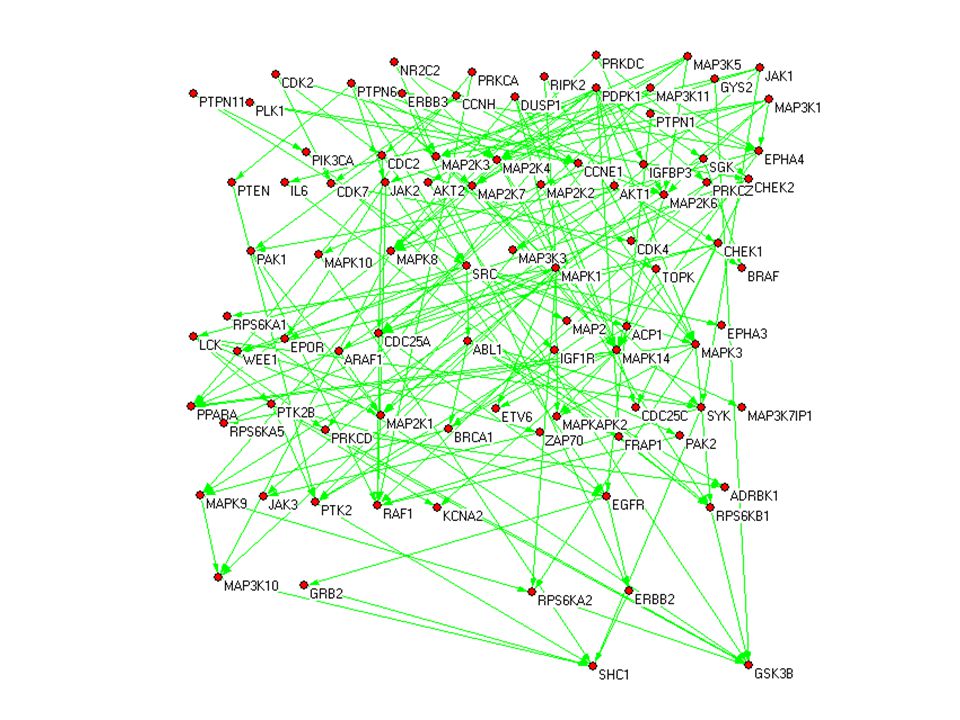
MAPK signalingInhibition of apoptosis

70
Gene disruptions in yeast

71
Repercussions of gene deletions Number of proteins affected by a single gene deletion Total number of proteins in yeast genome

72
Data from Ariadne Genomics Homo sapiens Total: 120,000 interacting protein pairs extracted from PubMed as of 8/2004

Similar presentations


; Chazelle (2005) Sedgewick & Wayne (2004); Chazelle (2005)>")

