Download presentation
Presentation is loading. Please wait.

1
Potential for integrated use of GIS-Agriculture Models Jagadeesh Mosali 4/25/2001

2
What is a GIS? A Geographic Information System (GIS) consists of data and software designed for spatial analysis. In the case of precision agriculture, the farm GIS software has tools designed to allow the display of crop yield data and factors which may affect crop yield. These factors include soil fertility data, soil types, insect infestations,weed locations, rainfall distribution, and the terrain elevation. In addition, the GIS tools allow planning for actions required to eliminate factors that may limit yield or waste agricultural chemicals by preventing application where the chemicals are not needed.
 consists of data and software designed for spatial analysis. In the case of precision agriculture, the farm GIS software has tools designed to allow the display of crop yield data and factors which may affect crop yield. These factors include soil fertility data, soil types, insect infestations,weed locations, rainfall distribution, and the terrain elevation. In addition, the GIS tools allow planning for actions required to eliminate factors that may limit yield or waste agricultural chemicals by preventing application where the chemicals are not needed..")
3
Why GPS ? Trying to figure out where you are and where you're going is probably one of man's oldest pastimes. Navigation and positioning are crucial to so many activities and yet the process has always been quite cumbersome

4
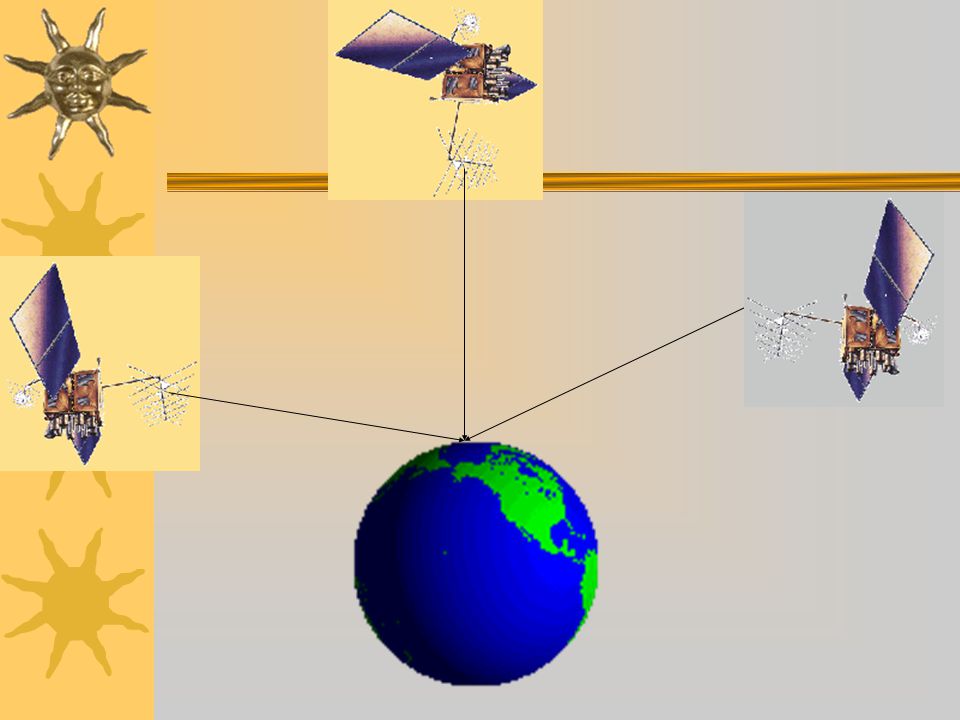
What is GPS ? The Global Positioning System (GPS) is a worldwide radio-navigation system formed from a constellation of 24 satellites and their ground stations. GPS uses these "man-made stars" as reference points to calculate positions accurate to a matter of meters. In fact, with advanced forms of GPS you can make measurements to better than a centimeter!
 is a worldwide radio-navigation system formed from a constellation of 24 satellites and their ground stations. GPS uses these man-made stars as reference points to calculate positions accurate to a matter of meters. In fact, with advanced forms of GPS you can make measurements to better than a centimeter!.")
5
Disadvantages of other navigation systems Landmarks:Only work in local area. Subject to movement or destruction by environmental factors. Dead Reckoning:Very complicated. Accuracy depends on measurement tools which are usually relatively crude. Errors accumulate quickly. Celestial:Complicated. Only works at night in good weather. Limited precision. OMEGA:Based on relatively few radio direction beacons. Accuracy limited and subject to radio interference. LORAN:Limited coverage (mostly coastal). Accuracy variable, affected by geographic situation. Easy to jam or disturb. SatNav:Based on low-frequency doppler measurements so it's sensitive to small movements at receiver. Few satellites so updates are infrequent.
. Accuracy variable, affected by geographic situation. Easy to jam or disturb. SatNav:Based on low-frequency doppler measurements so it s sensitive to small movements at receiver. Few satellites so updates are infrequent..")
6
GPS Satellites Manufacturer: Rockwell International Name: NAVSTAR Altitude: 10,900 nautical miles Weight:1900 lbs (in orbit)Size:17 ft with solar panels extended Orbital Period: 12 hours Orbital Plane: 55 degrees to equitorial plane Planned Lifespan: 7.5 years Current constellation: 24 Block II production satellites Future satellites: 21 Block IIrs developed by Martin Marietta.
Size:17 ft with solar panels extended Orbital Period: 12 hours Orbital Plane: 55 degrees to equitorial plane Planned Lifespan: 7.5 years Current constellation: 24 Block II production satellites Future satellites: 21 Block IIrs developed by Martin Marietta.")
7
Here's how GPS works in five logical steps: 1. The basis of GPS is "triangulation" from satellites. 2. To "triangulate," a GPS receiver measures distance using the travel time of radio signals. 3. To measure travel time, GPS needs very accurate timing which it achieves with some tricks. 4. Along with distance, you need to know exactly where the satellites are in space. High orbits and careful monitoring are the secret. 5. Finally you must correct for any delays the signal experiences as it travels through the atmosphere.

9
Free Software ArcExplorer—A free data viewer from ESRI that performs some basic GIS functions. You can use your own data with ArcExplorer or browse data over the Web. ArcExplorer dlgv32 Software for Viewing USGS Data—Used for viewing USGS Digital Line Graph Optional (DLG-O), Digital Raster Graphic (DRG), and Spatial Data Transfer Standard (SDTS) data, all of which are commonly found on the Web. dlgv32 Software for Viewing USGS Data
, Digital Raster Graphic (DRG), and Spatial Data Transfer Standard (SDTS) data, all of which are commonly found on the Web. dlgv32 Software for Viewing USGS Data.")
12
Agricultural Trends on a Global Scale

13
Missouri State Soil Map

14
This map ranks the vulnerability of groundwater in Indiana to pesticide contamination. Green is low risk, pale yellow is slight risk, orange is medium risk, and red is high risk. Map courtesy of Purdue University, West Lafayette, Indiana.

17
New Pararell Tracking

18
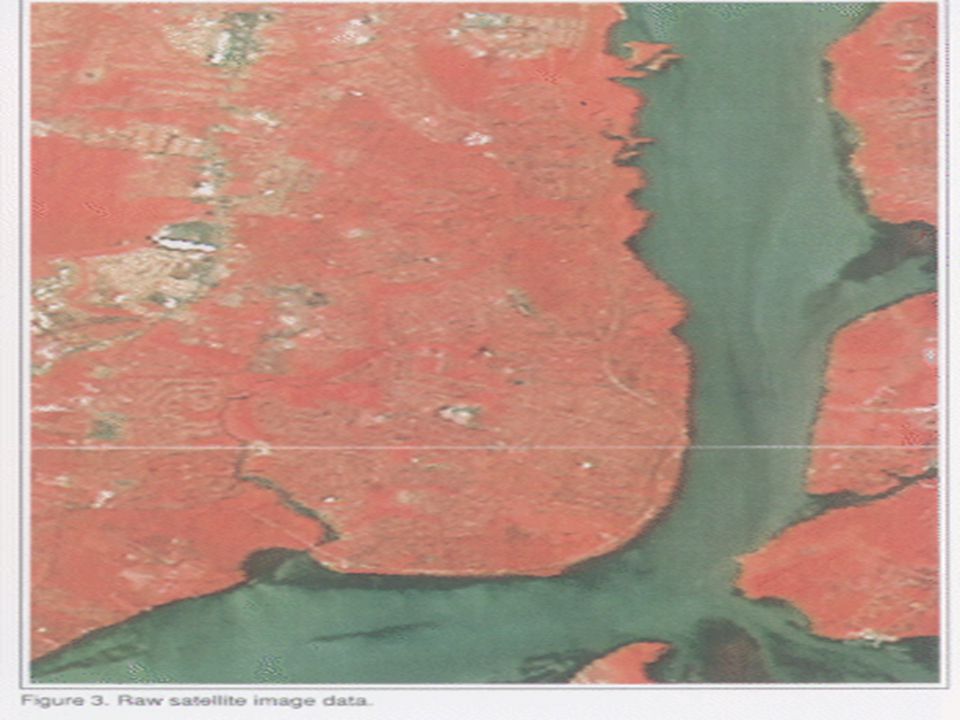
Yield monitoring and mapping

19
Technical issues

20
TEAM VRT- II http://www.dasnr.okstate.edu/nitrogen_use/ http://www.dasnr.okstate.edu/nitrogen_use/

21
Conclusions : By means of use of GIS in agriculture models we can know the areas which are troublesome. GIS technology is so wonderful because it is very visual and that visualization allows us to build a mental model of what is actually going on in the field.

22
References : http://www.trimble.com/gps/diffgps/gpsfra m1.htm http://www.trimble.com/gps/diffgps/gpsfra m1.htm http://www.deere.com/deerecom/ http://www.deere.com/deerecom/ http://www.geoplace.com/ge/2000/0800/08 00pa.asp http://www.geoplace.com/ge/2000/0800/08 00pa.asp

23
Questions/ Comments

Similar presentations


 for Precision Farming>")


. NAVSTAR Global Positioning System (GPS) Globally.>")

>")


