Download presentation
Presentation is loading. Please wait.

1
Occupational Cancer Epidemiology Mark Goldberg Dept. Of Medicine McGill University

2
Goal To identify chemical & physical agents in the workplace that cause cancer in humans.

3
Difficulty How does one decide whether exposure to some agent is a cause of cancer in humans?

4
Issues Latency: solid tumours take ~10-20 years to develop Multifactorial: >1 exposures can cause cancer (interactions) Timing of exposures: multistage and two-stage models; can be very complicated
 Timing of exposures: multistage and two-stage models; can be very complicated")
5
Issues (continued) Hereditary: non-sporadic cancers; functional genetic polymorphisms Cellular mechanisms: host factors and their interaction with exogenous factors likely to be important Measurement of exposure: difficult to characterize and quantify
 Hereditary: non-sporadic cancers; functional genetic polymorphisms Cellular mechanisms: host factors and their interaction with exogenous factors likely to be important Measurement of exposure: difficult to characterize and quantify")
6
Available Data Occupational exposures Cohort Case-control Cross-sectional Ecologic Environmental exposures Similar designs as in occupational studies Toxicological data Other experimental data

7
Example – Case-Control Studies Case-control study of occupational risk factors for cancer on men (Siemiatycki, “Risk factors for cancer in the workplace”, CRC Press, 1991) 1909 195019791985 Subjects Time Case Control Birth years Case ident. Montreal aged 35-70

8
Characteristics of the study design, age 35-70, living in Montreal between 1979 & 1985 ~20 sites of cancer, confirmed histologically Small (~350) population-based series of control subjects
 population-based series of control subjects ")
9
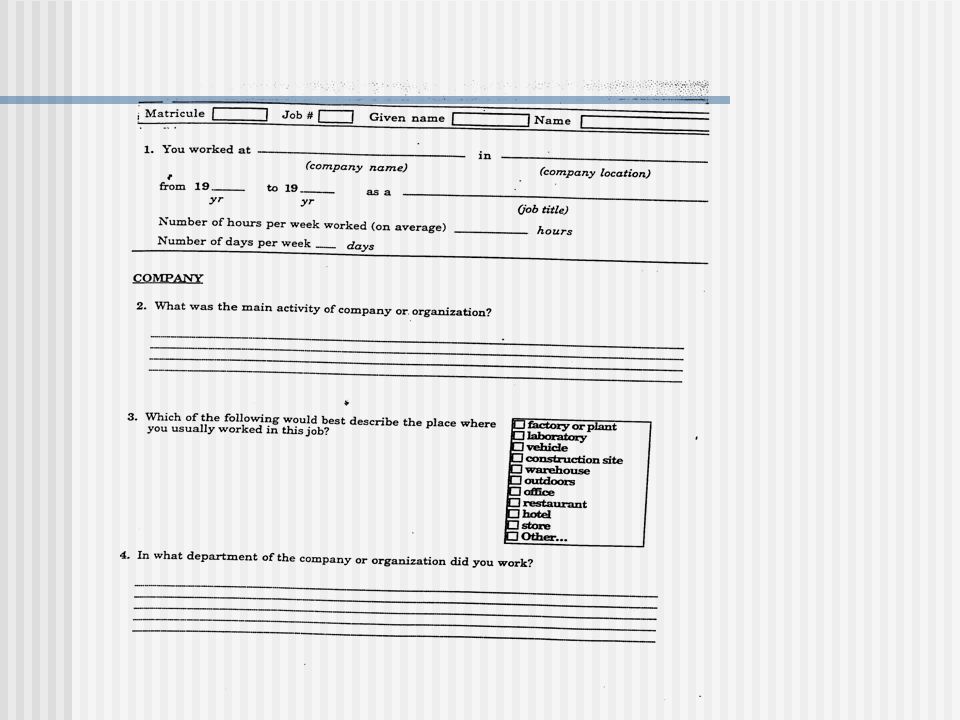
Interviewer-administered questionnaire for non-occupational risk factors and lifetime occupational histories

10
Measurement "Not everything that counts can be counted [well], and not everything that can be counted counts." (Sign hanging in Albert Einstein’s office)
![Measurement Not everything that counts can be counted [well], and not everything that can be counted counts. (Sign hanging in Albert Einstein’s office)](http://images.slideplayer.com/15/4787747/slides/slide_10.jpg "Measurement Not everything that counts can be counted [well], and not everything that can be counted counts. (Sign hanging in Albert Einstein’s office)")
11
Occupational questionnaire General questionnaire about each job each subject ever had Supplemented with specific questionnaires for selected jobs (e.g. welders)
.")
18
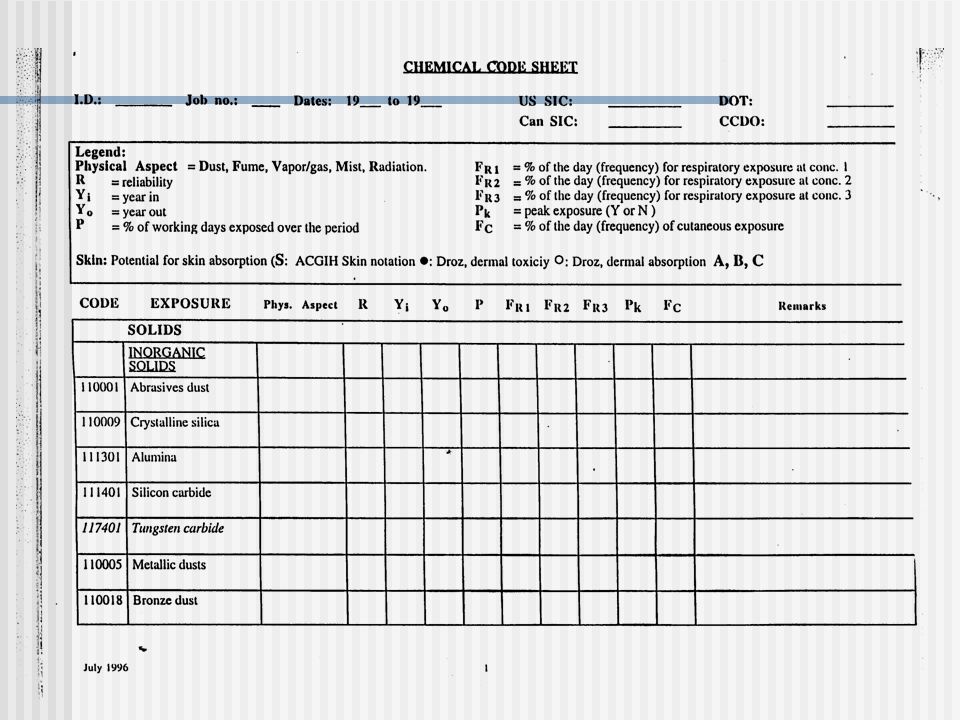
Occupational Coding Team of chemists & industrial hygienists reviewed each job history & attributed exposure to ~300 agents

19
Coded: Lifetime occupations (as coded by job and industry titles) Lifetime exposure to ~300 agents in the workplace
 Lifetime exposure to ~300 agents in the workplace")
20
Exposure variables Start/end dates of job; duration Concentration, coded on a 4-level ordinal scale None Low- Background exposure Medium- In between High- Handling product in concentrated form

21
Frequency, coded on 4-level interval scale None Low- 1-5% Medium- 5-30% High- >30%

22
Route of exposure, nominal Respiratory Cutaneous Both Confidence of exposure, ordinal “Possible” “Probable” “Certain”

24
Statistical Analysis Logistic regression (unconditional) using selected sites of cancer & population controls as reference Adjusted for measured risk factors
 using selected sites of cancer & population controls as reference Adjusted for measured risk factors")
25
Exposure indices Duration at medium/high concentrations Cumulative = “Substantial 1 ” - conc medium (2) freq high (3) “ Substantial 2 ” - conc * freq > 3 duration > 5 y prior to 5 years before dx Coding: conc= {0,…,3} freq= {0,…,3}
 freq high (3) Substantial 2 - conc * freq > 3 duration > 5 y prior to 5 years before dx Coding: conc= {0,…,3} freq= {0,…,3}")
26
Selected Results SiteAgentOR (subst 2 ) 90% CI LungCrysotile ashestod1.91.1-3.2 Crystaline silica1.41.0-1.8 Wood dust1.31.0-1.7 RectumRayon fibres3.51.6-7.8 StomachCo2.41.6-3.7 RectumSynthetic fibres2.51.1-5.7
 90% CI LungCrysotile ashestod Crystaline silica Wood dust RectumRayon fibres StomachCo RectumSynthetic fibres")
27
Limitations — Low prevalence of exposure — Control subjects — Confounders Strengths — Population-based — Relatively large case series — Histological confirmation — Control subjects — Lifetime exposure data — Confounders Aspects of the design

28
Example: Postmenopausal Breast Cancer and Occupational Exposures to Extremely Low Frequency Magnetic Fields

29
Relative Risks for Exposure to Magnetic Fields

30
Duration of Exposure (per 1 Year Increase)
")
31
Continuous Indices of Exposure

32
Dose-response for Lifetime Duration of Occupational Exposures to Magnetic Fields, at any Intensity

33
Dose-response for Cumulative Occupational Exposure to Magnetic Fields

34
Lag 0 Tmax O3+NO2 Warm season Men and Women

35
Example – Cohort Studies Cohort study of synthetic textiles workers (Goldberg & Thériault, Am J Indust Med 1994; 25: 889-922) 194719771986 Subjects Time Prevalent Cohort Inception Cohort End of follow-up In take
 Subjects Time Prevalent Cohort Inception Cohort End of follow-up In take")
36
1 yr service at plant 7422 2720 15 different “exposure areas” Cellulose acetate 1927- Cellulose triacetate1957-78 Polypropylene1959-70 Textiles & weaving1927- Dyeing & finishing1927- Power plant/maintenance1927- [217,000 person-years] [89,000 p-y]
![ 1 yr service at plant different exposure areas Cellulose acetate Cellulose triacetate Polypropylene Textiles & weaving1927- Dyeing & finishing1927- Power plant/maintenance1927- [217,000 person-years] [89,000 p-y]](http://images.slideplayer.com/15/4787747/slides/slide_36.jpg " 1 yr service at plant different exposure areas Cellulose acetate Cellulose triacetate Polypropylene Textiles & weaving1927- Dyeing & finishing1927- Power plant/maintenance1927- [217,000 person-years] [89,000 p-y]")
37
Tracing & ascertainment of vital status Statistics Canada’s Mortality Data Base ~98% identifying correctly vital status [Goldberg et al., Can J Pub Health 1993; 84:201-4.] : 1663 deaths [22.4%] : 238 deaths [8.8%]
![Tracing & ascertainment of vital status Statistics Canada’s Mortality Data Base ~98% identifying correctly vital status [Goldberg et al., Can J Pub Health 1993; 84:201-4.] : 1663 deaths [22.4%] : 238 deaths [8.8%] ](http://images.slideplayer.com/15/4787747/slides/slide_37.jpg "Tracing & ascertainment of vital status Statistics Canada’s Mortality Data Base ~98% identifying correctly vital status [Goldberg et al., Can J Pub Health 1993; 84:201-4.] : 1663 deaths [22.4%] : 238 deaths [8.8%] ")
38
Analysis Cause-specific SMRs by province, “non- urban” Quebec, Eastern Townships Analysis by “occupational unit”, by duration of employment Case control analysis by extent & duration of exposure to ~150 occupational agents

39
SMRs for selected causes of death, 1947-86 Cause Number of deathsSMR & 95% CI MEN All causes16630.71 0.68-0.74 All neoplasms4140.73 0.66-0.80 Colorectal cancer490.68 0.51-0.91 WOMEN All causes2380.75 0.66-0.85 All neoplasms1070.97 0.80-1.17 Colorectal cancer140.95 0.52-1.59

40
SMRs for colorectal cancer among men according to length of service at the plant Length of service No. of deaths SMRRR95% CI 1-450.321 5-9100.822.550.79-9.55 10-1990.551.720.52-6.58 20+250.902.811.06-9.45 Total490.68 Chi-square for test for linear trend: 3.64 (p=0.06)
.")
41
Results of case-control analyses for colorectal cancer among men POLYPROPYLENE and CELLULOSE TRIACETATE EXTRUSION UNIT Duration ofNumber of exposedUnadjusted employmentcases ctrlsOR 95% 052 742 1 >0-4 1 111.55 0.19-12.8 5+ 2 53.55 0.49-25.6 Total 55758

42
Results of case-control analyses for colorectal cancer and occupational agents Number of exposedUnadjusted ExposureCasesCtrlsOR95%CI Pyrolysis fumes from cellulose triacetate/polypropylene8731.050.98-1.14 Cellulose acetate dust6573.540.77-16.3

43
Contrasting Cohort & C-C Studies CohortC-C End point: Mortality Incidence <><> > Covariates: Age, sex calendar yr. > Exposure: Duration Accuracy Only in target cohort > Lifetime < Reference group:Gen. popn.; within cohort Population-based; hospital-based; etc

44
CohortC-C Analysis: SMR; Poisson Cox; c-c-w-cohort M-H; logistic Sources for bias & msmt. error Endpoints Selection Response Confounding Exposure < Entry, exit [HWE] > > popn response Hosp ? < (recall bias)
.")
45
Causality

46
Philosophies Causes are not observable directly, but can only be inferred through the observed statistical associations Deductive reasoning (Popper): an hypothesis remains that until refuted Inductive reasoning: weight of the evidence suggests that the exposure is a cause Prediction: lack of prediction is one of the strongest tests in all of the sciences (including physics)
: an hypothesis remains that until refuted Inductive reasoning: weight of the evidence suggests that the exposure is a cause Prediction: lack of prediction is one of the strongest tests in all of the sciences (including physics)")
47
Guidelines for Judging Causality (Bradford–Hill) Temporality Event occurs after cause Strength of Association No confounding principle Consistency Are results “similar” across studies Exposure-response Does the response (e.g., RR) reflect a plausible relationship with exposure
 Temporality Event occurs after cause Strength of Association No confounding principle Consistency Are results similar across studies Exposure-response Does the response (e.g., RR) reflect a plausible relationship with exposure")
48
Judging Causality (continued) Experimental evidence Specificity Plausibility Coherence – consistent with what is known about the biology/natural history Rarely available Beware! Can be misleading

49
Some “accepted” carcinogens Ionizing radiation Asbestos Radium Vinyl chloride monomer Benzidine dyes Coal tar pitch volatiles Arsenic

50
Making Decisions About Causal Associations The example of vinyl chloride monomer as a human carcinogen

51
SMRs for liver and biliary cancers for workers exposed to vinyl chloride monomer Risks decrease as studies get “better” and larger

52
Number of observed deaths in five cohorts of workers exposed to vinyl chloride monomer ReferenceType of cancer No. of observed deaths Confirmed angiosarcomas Thériault et Allard, 1981 Thériault, 1982 Liver8NM 1 Weber et al., 1981Liver124 Nakamura, 1983Liver61 EHA, 1986 Liver and gallbladder 3715 Simonato et al., 1991Liver2422 Total8742 1 NM, Not mentioned

53
Exposure-response relationships for liver cancer in various occupational mortality studies of vinyl chloride monomer

54
NRC Committee on Human Health Effects of Trichloroethylene (Assessing the Human Health Risks of Trichloroethylene, NRC, 2006)
")
55
Background TCE is a chlorinated solvent Uses: degreasing agent, dry cleaning Constituent: paint removers, adhesives; spot removers Common environmental contaminant Superfund sites DOE, DOD sites ~42x10 6 pounds released to environment in 1994

56
Acute Health Effects CNS depression Cardiac arrhythmias, liver damage ~10,000 ppm death Symptoms: Similar to alcohol, intoxication Headache, dizziness, sleepiness, feelings of euphoria, confusion

57
Metabolized to toxic substances: chloral hydrate trichloroacetic acid dichloroacetic acid trichloroethanol Probable human carcinogen: EPA, Group B2/C IARC Group 2A (probably carcinogenic to humans) Sufficient evidence in experimental animals
 Sufficient evidence in experimental animals")
58
Camp Lejeune Leaking underground storage tanks Spills and drum disposal caused contamination Contamination from solvent-disposal practices at a dry cleaners ATSDR: studies of children born 1968-85 to mothers exposed to VOC-contaminated drinking water

59
Selected Results of Cohort Studies Scandinavian biomonitoring Small mfg. Cardboard Aircraft. Aerospace Maint.

60
Selected Results of Case-Control Studies

61
Brauch Study of von Hippel-Lindau Tumor Suppressor Gene Based on Vamvakas et al. (1998) ExposedUnexposed Mutation152 No mutation219 Total1721 OR=71.3 Sensitivity analyses including all cases, assuming no mutation in the 20 cases not analysed OR=6.5
 ExposedUnexposed Mutation152 No mutation219 Total1721 OR=71.3 Sensitivity analyses including all cases, assuming no mutation in the 20 cases not analysed OR=6.5.")
62
International Agency for Research on Cancer (IARC) IARC working group of experts declared that vinyl chloride monomer is a Class 1 human carcinogen This decision process was based on a “weight-of-the- evidence” approach (inductive reasoning) It uses human and experimental data The conclusion was a consensus decision
 IARC working group of experts declared that vinyl chloride monomer is a Class 1 human carcinogen This decision process was based on a weight-of-the- evidence approach (inductive reasoning) It uses human and experimental data The conclusion was a consensus decision")
63
IARC Classification System for Carcinogens (Monograph Series) 1 Sufficient evidence in humans 2 Limited A. Probably carcinogenic B Possibly carcinogenic (animal studies) 3 Insufficient evidence 4Lack of carcinogenicity
 3 Insufficient evidence 4Lack of carcinogenicity.")
64
Other Processes Consensus conferences (NIH) Governmental law/decree
 Governmental law/decree")
65
US Institute of Medicine National Academies Gulf War Committees Assessing Evidence of Associations for Exposures to Organic Solvents and Insecticides and Various Helath Endpoints, Including Cancer

66
CATEGORIES OF ASSOCIATION Sufficient Evidence of a Causal Relationship Evidence from available studies is sufficient to conclude that a causal relationship exists between exposure to a specific agent and a specific health outcome in humans, and the evidence is supported by experimental data. The evidence fulfills the guidelines for sufficient evidence of an association (below) and satisfies several of the guidelines used to assess causality: strength of association, dose–response relationship, consistency of association, and a temporal relationship.
 and satisfies several of the guidelines used to assess causality: strength of association, dose–response relationship, consistency of association, and a temporal relationship..")
67
Sufficient Evidence of an Association Evidence from available studies is sufficient to conclude that there is a positive association. A consistent positive association has been observed between exposure to a specific agent and a specific health outcome in human studies in which chance[1] and bias, including confounding, could be ruled out with reasonable confidence. For example, several high-quality studies report consistent positive associations, and the studies are sufficiently free of bias, including adequate control for confounding.[1] [1]Chance refers to sampling variability. [1]

68
Limited/Suggestive Evidence of an Association Evidence from available studies suggests an association between exposure to a specific agent and a specific health outcome in human studies, but the body of evidence is limited by the inability to rule out chance and bias, including confounding, with confidence. For example, at least one high-quality[1] study reports a positive association that is sufficiently free of bias, including adequate control for confounding. Other corroborating studies provide support for the association, but they were not sufficiently free of bias, including confounding. Alternatively, several studies of less quality show consistent positive associations, and the results are probably not[2] due to bias, including confounding.[1][2]

69
[1]Factors used to characterize high quality studies include, the statistical stability of the associations, whether a dose– response or other trends were demonstrated, whether the association was among numerous comparisons that were made, and the quality of the assessments of exposure and outcome. Specifically, the quality of exposure assessment refers to specificity and sensitivity in relation to the association of interest. For instance, for insecticides, studies assessing specific insecticides (such as chlorpyrifos) have more specificity than those assessing classes of insecticides (such as organophosphorous) which in turn are more specific than those assessing pesticides more generally. With respect to sensitivity, studies are judged by the instruments used to measure exposure. Biologic monitoring data are theoretically the most preferable but are almost never obtainable in the context of a nonpersistent chemical and a disease with long latency, like cancer. Other kinds of efforts can obtain sensitive measures of exposure, such as use of occupational or environmental monitoring data, use of more extensive industrial hygiene assessments, use of interview techniques that help to minimize recall bias (for example, photos of products, and home and workplace walkthroughs). Similarly, there are questions about quality of outcome assessment–whether an outcome has been verified by a medical diagnosis in a consistent fashion. [1] [2]Factors used to make this judgment include the data on the relationship between potential confounders and related health end points in a given study, information on subject selection, and classification of exposure. [2]
![[1]Factors used to characterize high quality studies include, the statistical stability of the associations, whether a dose– response or other trends were demonstrated, whether the association was among numerous comparisons that were made, and the quality of the assessments of exposure and outcome.](http://images.slideplayer.com/15/4787747/slides/slide_69.jpg "Specifically, the quality of exposure assessment refers to specificity and sensitivity in relation to the association of interest. For instance, for insecticides, studies assessing specific insecticides (such as chlorpyrifos) have more specificity than those assessing classes of insecticides (such as organophosphorous) which in turn are more specific than those assessing pesticides more generally. With respect to sensitivity, studies are judged by the instruments used to measure exposure. Biologic monitoring data are theoretically the most preferable but are almost never obtainable in the context of a nonpersistent chemical and a disease with long latency, like cancer. Other kinds of efforts can obtain sensitive measures of exposure, such as use of occupational or environmental monitoring data, use of more extensive industrial hygiene assessments, use of interview techniques that help to minimize recall bias (for example, photos of products, and home and workplace walkthroughs). Similarly, there are questions about quality of outcome assessment–whether an outcome has been verified by a medical diagnosis in a consistent fashion. [1] [2]Factors used to make this judgment include the data on the relationship between potential confounders and related health end points in a given study, information on subject selection, and classification of exposure. [2].")
70
Inadequate/Insufficient Evidence to Determine Whether an Association Exists Evidence from available studies is of insufficient quantity, quality, or consistency to permit a conclusion regarding the existence of an association between exposure to a specific agent and a specific health outcome in humans. Limited/Suggestive Evidence of No Association Evidence from available studies is consistent in not showing a positive association between exposure to a specific agent and a specific health outcome after exposure of any magnitude. A conclusion of no association is inevitably limited to the conditions, magnitudes of exposure, and length of observation in the available studies. The possibility of a very small increase in risk after exposure studied cannot be excluded.

71
Resources

72
Sources for carcinogencity information International Agency for Research on Cancer (IARC) U.S. National Toxicology Program U.S. Environmental Protection Agency NIOSH

73
Web sites EPA server: listserver@unixmail.rtpnc.epa.gov Health Canada:www.hc-sc.ca U.S. NCI:www.nci.nih.gov U.S. NIEHS:www.niehs.nih.gov WHO:www.who.org IARC:www.iarc.fr CDC:www.cdc.gov

74
U.S. NTP ntp-server.niehs.nih.gov Annual Report on Carcinogens U.S. EPA www.epa.gov/ngispgm3/iris/index.html IRIS – Integrated Risk Information System NIOSH “Pocket Guide to Chemical Hazards” www.cdc.gov/niosh/homepage.html “Current Intelligence Bulletins” And other databases

75
Exposure Limit Values TLV – ACGIH (www.acgih.org) Quebec: Gazette, No 50, 1 Dec 1993, Part 2

76
Where to get this lecture http://www.epi.mcgill.ca Under Faculty Under Courses Occupational Cancer Lecture

Similar presentations


. What is a cohort?>")
, and the other of people with the same general characteristics.>")


. MEASURES OF DISEASE FREQUENCY Absolute measures of disease frequency: –Incidence –Prevalence –Odds Measures of association:>")
 ASSISTANT PROFESSOR>")
