Download presentation
Presentation is loading. Please wait.

1
Green Motor Rewinds UES Measure Update Industrial & Agricultural Motors April 16, 2013

2
Reason for bringing back to RTF RTF voted to adopt updated measure savings in December, 2012 Informed that one recommendation from October, 2012 review was not incorporated – The UES assumes NEMA premium efficiency for the measure motor efficiency, however an average efficiency rating consistent with motors processed through the program should be determined and used instead. RTF voted to review data on efficiency weights

3
Savings Estimation Equation Where: UES - Unit Energy Savings is the annual energy savings of the motor in kWh by retaining original efficiency utilizing rewind process control HP - Horsepower obtained from standardized horsepower ratings 0.746 – Converts horsepower to kilowatts OP - Operating hours is the annual operating hours of the motor ML - Motor loading is the percentage of the standardized horsepower rating required to drive equipment Baseline Eff. – Nameplate motor nominal efficiency without process control (i.e. range of 0.5% - 1% less than Efficient Case) Efficient Case Eff. – Nameplate motor nominal efficiency with process control HP x 0.746 x OP x ML Unit Energy Savings (kWh/yr) Baseline Eff.Efficient Case Eff. =
 Efficient Case Eff. – Nameplate motor nominal efficiency with process control HP x x OP x ML Unit Energy Savings (kWh/yr) Baseline Eff.Efficient Case Eff. =.")
4
Changes made to Workbook Open Workbook – Clarified analysis method on Summary Tab – Corrected source documentation for efficient case – Incorporated GMPG data tables for efficiency values at each HP – Added references to for Pre-EPAct, EPAct and NEMA Premium efficiency tables – Removed analysis for motor sizes <15 HP as GMPG does not offer these

5
Methodology Current Methodology: – Use NEMA Premium as the Efficient Case motor efficiency (i.e. all motors entering GMPG are NEMA premium efficiency) – Conservative estimate from initial measure development in 2007 Proposed Methodology: – Develop estimate of Efficient Case motor efficiency weightings for each HP size based on count of motors entering program
 – Conservative estimate from initial measure development in 2007 Proposed Methodology: – Develop estimate of Efficient Case motor efficiency weightings for each HP size based on count of motors entering program.")
6
Proposed Method Data Sources GMPG efficiency data collected from historical program participation by motor size – N=2337 motors from program years 2008-2012 Pre-EPAct motor efficiency – MotorMaster database – Conversation with Gil McCoy at WSU indicated efficiencies for pre-1989 motors were based on ~10,000 motors available at that time – Un-stamped nameplate indicates a Pre-EPAct motor EPAct and NEMA Premium motor efficiency – Published efficiency tables from DOE

7
Weightings table* Table 3: Efficiency Levels For 15HP to 500 HP Processed Through GMI by Horsepower HP Pre-EPact MotorsEPactNEMA Premium®Total N =% of TotalN =% of TotalN =% of TotalN = 158250%2515%5735%164 2011569%3219%1911%166 257572%2120%88%104 307776%1414%1010%101 408873%2017%1311%121 507169%1717%1515%103 606182%1014%34%74 7519182%3013%136%234 10012776%2113%1911%167 1258575%1513%1312%113 15014181%2816%63%175 20023081%4415%104%284 25012393% 97%132 30012794% 86%135 3507591% 79%82 40010696% 44%110 4503194% 26%33 50039100% 00%39 Total1844 79%27712% 216 9%2337 *Represents number of motors collected during program years Sept. 2008 – Aug.2012

8
Decision needed SBW recommended that an average efficiency rating consistent with motors processed through the program should be determined and used instead. Question: Is the weighting methodology and GMPG program data sufficiently reliable to use for this estimate?

9
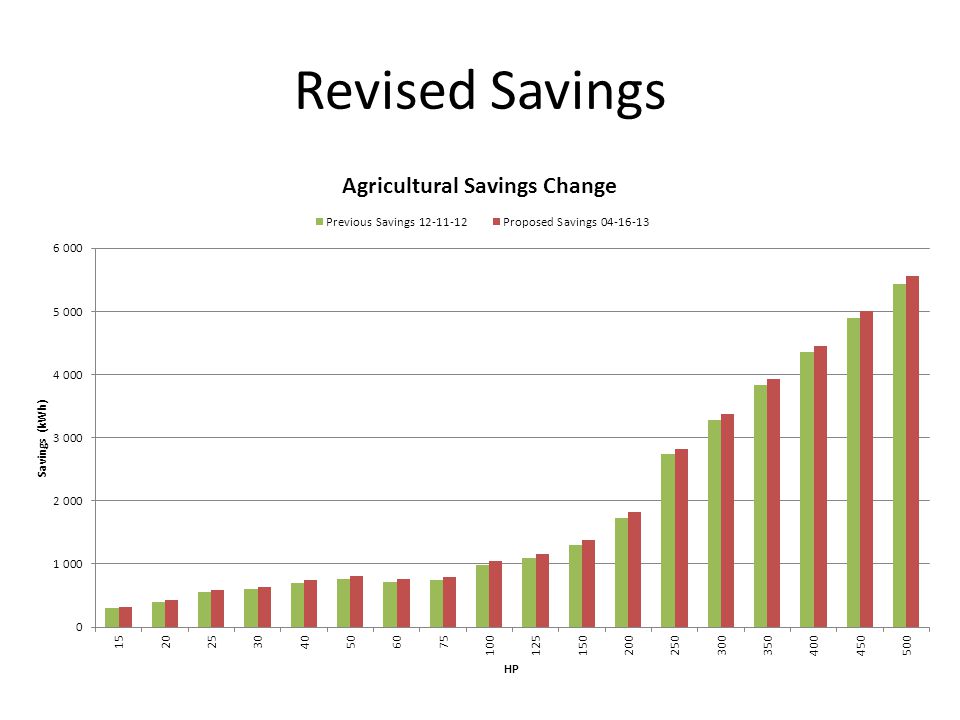
Revised Savings

11
RTF Proposed Motion: I ______________ move that the RTF incorporates the motor efficiency data and sources presented, updates the UES savings values for both Industrial and Agricultural Green Motor Rewinds, and moves the measures from “Under Review” to “Active” status.

12
BACK-UP SLIDES Reference Only - December 2012 RTF Presentation

13
Green Motor Rewinds Measure Classification and Properties Market SectorIndustrial; Agricultural Market SegmentAll Segments Measure CategoryMotors Measure Description Motors are rewound by Green Motors Practices Group (GMPG) program participants to the GMPG specifications rather than non-participant motor rewind shops. Measures are identified by motor horsepower ratings that range from 7.5 to 5,000. Sunset CriteriaOctober 1, 2017 Primary WorkbookProCostRTFTemplate257f_v3_9 Green Motor Rewinds 12_3_12 v11.xlsm Linked WorkbooksNone Number of Measures, and UES Components 72 total measures each calculated using a single UES component: 36 horsepower ratings x 2 market sectors (ind and ag)
.")
14
Green Motor Rewinds Summary of Actions to Date TaskTask SourceResult Update efficiency rating assumption for motors greater than 500 horsepower. Recommendation memo Resolved. Manufacturer data for motors 600 HP and above provided by GMPG submittal. Consider developing additional measure categories by motor type [Totally Enclosed Fan Cooled (TEFC), Open Drip Proof (ODP)] or motor speed (1200-3600 rpm). Recommendation memo Discussion item. Navigant recommends no further categorization as this provides little effect (~1-2%) on overall savings. Update standard rewind efficiency degradation assumption with studies of significantly smaller and larger motors. Recommendation memo Discussion item. A study of smaller motor (7.5 HP) rewind efficiency degradation was provided by GMPG submittal. Studies of motors larger than 150 HP are unavailable, as are studies of rewind efficiency degradation comparing motors in the field. Update duty cycle (operating hours) using average op hours, by horsepower rating, from the NW Motor Database. Recommendation memo Industrial op hours – Discussion item. Cascade Energy found that NW database run hours show minimal correlation to motor size and end use. 1 Agricultural op hours – Resolved. BPA provided motor operating hour data from its Ag Irrigation program. 1 Cascade Energy, presentation to the RTF on super high efficiency motors. November 14, 2012.
, Open Drip Proof (ODP)] or motor speed ( rpm). Recommendation memo Discussion item. Navigant recommends no further categorization as this provides little effect (~1-2%) on overall savings. Update standard rewind efficiency degradation assumption with studies of significantly smaller and larger motors. Recommendation memo Discussion item. A study of smaller motor (7.5 HP) rewind efficiency degradation was provided by GMPG submittal. Studies of motors larger than 150 HP are unavailable, as are studies of rewind efficiency degradation comparing motors in the field. Update duty cycle (operating hours) using average op hours, by horsepower rating, from the NW Motor Database. Recommendation memo Industrial op hours – Discussion item. Cascade Energy found that NW database run hours show minimal correlation to motor size and end use. 1 Agricultural op hours – Resolved. BPA provided motor operating hour data from its Ag Irrigation program. 1 Cascade Energy, presentation to the RTF on super high efficiency motors. November 14,")
15
Green Motor Rewinds Summary of Actions to Date (Continued) TaskTask SourceResult Update motor load factor assumption using average load factor, by horsepower rating, from the NW Motor Database. Recommendation memo Agricultural motor loading – Resolved. Based on BPA data compiled between 2002 and 2012 of actual motor loads measured during irrigation pump testing. Industrial motor loading – Discussion item. See Discussion item 2) below. Combine industrial and agricultural green motor rewind RTF workbooks due to major similarities between them. NWPCC / Navigant Resolved. Navigant combined industrial and agricultural efficient motor rewinds into a single workbook. Conduct further research into: 1) efficiency degradation assumption used by MotorMaster software, and 2) load factor assumptions in the NW Motor Database November RTF Meeting Discussion items: 1)According to DOE, the MotorMaster standard efficiency degradation assumption of 0.5 to 1% is based primarily on an EASA study of six 100-150 HP motors. 2)Motor loading data in the NW motors database was collected in a number of ways (metered/calculated, self- reported, estimated, etc.). Reported motor load estimates do not account for idle time.
 below. Combine industrial and agricultural green motor rewind RTF workbooks due to major similarities between them. NWPCC / Navigant Resolved. Navigant combined industrial and agricultural efficient motor rewinds into a single workbook. Conduct further research into: 1) efficiency degradation assumption used by MotorMaster software, and 2) load factor assumptions in the NW Motor Database November RTF Meeting Discussion items: 1)According to DOE, the MotorMaster standard efficiency degradation assumption of 0.5 to 1% is based primarily on an EASA study of six HP motors. 2)Motor loading data in the NW motors database was collected in a number of ways (metered/calculated, self- reported, estimated, etc.). Reported motor load estimates do not account for idle time..")
16
Discussion Item: Additional Measure Categories Green Motor Rewinds HP Average annual Energy Savings for GMPG Rewind (kWh) Min Savings (kWh) Max Savings (kWh) Average Savings (kWh) % Difference, Avg Savings vs. Max Savings ODPTEFC 1200 RPM1800 RPM3600 RPM1200 RPM1800 RPM3600 RPM 7.5141139147139137144 1371471414.10% 10182 192185182189 1821921863.30% 20359355371365355371 3553713632.20% 25532525547532525547 5255475352.30% 50725719742725719742 7197427291.90% 751,0079961,0261,0079881,026 9881,0261,0091.80% 1001,5501,5371,5971,5501,5371,580 1,5371,5971,5582.50% 1251,8901,8751,9271,8901,8751,890 1,8751,9271,8911.90% 1502,2502,2312,3122,231 2,269 2,2312,3122,2542.60% 2002,9992,9743,0252,9742,9502,999 2,9503,0252,9871.30% 2504,4214,3844,4594,3844,3484,384 4,3484,4594,3971.40% 3005,3055,2615,3055,2615,2175,261 5,2175,3055,2690.70% 4007,015 6,9567,015 6,9567,0157,0050.10% 5008,695 8,768 8,6958,768 8,6958,7688,7320.40% Navigant does not recommend extending motor rewind categories to differentiate between motor type (ODP/TEFC) or motor speed (1200-3600 RPM), as these have a minimal effect on overall savings. (Note: This would also add an additional 360 measure line items).
 or motor speed ( RPM), as these have a minimal effect on overall savings. (Note: This would also add an additional 360 measure line items)..")
17
HP Range Load FactorAnnual Op. Hours 5 to 20 HP79% 5,325 25 to 50 HP80% 5,592 60 to 100 HP78% 5,829 125 to 200 HP80% 5,922 250 to 500 HP82% 5,743 600 to 1,000 HP82% 7,065 1,025 to 5,000 HP82% 7,038 Discussion Item: Industrial Motor Loading and Op Hours Green Motor Rewinds NW Industrial Motor Database load factors were collected through different methods including metering/calculating, self-reported, and estimated based on end use. Reported motor load estimates do not account for idle time. Cascade Energy RTF presentation found minimal correlation between size, op hours and end use in the NW Industrial Motors Database. 1 Table below shows current industrial motor estimates. 1 Cascade Energy, presentation to the RTF on super high efficiency motors. November 14, 2012.

18
MotorMaster’s default standard rewind efficiency degradation (0.5 – 1%) is primarily based on 2003 EASA lab test of six motors between 100 and 150 HP. 1 Lab test showed efficiency degradation from non-process controlled rewinds of 0.3 to 1% (with an average of 0.6%). The 2003 EASA study, in conjunction with the MotorMaster default assumption (which is also based on EASA) was previously used as the RTF’s standard efficiency rewind degradation assumption. GMPG submittal provided a second study by the Association of Electrical and Mechanical Trades (AEMT) of much smaller motors (7.5 HP) showing efficiency degradations between 0.5 and 3%. 2 Studies of efficiency degradation for motors larger than 150 HP are unavailable. Studies of efficiency degradation comparing motors in the field or program/non- program participants are also unavailable. Discussion Item: Standard Rewind Efficiency Degradation Green Motor Rewinds 1 EASA/AEMT (2003). The Effect of Repair and Rewinding on Motor Efficiency. 2 AEMT (1996). The AEMT Good Practices Guide – Appendix 2: Burn-out Ovens and Their Effect on Stator Core Losses.
. The 2003 EASA study, in conjunction with the MotorMaster default assumption (which is also based on EASA) was previously used as the RTF’s standard efficiency rewind degradation assumption. GMPG submittal provided a second study by the Association of Electrical and Mechanical Trades (AEMT) of much smaller motors (7.5 HP) showing efficiency degradations between 0.5 and 3%. 2 Studies of efficiency degradation for motors larger than 150 HP are unavailable. Studies of efficiency degradation comparing motors in the field or program/non- program participants are also unavailable. Discussion Item: Standard Rewind Efficiency Degradation Green Motor Rewinds 1 EASA/AEMT (2003). The Effect of Repair and Rewinding on Motor Efficiency. 2 AEMT (1996). The AEMT Good Practices Guide – Appendix 2: Burn-out Ovens and Their Effect on Stator Core Losses..")
19
Do the Studies Used for Standard Rewind Efficiency Degradation Meet One of the Allowable Proven UES Estimation Procedures? Green Motor Rewinds Procedure 1: Statistical (Section 3.1.1, pg. 8 of the guidelines) “The UES estimate may be derived from statistical analysis of baseline and efficient case energy use.”* Navigant’s recommendation: Does not meet guidelines Neither the 2003 EASA study nor the 1996 AEMT study were designed to provide statistical samples of a population. To use either of these studies as the statistical sample of the NW motor rewind population is not statistically justifiable. Procedure 2: Meta-Statistical (Section 3.1.2, pg. 9 of the guidelines) “In some cases, relatively small statistical studies are conducted by a number of different agencies. None of these studies alone provide sufficient confidence in the UES estimate. However, the RTF may determine that a value in the range of savings demonstrated by these studies constitutes a sufficiently reliable estimate.”* * Regional Technical Forum (RTF). Guidelines for the Development and Maintenance of RTF Savings Estimation Methods. June 1, 2011.
 The UES estimate may be derived from statistical analysis of baseline and efficient case energy use. * Navigant’s recommendation: Does not meet guidelines Neither the 2003 EASA study nor the 1996 AEMT study were designed to provide statistical samples of a population. To use either of these studies as the statistical sample of the NW motor rewind population is not statistically justifiable. Procedure 2: Meta-Statistical (Section 3.1.2, pg. 9 of the guidelines) In some cases, relatively small statistical studies are conducted by a number of different agencies. None of these studies alone provide sufficient confidence in the UES estimate. However, the RTF may determine that a value in the range of savings demonstrated by these studies constitutes a sufficiently reliable estimate. * * Regional Technical Forum (RTF). Guidelines for the Development and Maintenance of RTF Savings Estimation Methods. June 1,")
20
Green Motor Rewinds Navigant’s recommendation: RTF needs to decide if these studies qualify as meta-statistical per the guidelines The provided motor rewind studies are not “statistical studies” in the sense that the motors tested were not designed be a statistical sample of a population. If the studies are considered to be “statistical studies,” the RTF could determine a “sufficiently reliable estimate” from these studies – which in the case of standard motor efficiency degradation would be some value between 0.3 and 3% (with an average closer to 0.6%). Procedure 3: Calibrated Engineering (Section 3.1.3, pg. 9 of the guidelines) “UES may be estimated with calibrated engineering procedures… Calibrated engineering estimates may be based on measurement and modeling of savings for randomly selected end users. Alternatively, they may be any group of program participants, if the RTF determines that the group is sufficiently representative of likely future participants.”* * Regional Technical Forum (RTF). Guidelines for the Development and Maintenance of RTF Savings Estimation Methods. June 1, 2011. Do the Studies Used for Standard Rewind Efficiency Degradation Meet One of the Allowable Proven UES Estimation Procedures?
. Procedure 3: Calibrated Engineering (Section 3.1.3, pg. 9 of the guidelines) UES may be estimated with calibrated engineering procedures… Calibrated engineering estimates may be based on measurement and modeling of savings for randomly selected end users. Alternatively, they may be any group of program participants, if the RTF determines that the group is sufficiently representative of likely future participants. * * Regional Technical Forum (RTF). Guidelines for the Development and Maintenance of RTF Savings Estimation Methods. June 1, Do the Studies Used for Standard Rewind Efficiency Degradation Meet One of the Allowable Proven UES Estimation Procedures .")
21
Green Motor Rewinds Navigant’s recommendation: RTF needs to decide if this study qualifies as a calibrated engineering study per guidelines It does not appear that the provided studies use “randomly selected end users” or “program participants” for the motors tested. The GMPG submittal references The Canadian Standards Association (CSA) Standard C392-11 1, which may be able to assess savings of this measure going forward, in conjunction with additional data; however, collecting the data would be difficult. C392-11’s foreword states, “This Standard provides guidance to electric motor service centers in verifying that the refurbishing process has maintained or enhanced the electric motor (hereafter motor) efficiency. It is also intended to provide a reliable evaluation of changes in the condition of the motor, with respect to its efficiency that might have resulted from its failure…” 1 Canadian Standards Association (CSA). Standard C392-11, Testing of three-phase squirrel cage induction motors during refurbishment. 2011. Do the Studies Used for Standard Rewind Efficiency Degradation Meet One of the Allowable Proven UES Estimation Procedures?
 Standard C , which may be able to assess savings of this measure going forward, in conjunction with additional data; however, collecting the data would be difficult. C392-11’s foreword states, This Standard provides guidance to electric motor service centers in verifying that the refurbishing process has maintained or enhanced the electric motor (hereafter motor) efficiency. It is also intended to provide a reliable evaluation of changes in the condition of the motor, with respect to its efficiency that might have resulted from its failure… 1 Canadian Standards Association (CSA). Standard C392-11, Testing of three-phase squirrel cage induction motors during refurbishment Do the Studies Used for Standard Rewind Efficiency Degradation Meet One of the Allowable Proven UES Estimation Procedures .")
22
Energy Savings Results Comparison – Industrial Sector Green Motor Rewinds

23
Energy Savings Results Comparison – Industrial Sector Green Motor Rewinds

24
TRC Comparison – Industrial Sector Green Motor Rewinds

25
Energy Savings Results Comparison – Agricultural Sector Green Motor Rewinds

26
Energy Savings Results Comparison – Agricultural Sector Green Motor Rewinds

27
TRC Comparison – Agricultural Sector Green Motor Rewinds

Similar presentations


 for Potato/Onion Shed Fans UES Measure Update Regional Technical Forum April 23, 2014.>")

 UES Measure Recommendation Regional Technical Forum November 19, 2013.>")


 Subcommittee Christian Douglass Regional Technical Forum June 18, 2015.>")

 Planning UES Measure Proposal Regional Technical Forum August 20, 2013.>")