Download presentation
Presentation is loading. Please wait.

1
Advancing the management of water resources Columbia, MD Raleigh, NC Andrew D. Dehoff, P.E and Daniel P. Sheer, Ph.D., P.E. October 22, 2004 Position Analysis and Forecast-Based Water Supply Operations Reducing Risk and Saving Money by Operating Smarter

4
Marietta Gage Conowingo Gage City of Lancaster Pipeline Chester Water Authority Pipelines Muddy Run Pumped Storage Facility Safe Harbor Dam Holtwood Dam Conowingo Dam City of Baltimore Pipeline Peach Bottom Atomic Power Station York Water Co. Pipeline Conowingo Pool and surrounding area

5
Conflicting Objectives FERC minimum pool elevation FERC minimum flow requirements FERC recreation requirements Municipal withdrawals Habitat/fishery needs Salinity intrusion

6
Conowingo Dam 108.5 ft. Normal Pool 104.5 ft. Normal Minimum Level due to hydroelectric operations 102.5 ft. Critical Level for Peach Bottom 100.5 ft. Minimum Conowingo Pool 97.0 ft. Peach Bottom shuts down Limited Range of Operations

7
No reservoir system is fail safe There is always some risk of running out of water. Water supply planning and operations can reduce, but not eliminate that risk. Position Analysis and forecast-based operations can allow you to manage risk explicitly and effectively

8
Reducing Risk Capacity expansion reduces the risk of water shortage Smart operating policies can also reduce the risk of water shortage What are you willing to do or pay to achieve an acceptable level of reliability?

9
Traditional Approach Safe Yield: The amount of water that can be safely withdrawn from a reservoir (system) during some specified drought. Implied Reliability: Safe yield of record 50-year safe yield 20-year safe yield Etc.

10
Traditional Approach, cont’d. Supply/Demand Time Safe Yield Supply Demand

11
Traditional Approach, cont’d. Supply/Demand Time Safe Yield Supply Demand

12
Safe Yield Isn’t a measure of reliability Safe yield in all but the simplest systems is more than the sum of the safe yields of individual facilities How the system is operated is very important Safe Yield isn’t as Safe as It Sounds A system operated at historical safe yield will run out of water in any worse drought A system operated at 20 year safe yield will run out of water an average of 1 in 21 years

13
Operations are Crucial to Supply Increasing water available during droughts increases reliability Conjoint operations of all facilities can substantially increase the water available during droughts The objective of such operations is to minimize water loss through spill or seepage

14
Conjoint Use Simple Example Reservoir A - minimum spring inflow = 25% of storage Reservoir B - minimum spring inflow = 125% of storage Rule - empty reservoir B before drawing Reservoir A down more than 25% If the drought is 2 years long, the system will benefit from a complete refill of Reservoir B in the spring of the second year.

15
Examples of Conjoint Operations Upper and Lower Delaware Basin reservoirs Conowingo Pool and Baltimore City reservoirs Kansas River Basin Potomac River Basin

19
Measuring Reliability In actual operations, emergency measures will prevent a system from running out of water Short-term conservation Alternative higher cost or lower quality sources Emergency measures will be undertaken in many droughts, even if they are less severe than the drought used to calculate safe yield Expected frequency, duration, and severity of drought emergencies are good measures

20
Phase 1 Water Shortage Phases Percent of Years in Each Phase

21
Frequency, Severity and Duration Evaluated with a simulation model like OASIS Model includes facilities, demands, facility operating policies and drought management policies Model runs for a long (~50 year or longer) record, usually of historical flows Model outputs include when emergency measures are imposed Model also produces output that can be used for environmental and economic evaluations
 record, usually of historical flows Model outputs include when emergency measures are imposed Model also produces output that can be used for environmental and economic evaluations")
22
Operations to Increase Reliability Low cost conservation measures implemented early can avert high cost draconian measures later. Water saved = #days * demand_reduction/day Costs are more than monetary costs Costs of reducing 50% may be orders of magnitude larger than the cost of reducing 10%

23
Operating Rules Rules will also include provisions that minimize the negative effects of implementing emergency measures Rules will include operations to increase water available Rules should be adequate to handle any historical drought with a reasonable margin of safety. Rules will NOT be traditional safe yield rules

24
Operating Rules Can Impact Demands Environmental requirements Balancing of supplies

25
Operating Rules Can Consider Present state of the resource Storage Groundwater levels Inflow forecasts Time of year Demand forecasts Other factors

26
We Can’t Forecast Weather, But Streamflow depends on both weather and the “dryness” or “wetness” of the drainage basin The snow, soil and aquifers in the basin are reservoirs and we can get some useful information about how much water they will or can contribute to a stream or to wells over the next several months That information can be used to help make better operating decisions

27
NOT Particularly Useful Forecasts Expected value of flow over the next x months - on average, there will always be enough water Flows are likely to be higher than normal or lower than normal - OK, worry a little less or a little more Worst case scenario - wonderful if you’re paranoid, otherwise useless unless you know its probability (most are arbitrary)
")
28
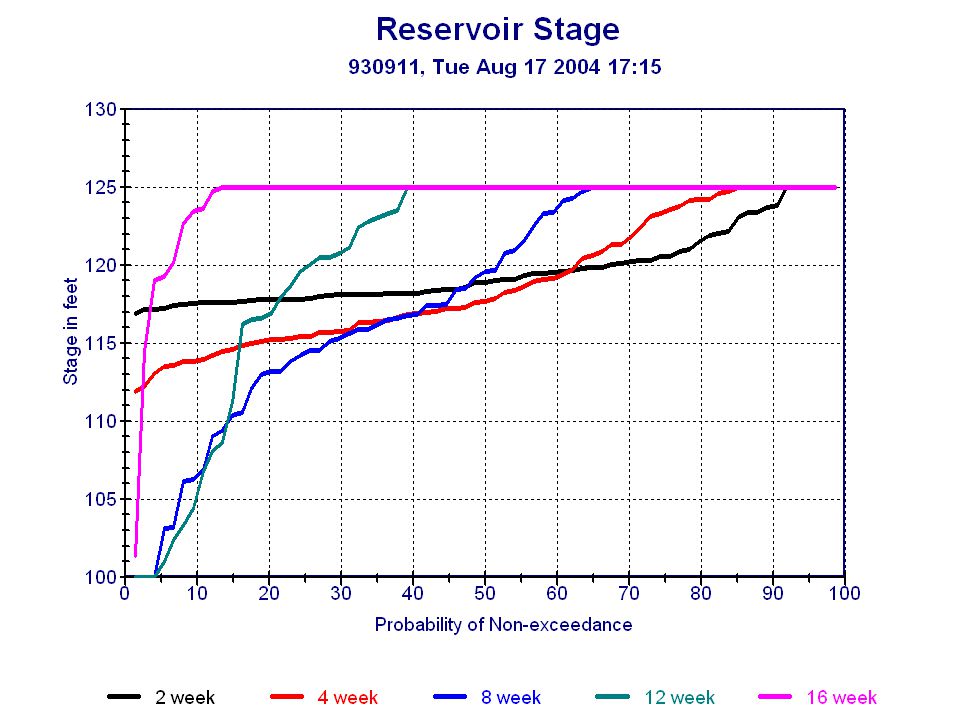
Useful Forecasts Flow time series and their probabilities Flow totals for various periods into the future and their probabilities

29
time t0t0 Historical Time Series Streamflow

30
Conditional Time Series Forecasts All start from today’s flows Can be produced using statistical methods or rainfall runoff models that represent surficial and deep aquifer interactions (and snow, if appropriate Usually produce “equally likely” traces based on the assumption that any year’s historical weather is equally likely to repeat

31
time t0t0 Time series conditioned upon today’s basin conditions Streamflow

32
Forecasts to Useful Information Run the simulation model for each of the equally likely forecasts If there are 50 equally likely traces, and the reservoir falls below a given level in only 5 of the simulations, then the probability of falling below that level is 10% given the rules used in the simulation Probabilities of other consequences, including environmental consequences and utility revenue can also be evaluated

39
How to respond If the probabilities of untoward events are too high, change the rule and test again. If it works and you’re happy with the rule, do it. Find a rule that works for the long-term so you don’t have to change rules “on the fly”

40
Creating a Rule That Uses Forecasts Many forms are possible The Rocky Mount rule If the probability of the reservoir falling below 25% in the next 8 weeks is > 20% institute water use restrictions and reduce instream flow A possible (and untested) Conowingo Rule If the probability of Marietta flow falling below 2500 cfs in the next summer is > 20% begin Baltimore pumping
 Conowingo Rule If the probability of Marietta flow falling below 2500 cfs in the next summer is > 20% begin Baltimore pumping")
41
Effective Rules Can NOT miss any droughts Must provide enough advance notice for remedial action to be effective Minimize the number of false alarms Developed by trial and error through the use of simulation models.

42
Evaluating Rules

43
Checking that the Rule is Sufficient

44
Rocky Mount Results Change in operating rule replaced $70M pipeline Required emergency measures infrequent and not severe NCDNR agreed to tie reductions in instream flow requirements to imposition of demand restrictions Environmental impacts of infrequent reductions in low flow (still well above “natural flows”) judged less than impacts of building and operating the pipeline
 judged less than impacts of building and operating the pipeline")
45
Advancing the management of water resources Columbia, MD Raleigh, NC Thank You

Similar presentations