Download presentation
Presentation is loading. Please wait.

1
Proportional relationships and graphs of lines

2
1)Using the graph, determine how many calories she burns in one minute? 2)What is the unit rate? What is the constant of proportionality? 3)Write an equation relating the number of minutes swam to calories burned: 4)If Jenny swam for 25 minutes, how many calories did she burn? 5)If Jenny wanted to burn 800 calories, how many hours would it take?
What is the unit rate. What is the constant of proportionality. 3)Write an equation relating the number of minutes swam to calories burned: 4)If Jenny swam for 25 minutes, how many calories did she burn. 5)If Jenny wanted to burn 800 calories, how many hours would it take .")
3
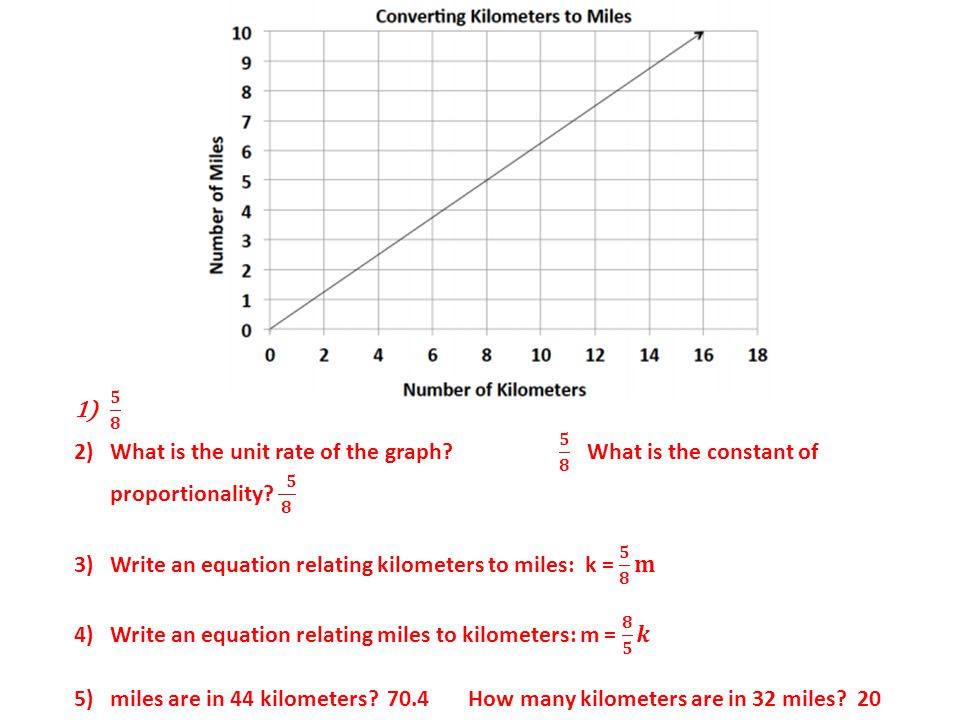
1)Using the graph, how many miles are in 1 kilometer? 2)What is the unit rate of the graph? What is the constant of proportionality? 3)Write an equation relating kilometers to miles: 4)Write an equation relating miles to kilometers: 5)How many miles are in 44 kilometers? How many kilometers are in 32 miles?
What is the unit rate of the graph. What is the constant of proportionality. 3)Write an equation relating kilometers to miles: 4)Write an equation relating miles to kilometers: 5)How many miles are in 44 kilometers. How many kilometers are in 32 miles .")
4
KEY Red = John Blue = Kiara Green = Ronnie 1)Who is running the fastest? 2)Determine the unit rate for each runner. 3)Write an equation for each runner relating time to distance.
Determine the unit rate for each runner. 3)Write an equation for each runner relating time to distance..")
5
Looking at the equation Lets look at the equation of each runner in the form y = kx: In which equation is the value of k the largest? Who was the fastest runner? How could you determine who ran fastest by looking at the equation only?

6
Slope of a Line The value of k in y = kx is not only the unit rate, but it determines how fast or slow the line of the graph rises.

7
Independent Check your answers below For practice you will be completing IXL section 8 th grade i.4, 8 th grade i.5, and 8 th grade i.6 to a smart score of 80.

8
Answers Don’t look until you have done the work!

11
KEY Red = John Blue = Kiara Green = Ronnie

12
Lets look at the equation of each runner in the form y = kx: In which equation is the value of k the largest? – Kiara Who was the fastest runner? – Kiara How could you determine who ran fastest by looking at the equation only? – As the value of k increases, the line of the graph becomes steeper. The equation with the largest value of k will be fastest.

Similar presentations


 : distance traveled (d) divided by the amount of time it takes to travel (t). S = d t OR S= d t.>")


