Download presentation
Presentation is loading. Please wait.

1
Carbon Management and Infrastructure Development: Lessons from Industrial Ecology Dr. Robin Curry Institute for a Sustainable World Queen’s University, Belfast r.curry@qub.ac.uk

2
Overview Industrial Ecology (IE), resource management and Climate Change Examples of IE applications in the UK and Ireland Opportunities and synergies The future role of IE methods in policy development and decision making
, resource management and Climate Change Examples of IE applications in the UK and Ireland Opportunities and synergies The future role of IE methods in policy development and decision making")
3
Industrial Ecology (IE), resource management and Climate Change Industrial Ecology and Industrial Metabolism Tools, techniques and approaches
, resource management and Climate Change Industrial Ecology and Industrial Metabolism Tools, techniques and approaches")
4
Industrial Ecology and Industrial Metabolism ‘The systematic examination of local, regional and global material and energy uses and flows in products, processes, industrial sectors and economies’

5
Industrial Ecology and Industrial Metabolism

6
Our Infrastructure must develop/adapt and change; We need to make decisions about these changes and developments; We need tools and techniques to support these decisions; and IE is about Applied Research: What are the optimum decisions?

7
Tools, techniques and approaches Material and Energy Flow Studies Dematerialisation and Decarbonisation Life-Cycle Analysis and Carbon and Ecological Footprinting Eco-Industrial Parks ('Industrial Symbiosis') Geographical Information Systems
 Geographical Information Systems")
8
Examples of IE applications in the UK and Ireland Northern Limits. A Resource Flow Analysis and Ecological Footprint of Northern Ireland (2004/2006) Island Limits. A Material Flow Analysis and Ecological Footprint of Ireland (2008) SAMFA: A GIS application of material flow analysis in Ireland (2010) UK Construction Sector Resource Efficiency Model (2007) INTRAWaste. Integrated Resource and Waste Life Cycle Model for Ireland (2010)
 Island Limits. A Material Flow Analysis and Ecological Footprint of Ireland (2008) SAMFA: A GIS application of material flow analysis in Ireland (2010) UK Construction Sector Resource Efficiency Model (2007) INTRAWaste. Integrated Resource and Waste Life Cycle Model for Ireland (2010).")
9
Northern Limits. A Resource Flow Analysis and Ecological Footprint of Northern Ireland Completed as part of the UK Mass Balance Programme, a £10m programme which and covered more than 60 project areas http://www.massbalance.org/resou rce/massbalance/ http://www.massbalance.org/resou rce/massbalance/

11
Northern Limits. Ecological Footprint of Sample Menus

12
Island Limits. A Material Flow Analysis and Ecological Footprint of Ireland Economy wide material flow accounts An economy wide MFA was calculated for the Irish economy for 2003. The flows of materials and products were quantified by industrial sector (NACE Rev.1.1), using the Eurostat guidance. Eurostat. Economy-wide material flow accounts and derived indicators. A methodological guide. 2002
, using the Eurostat guidance. Eurostat. Economy-wide material flow accounts and derived indicators. A methodological guide")
13
Mass Balance/Material Flow Analysis Principles For a given system such as production or consumption processes, companies, regions or national economies, the material balance principle leads to the following identity: total inputs = total outputs + net accumulation meaning that what goes into the system is either accumulated in the system or is leaving the system again as an output.

14
Material flow model of Ireland Note: Net addition to stock is a balancing item as calculation of stock was outside the scope of the present study.

15
DMI and DMC by sector in Ireland in 2003

16
MFA Indicators

17
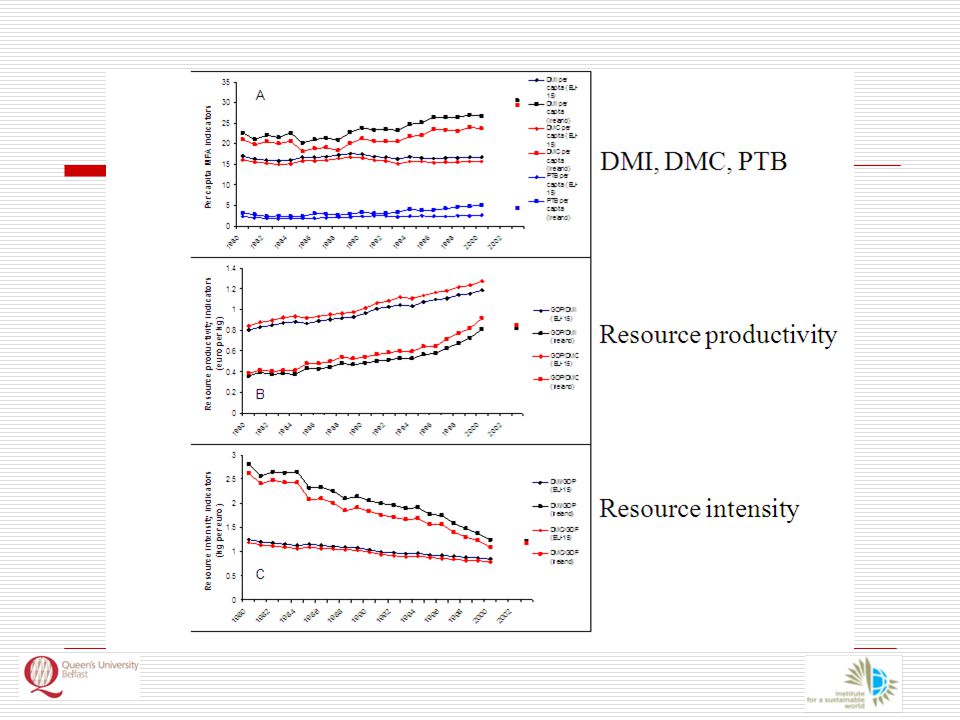
Direct Material Input DMI from 1980-2003 for the EU-15

18
Direct Material Input per capita DMI per capita from 1980-2003 for the EU-15

20
Input-Output Analysis Methodology Environmentally extended Ireland’s 2000 monetary I-O tables by extending a multiplier matrix derived from the MIOT by a resource intensity vector.

21
Separate analyses were carried out for: DMI (Direct Material Input) Biomass Metals Fossil fuels Minerals Imports
 Biomass Metals Fossil fuels Minerals Imports")
22
Total material requirements of sectors to produce total final demand Highest requirements: Construction – 36% of DMI Food & Beverages – 24% Non-metallic mineral – 9% Agri, forestry, fishing – 8%

23
SAMFA: A GIS application of material flow analysis in Ireland Combines national MFA accounts with dynamic MFA (dMFA) work by Muller, to spatially allocate material flows using vectors such as material intensity & building lifetime simulations. (Roy, Ellis, Curry. In print) Muller, D. Stock dynamics for forecasting material flows—Case study for housing in The Netherlands. Ecological Economics. 59. 2006
 Muller, D. Stock dynamics for forecasting material flows—Case study for housing in The Netherlands. Ecological Economics")
24
SAMFA: A GIS application of material flow analysis in Ireland SAMFA National/ regional govt. policy & standards - Housing provision - Energy standards - Resource management - Waste and recovery Local govt. authority development factors Existing housing - Year built - Energy efficiency Land & planning factors - Land availability - Planning permission Geographic factors - Density - Planning constraints Demographic factors - Population - Lifestyle (e.g. floor area) Analysts/ professional bodies/LA Industries & services Private Households New house building Restoration/ retrofitting Demolition/ recycling/ waste M2: Spatial allocation of new housing units M3: Material-balance at various spatial levels M1: Material intensity & building lifetime simulation Further analysis/application
 Analysts/ professional bodies/LA Industries & services Private Households New house building Restoration/ retrofitting Demolition/ recycling/ waste M2: Spatial allocation of new housing units M3: Material-balance at various spatial levels M1: Material intensity & building lifetime simulation Further analysis/application.")
25
SAMFA: A GIS application of material flow analysis in Ireland SAMFA National/ regional govt. policy & standards - Housing provision - Energy standards - Resource management - Waste and recovery Local govt. authority development factors Existing housing - Year built - Energy efficiency Land & planning factors - Land availability - Planning permission Geographic factors - Density - Planning constraints Demographic factors - Population - Lifestyle (e.g. floor area) Analysts/ professional bodies/LA Industries & services Private Households New house building Restoration/ retrofitting Demolition/ recycling/ waste M2: Spatial allocation of new housing units M3: Material-balance at various spatial levels M1: Material intensity & building lifetime simulation M6: Total energy use at various spatial levels M5: OE at various spatial levels M4: EE at various spatial levels Use of existing building
 Analysts/ professional bodies/LA Industries & services Private Households New house building Restoration/ retrofitting Demolition/ recycling/ waste M2: Spatial allocation of new housing units M3: Material-balance at various spatial levels M1: Material intensity & building lifetime simulation M6: Total energy use at various spatial levels M5: OE at various spatial levels M4: EE at various spatial levels Use of existing building.")
26
UK Construction Sector Resource Efficiency Model Links material and product flows to building type vis Bills of Quantities and combines this with the Carbon Trust Inventory of Carbon and Energy (ICE) for Inventory of Carbon and Energy (ICE); Allows designers to assess the resource use and carbon footprint of different products and material choices at the design stage.
 for Inventory of Carbon and Energy (ICE); Allows designers to assess the resource use and carbon footprint of different products and material choices at the design stage.")
27
UK Construction Sector Resource Efficiency Model

28
INTRAWaste. Integrated Resource and Waste Life Cycle Model for Ireland

29
INTRAWaste structure

30
Opportunities and synergies Construction Sector dynamic Material Flow Analysis (dMFA) Model for resource and energy use, waste and emissions – comparative evaluation of economies? International Open-Source Life Cycle Analysis Model for Integrated Waste and Resource Management – align with current developments in International LCA standards – ILCD and ISO.

31
Construction Sector dynamic Material Flow Analysis (dMFA) Model Offers the possibility of: Assessing the Whole Life Carbon Footprint of infrastructure development (direct and embodied energy); Identify when material inputs will become wastes and what the policy measures, capacity building and waste infrastructure needs will be; Can be combined with other tools such as GIS or Life Cycle Analysis/Carbon Footprinting.
 Model Offers the possibility of: Assessing the Whole Life Carbon Footprint of infrastructure development (direct and embodied energy); Identify when material inputs will become wastes and what the policy measures, capacity building and waste infrastructure needs will be; Can be combined with other tools such as GIS or Life Cycle Analysis/Carbon Footprinting.")
32
Construction Sector dynamic Material Flow Analysis (dMFA) Model Duffy and Woodward. Cement and concrete flow analysis in a rapidly expanding economy: Ireland as a case study. Resources, Conservation & Recycling. Under review

33
Opportunities and synergies

34
Conclusions Resource efficiency is as important as direct energy use in reducing our carbon emissions; A range of tools and techniques from Industrial Ecology can be combined to give us a complete picture of the metabolism of our infrastructure over time; and This ‘picture’ provides the evidence base to make informed decisions about creating low- carbon infrastructure and economies.

Similar presentations


 CILCA, Coatzacoalcos, April 2011 Sonia Valdivia Guido Sonnemann.>")

 APPROACH FOR THE.>")

 on municipal level Lucian.>")
>")


