Download presentation
Presentation is loading. Please wait.

1
Towards a Comprehensive Structure and Intensity Dataset Jonathan L. Vigh Colorado State University 11:00 AM Wednesday February 25, 2009 Joint Informal NCAR-MMM/CSU/CIRA Hurricane Symposium NASA/TCSP Grant NNG06GA54G and NSF Grant ATM-0332197

2
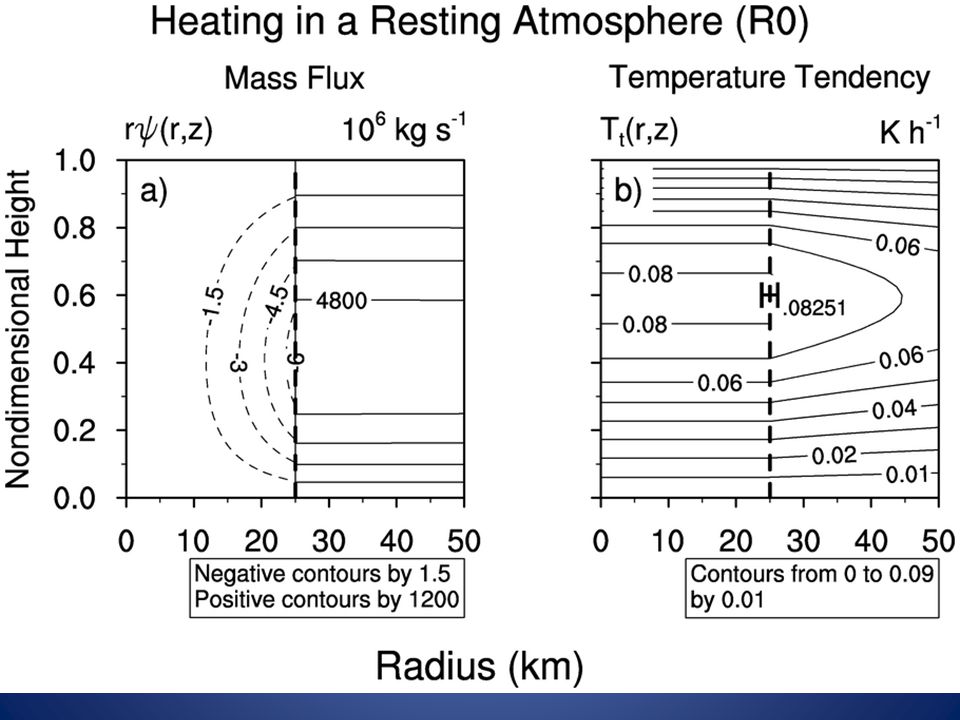
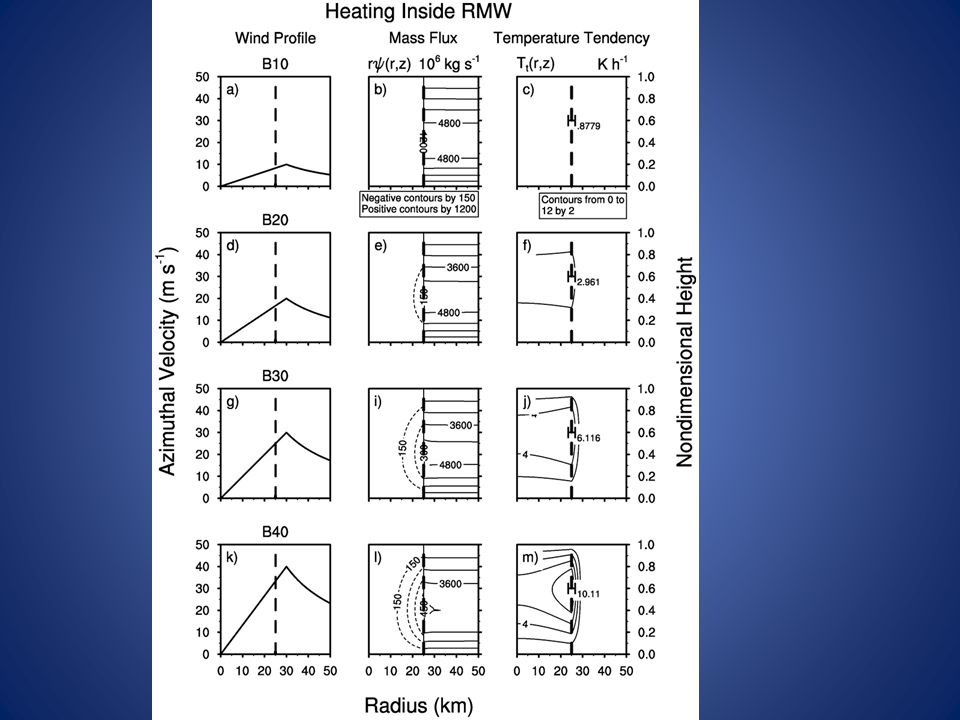
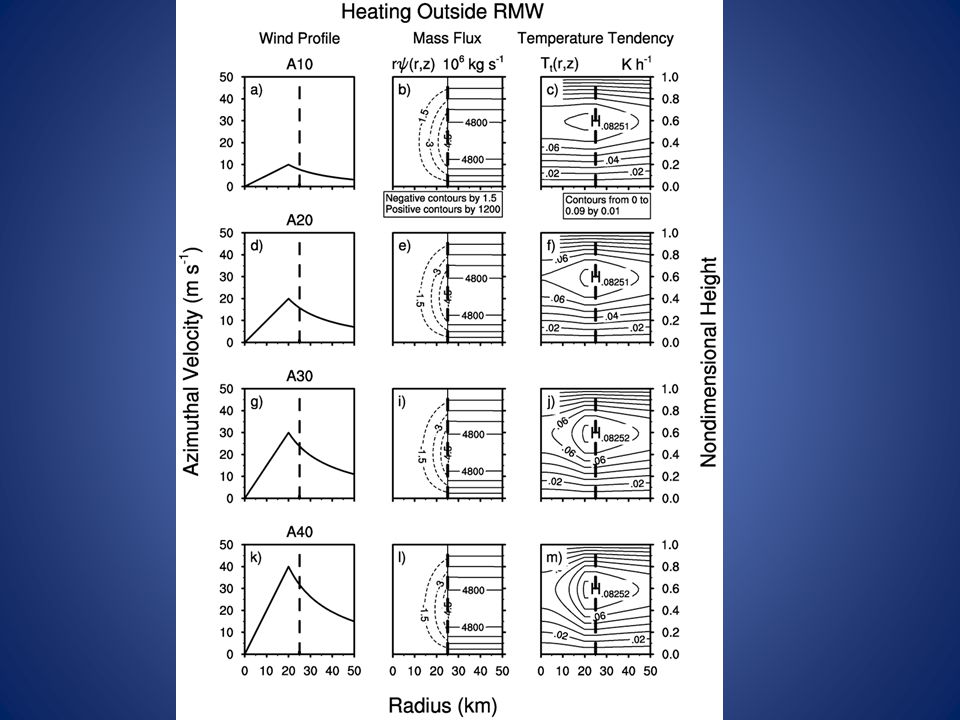
Summary of Work with Geopotential Tendency Equation Inertial stability plays a crucial role in determining the storm’s response to latent heating. – Heating in the region of high inertial stability strongly localizes the warming response resulting in rapid development of the warm core. – Heating outside the RMW has almost no effect, no matter how small the Rossby radius becomes in the core. Development of the warm core acts as a brake on further intensification. – Diabatic heating is locked out of the region of high inertial stability. – m-surfaces slope outward and PV and heating become “locked” together, shutting down PV production in the eyewall. Paper submitted -> JAS: “Rapid Development of the Tropical Cyclone Warm Core”

3
Future Work With the Geopotential Tendency Equation Introduce baroclinity into our analytic framework – vertical wind shear – slope of eye wall Explore the impact of realistic wind profiles on our results – Use Mathematica to numerically solve the radial tendency equation – Use a numerical (multigrid) solver to solve for spatially- varying A, B, and C coefficients Test theories on eye slope (e.g. Palmén 1956) Explain why the warm core anomaly is maximized around 250 mb See if we can explain the occasional lower temp anomaly
 Explain why the warm core anomaly is maximized around 250 mb See if we can explain the occasional lower temp anomaly.")
4
Summary of Progress on the Extended Flight Level Dataset

5
Observational Goals Determine intensity at time of eye formation Determine intensification rate before, during, and after eye formation Conceptualize temporal evolution of convective morphology before and during eye formation To calculate inertial stability and temperature tendencies (and proportion of heating within RMW?), relate to warm core development Data sources (2002-2008, focus on 2005 storms) – Best Track dataset – Vortex Data Message archive – Microwave satellite data (NRL) – CIRA GOES IR satellite archive – Extended Willoughby-Rahn Dataset (2002-Present) – SFMR (2006 onward) – QuikSCAT* – Dropsondes*
, relate to warm core development Data sources ( , focus on 2005 storms) – Best Track dataset – Vortex Data Message archive – Microwave satellite data (NRL) – CIRA GOES IR satellite archive – Extended Willoughby-Rahn Dataset (2002-Present) – SFMR (2006 onward) – QuikSCAT* – Dropsondes*")
6
Vortex Data Message Archive Spans over 212 storms from 1989-2008 133,000 lines of ASCII text – under 7 MB! 5533 total messages – 5169 in Atlantic – 288 in Eastern Pacific

7
Vortex Data Message Format (pre-1998) URNT12 KMIA 160900 COR 01 AF366 0211A HUGO OB 12 COR 01 KMIA DETAILED A. 16/ 0842Z B. 15DEG 17MIN N 57DEG 50MIN W C. 700MB 2460M D. NA KT E. NA DEG NM F. 150DEG 114KT G. 090DEG 10 NM H. / 930MB I. 12 C/ 3010M J. 20 C/ 3108M K. 3C/ NA C L. CLOSED WALL M. C-06 N. 15DEG 17MIN N 57DEG 50MIN W 16/ 0842Z O. 12345/ 7 P. 4 / 3 NM Q. MAX FL WND 114 KTS EAST QUAD AT 0835Z <- JV - was 'O835Z' - changed 'O' to '0'

8
Vortex Data Message Format (post-1999) URNT12 KNHC 061722 header, office, transmission day/time VORTEX DATA MESSAGE AL172008 stormid A. 06/17:07:10Z day/time of fix (note no month!) B. 15 deg 51 min N latitude of fix 081 deg 54 min W longitude of fix C. 850 mb 1398 m minimum height at standard level D. 49 kt estimate of maximum surface wind observed (visual or SFMR) E. 291 deg 8 nm bearing and range from center of maximum surface wind F. 031 deg 041 kt maximum flight level wind near center G. 293 deg 008 nm bearing and range from center of maximum flight level wind H. 997 mb minimum sea level pressure computed from dropsonde or extrapolated I. 16 C/ 1524 m maximum flight level temperature/altitude OUTSIDE eye J. 19 C/ 1521 m maximum flight level temperature/altitude INSIDE eye K. 16 C/ NA dewpoint temperature/sea surface temperature inside eye L. CLOSED eye character (closed wall, poorly defined, open SW) M. C18 eye shape/orientation/diameter (C18, CO8-14, E09/15/5) N. 12345/8 fix determined by/fix level O. 0.02 / 1 nm navigational accuracy/meteorological accuracy P. AF303 0317A PALOMA1 OB 08 aircraft number/wx mission identifier/stormname/ob/correction MAX FL WIND 41 KT NW QUAD 17:04:40 Z <- time of maximum wind noted with quadrant MAX OUTBOUND FL WIND 61 KT SE QUAD 17:11:40 Z <- if max outbound wind exceeds inbound MAX FL TEMP 20 C 129 / 07 NM FROM FL CNTR<- bearing and range if not within 5 nm of center
 B. 15 deg 51 min N latitude of fix 081 deg 54 min W longitude of fix C. 850 mb 1398 m minimum height at standard level D. 49 kt estimate of maximum surface wind observed (visual or SFMR) E. 291 deg 8 nm bearing and range from center of maximum surface wind F. 031 deg 041 kt maximum flight level wind near center G. 293 deg 008 nm bearing and range from center of maximum flight level wind H. 997 mb minimum sea level pressure computed from dropsonde or extrapolated I. 16 C/ 1524 m maximum flight level temperature/altitude OUTSIDE eye J. 19 C/ 1521 m maximum flight level temperature/altitude INSIDE eye K. 16 C/ NA dewpoint temperature/sea surface temperature inside eye L. CLOSED eye character (closed wall, poorly defined, open SW) M. C18 eye shape/orientation/diameter (C18, CO8-14, E09/15/5) N /8 fix determined by/fix level O / 1 nm navigational accuracy/meteorological accuracy P. AF A PALOMA1 OB 08 aircraft number/wx mission identifier/stormname/ob/correction MAX FL WIND 41 KT NW QUAD 17:04:40 Z <- time of maximum wind noted with quadrant MAX OUTBOUND FL WIND 61 KT SE QUAD 17:11:40 Z <- if max outbound wind exceeds inbound MAX FL TEMP 20 C 129 / 07 NM FROM FL CNTR<- bearing and range if not within 5 nm of center.")
9
But wait, isn’t all this in the f-decks? AL, 17, 200811061707, 50, AIRC, CI,, 1585N, 8190W,, 1, 49, 2, 997, 1,,,,,,,,,,,,,,,, KNHC, NHC,, 850, 1398, 49, 291, 8, 31, 41, 293, 8, 997, 16, 19, 16,,, CI,, 18,,, 10, 3, EYEWALL CLSD - SLP FM DROP - MAX FL TEMP 20C 129/07 AL, 17, 200811061712, 50, AIRC, I,,,,, 3, 52, 2,,,,,,,,,,,,,,,,,,, JLB,, 850,, 52,,, 224, 61,,,,,,,,,,,,,,, 3, MAX FLT LVL AND SFMR WND OUTBND (Answer: mostly...)
.")
10
Comparison between VDM and f- decks Key: (VDM only) (both) (f-deck only) URNT12 KNHC 061722 header, office, transmission day/time VORTEX DATA MESSAGE AL172008 stormid A. 06/17:07:10Z day/time of fix (f-deck has full date/time – very handy) B. 15 deg 51 min N latitude of fix 081 deg 54 min W longitude of fix C. 850 mb 1398 m minimum height at standard level D. 49 kt estimate of maximum surface wind observed (visual or SFMR) E. 291 deg 8 nm bearing and range from center of maximum surface wind F. 031 deg 041 kt maximum flight level wind near center G. 293 deg 008 nm bearing and range from center of maximum flight level wind H. 997 mb minimum sea level pressure computed from dropsonde or extrapolated I. 16 C/ 1524 m maximum flight level temperature/altitude OUTSIDE eye J. 19 C/ 1521 m maximum flight level temperature/altitude INSIDE eye K. 16 C/ NA dewpoint temperature/sea surface temperature inside eye L. CLOSED eye character (closed wall, poorly defined, open SW) M. C18 eye shape/orientation/diameter (C18, CO8-14, E09/15/5) N. 12345/8 fix determined by/fix level O. 0.02 / 1 nm navigational accuracy/meteorological accuracy P. AF303 0317A PALOMA1 OB 08 aircraft number/wx mission identifier/stormname/ob/correction Wall cloud thickness eye characterization is summarized in abbreviated remarks of f-decks
 B. 15 deg 51 min N latitude of fix 081 deg 54 min W longitude of fix C. 850 mb 1398 m minimum height at standard level D. 49 kt estimate of maximum surface wind observed (visual or SFMR) E. 291 deg 8 nm bearing and range from center of maximum surface wind F. 031 deg 041 kt maximum flight level wind near center G. 293 deg 008 nm bearing and range from center of maximum flight level wind H. 997 mb minimum sea level pressure computed from dropsonde or extrapolated I. 16 C/ 1524 m maximum flight level temperature/altitude OUTSIDE eye J. 19 C/ 1521 m maximum flight level temperature/altitude INSIDE eye K. 16 C/ NA dewpoint temperature/sea surface temperature inside eye L. CLOSED eye character (closed wall, poorly defined, open SW) M. C18 eye shape/orientation/diameter (C18, CO8-14, E09/15/5) N /8 fix determined by/fix level O / 1 nm navigational accuracy/meteorological accuracy P. AF A PALOMA1 OB 08 aircraft number/wx mission identifier/stormname/ob/correction Wall cloud thickness eye characterization is summarized in abbreviated remarks of f-decks.")
11
Comparison between VDM and f- decks, cont’d VDM remarks: MAX FL WIND 41 KT NW QUAD 17:04:40 Z MAX OUTBOUND FL WIND 61 KT SE QUAD 17:11:40 Z MAX FL TEMP 20 C 129 / 07 NM FROM FL CNTR f-deck abbreviated remarks (52 characters): EYEWALL CLSD - SLP FM DROP - MAX FL TEMP 20C 129/07 MAX FLT LVL AND SFMR WND OUTBND Summary: VDMs very hard to read, f-decks much more standardized f-decks missing transmission date/time, altitude of max temperature information, platform info, fix determination methods, many interesting remarks may be left out VDMs missing the eyewall thickness estimate Most importantly – the VDMs are available in near-real time while the fix files may be delayed by hours (9 hrs at one point this past summer)
: EYEWALL CLSD - SLP FM DROP - MAX FL TEMP 20C 129/07 MAX FLT LVL AND SFMR WND OUTBND Summary: VDMs very hard to read, f-decks much more standardized f-decks missing transmission date/time, altitude of max temperature information, platform info, fix determination methods, many interesting remarks may be left out VDMs missing the eyewall thickness estimate Most importantly – the VDMs are available in near-real time while the fix files may be delayed by hours (9 hrs at one point this past summer)")
12
Required Remarks Mission identifier and observation number – P. AF301 0517A PALOMA OB 3 Maximum flight-level wind observed on latest pass through any part of the storm, time of observation, relative quadrant (3397, 61%) – MAX FL WIND 97 KT NE QUAD 21:30:13 Z Maximum flight-level wind on the outbound leg of center fix just obtained, if it is higher than the value in reported in item Foxtrot. This is updated if an even higher value is reported before the cross-leg turn point. – MAX OUTBOUND AND MAX FL WIND 106 KT NW QUAD 07:30 Z Method of deriving central SLP when extrapolated – SLP EXTRAPOLATED FROM 700 MB The bearing and range of the surface center and/or maximum flight level temperature if not within 5 nm of the flight level center (405, 7.3%) – MAX FL TEMP 20 C 129 / 07 NM FROM FL CNTR Bearing and range of surface center if more than 5 nm from flight level center – SFC CNTR 270/15 NM FROM FL CNTR
 – MAX FL WIND 97 KT NE QUAD 21:30:13 Z Maximum flight-level wind on the outbound leg of center fix just obtained, if it is higher than the value in reported in item Foxtrot. This is updated if an even higher value is reported before the cross-leg turn point. – MAX OUTBOUND AND MAX FL WIND 106 KT NW QUAD 07:30 Z Method of deriving central SLP when extrapolated – SLP EXTRAPOLATED FROM 700 MB The bearing and range of the surface center and/or maximum flight level temperature if not within 5 nm of the flight level center (405, 7.3%) – MAX FL TEMP 20 C 129 / 07 NM FROM FL CNTR Bearing and range of surface center if more than 5 nm from flight level center – SFC CNTR 270/15 NM FROM FL CNTR.")
13
Optional Remarks SFMR (53) Lightning (43) Hail (10) Heavy rain (9) Remarks on turbulence (heavy, occasional, smooth) Ragged (77) Band or banding (150) Undercast in eye (23), overcast, or relatively cloud free (2) Radar Presentation (282) – POOR RADAR, POOR EYEWALL, EYE POORLY DEFINED, POORLY FORMED, POORLY DEFINED EYEWALL – “EXCELLENT” (43) - EXCELLENT RADAR, PRESENTATION EXCELLENT, TEXTBOOK, PERFECT, CLASSIC – “STADIUM EFFECT” (30)
 Lightning (43) Hail (10) Heavy rain (9) Remarks on turbulence (heavy, occasional, smooth) Ragged (77) Band or banding (150) Undercast in eye (23), overcast, or relatively cloud free (2) Radar Presentation (282) – POOR RADAR, POOR EYEWALL, EYE POORLY DEFINED, POORLY FORMED, POORLY DEFINED EYEWALL – EXCELLENT (43) - EXCELLENT RADAR, PRESENTATION EXCELLENT, TEXTBOOK, PERFECT, CLASSIC – STADIUM EFFECT (30)")
14
Optional Remarks, cont’d Presence of eye – EYE FEATURE, EYEWALL, EYE STRUCTURE, EYE REPRESENTATION Primary eyewall forming (7) – PARTIAL EYEWALL FORMING NE QUAD; RADAR INDICATES WEAK EYE STRUCTURE FORMING; EYE WALL APPEARS TO BE FORMING SW - SE SIDE Inner eyewall forming (5) – CIRCULAR INNER EYEWALL FORMING DIAMETER 12 NM OPEN SW; MAX WIND BAND 60NM DIAMETER WITH SMALLER EYEWALL FORMING WITHIN; RAGGED INNER EYEWALL,C8, FORMING IN THE WESTERN EDGE OF LARGER EYE Outer eyewall forming (3) – SIGNS OF OUTER EYEWALL FORMING, APPROXIMATELY 30NM IN DIAMETER; INNER EYEWALL OPEN TO SW, OUTER EYEWALL FORMING FROM SPIRAL BANDS Concentricity – 2nd EYEWALL, SECOND EYEWALL, INNER EYEWALL, OUTER EYEWALL, DOUBLE Fragment or Remnant (25) – REMNANTS OF AN INNER EYEWALL REMAIN
 – PARTIAL EYEWALL FORMING NE QUAD; RADAR INDICATES WEAK EYE STRUCTURE FORMING; EYE WALL APPEARS TO BE FORMING SW - SE SIDE Inner eyewall forming (5) – CIRCULAR INNER EYEWALL FORMING DIAMETER 12 NM OPEN SW; MAX WIND BAND 60NM DIAMETER WITH SMALLER EYEWALL FORMING WITHIN; RAGGED INNER EYEWALL,C8, FORMING IN THE WESTERN EDGE OF LARGER EYE Outer eyewall forming (3) – SIGNS OF OUTER EYEWALL FORMING, APPROXIMATELY 30NM IN DIAMETER; INNER EYEWALL OPEN TO SW, OUTER EYEWALL FORMING FROM SPIRAL BANDS Concentricity – 2nd EYEWALL, SECOND EYEWALL, INNER EYEWALL, OUTER EYEWALL, DOUBLE Fragment or Remnant (25) – REMNANTS OF AN INNER EYEWALL REMAIN")
15
Dataset Details In progress: – Best track (track, intensity, MSLP, wind radii) – Full suite of VDM including many common remarks (over 100 variables) – My additions from subjective analysis of imagery: Time of low level convective ring observed in microwave Time of first eye mention in VDMs Time of cloud clearing for eye appearance in satellite Could add (eventually) from f-decks: – Subjective Dvorak (eye definition) – Objective Dvorak (temp of eye, temp of surrounding cloud tops, eye scene) – Microwave (rain rate, wind radii) – Radar (eye shape, eye wall coverage, concentricity radial winds, cloud height max, rain rate, trend of size and presentation) – Aircraft – Dropsonde Would really like: – Eye slope – Radial distribution of latent heating with respect to the RMW
 – Full suite of VDM including many common remarks (over 100 variables) – My additions from subjective analysis of imagery: Time of low level convective ring observed in microwave Time of first eye mention in VDMs Time of cloud clearing for eye appearance in satellite Could add (eventually) from f-decks: – Subjective Dvorak (eye definition) – Objective Dvorak (temp of eye, temp of surrounding cloud tops, eye scene) – Microwave (rain rate, wind radii) – Radar (eye shape, eye wall coverage, concentricity radial winds, cloud height max, rain rate, trend of size and presentation) – Aircraft – Dropsonde Would really like: – Eye slope – Radial distribution of latent heating with respect to the RMW")
16
Advantages and uses of this dataset Provides a standardized vehicle for aggregating all the varied structure and intensity data Will allow real-time graphical representation of storm structure and intensity evolution for forecasters and field-campaigns Supports intensity/structure research – Eye formation and intensity – Secondary eye formation – Warm core strength, hub clouds – Provides a “roadmap” for further investigation with the full flight level data (warm rings) Supports prediction efforts with simplified theoretical models (i.e. geopotential tendency equation or intermediate complexity) Supports statistical-dynamical prediction methods (e.g. SHIPS) Data assimilation of inner core structure/thermodynamics for WRF/COAMPS/GFDL??
 Supports statistical-dynamical prediction methods (e.g. SHIPS) Data assimilation of inner core structure/thermodynamics for WRF/COAMPS/GFDL .")
17
From Piech (2007)
")
19
Using thermodynamic data in conjunction with the Sawyer-Eliassen transverse circulation equation From Piech (2007)
")
20
Wish List for Future VDM Observables and Quantities Note presence of: – hub cloud – eye moat (% of ocean visible in eye) – eyewall sheath/veil of mist – mesovortices – eyewall striations Characterize cloudiness in eye – cloudiness above eye – cloud tops below Characterize eyewall slope (visually, or from vertical and nadir LIDAR/tail radar) – Vertical, overhanging, shallow, stair-step Outer moat thermodynamics and kinematics – Moat width – Minimum flight level wind between inner and outer maxima – Maximum T/Td in moat region
 – eyewall sheath/veil of mist – mesovortices – eyewall striations Characterize cloudiness in eye – cloudiness above eye – cloud tops below Characterize eyewall slope (visually, or from vertical and nadir LIDAR/tail radar) – Vertical, overhanging, shallow, stair-step Outer moat thermodynamics and kinematics – Moat width – Minimum flight level wind between inner and outer maxima – Maximum T/Td in moat region")
21
Comments and Questions

22
Temperature Tendency at r = 0

23
Temperature Tendency at r = r h

Similar presentations


 by Altug Aksoy (NOAA/AOML/HRD) HEDAS retrospective/real-time analyses have been performed for the years 2008-2011.>")


 and the Tropic of Capricorn (23.5S) The weather is very different.>")

 Kay Shelton University at Albany, SUNY.>")


