Download presentation
Presentation is loading. Please wait.

1
Mr DC Powels (Naamsa President and VWSA Managing Director)
")
2
2 The Vision for the Year 2020 under the new Automotive Production Development Program (APDP) and it’s impact on the Automotive Industry Car Conference 12 th October 2011
 and it’s impact on the Automotive Industry Car Conference 12 th October 2011")
3
Overview 1.SA Auto Industry in the Global Context 2.The importance of stable Government Policy for the Auto Sector 3.Reflection on achievements from the MIDP Program 4.Automotive Production Development Program (APDP) 5.Roadmap
 5.Roadmap")
4
Overview 1.SA Auto Industry in the Global Context 2.The importance of stable Government Policy for the Auto Sector 3.Reflection on achievements from the MIDP Program 4.Automotive Production Development Program (APDP) 5.Roadmap
 5.Roadmap")
5
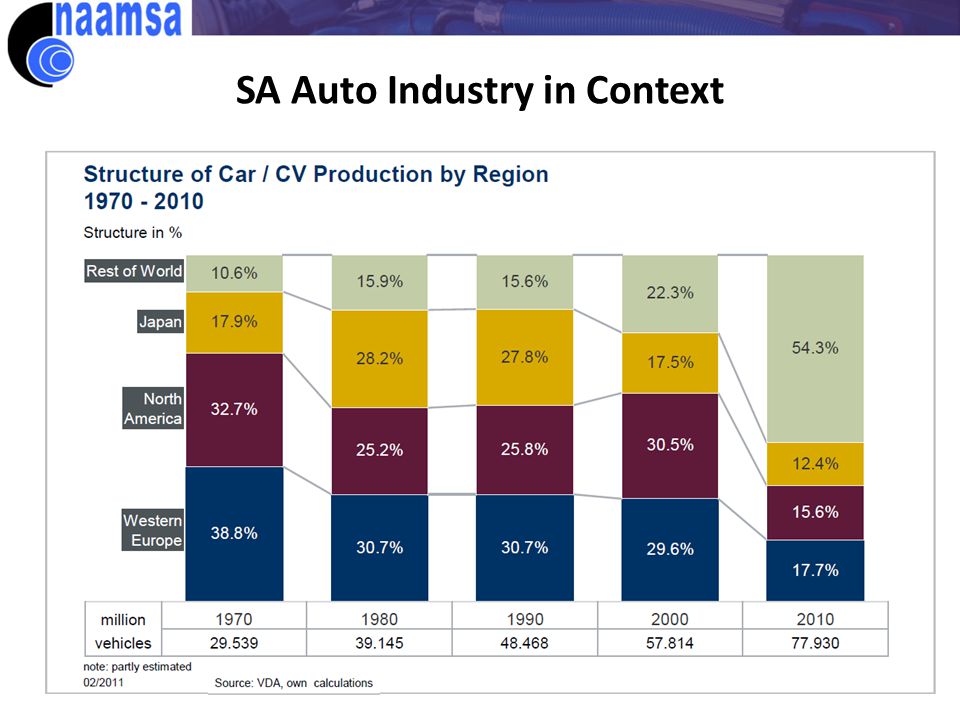
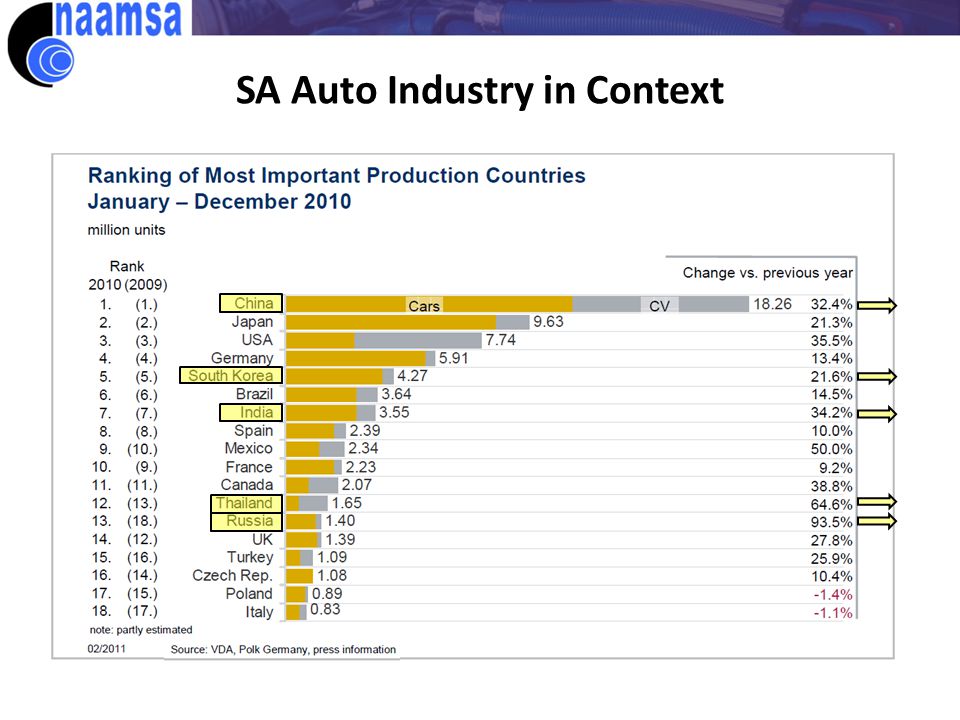
SA Auto Industry in Context

8
Year200820092010 Global vehicle Production 70.52 Mio61.7 Mio77.9 Mio SA vehicle Production0.563 Mio0.374 Mio0.472 Mio SA share of Global Production 0.8%0.61% SA Auto Production vs Global Production

9
SA Auto Industry in Context Auto exports as % of total exports Year199520002007200820092010 Total SA Exports (R Billion) 102.1210.4494.4656.0515.4584 Total Automotive Exports (R Billion) 4.223.467.694.261.069.5 Automotive exports as a % of total SA exports 4.1%11.1%13.7%14.4%11.8%11.9%
 Total Automotive Exports (R Billion) Automotive exports as a % of total SA exports 4.1%11.1%13.7%14.4%11.8%11.9%")
10
Overview 1.SA Auto Industry in the Global Context 2.The importance of stable Government Policy for the Auto Sector 3.Reflection on achievements from the MIDP Program 4.Automotive Production Development Program (APDP) 5.Roadmap
 5.Roadmap")
11
The importance of consistency and certainty in Government Policy for the Auto Industry Phase 6 Local Content Programme Motor Industry Development Programme (MIDP) Automotive Production Development Plan (APDP) 1989 – 1994 1995 – 2012 2013 – 2020 1989202020102000
 Automotive Production Development Plan (APDP) 1989 – – –")
12
Overview 1.SA Auto Industry in the Global Context 2.The importance of stable Government Policy for the Auto Sector 3.Reflection on achievements from the MIDP Program 4.Automotive Production Development Program (APDP) 5.Roadmap
 5.Roadmap")
13
Development of Competition in SA Passenger Car Market Brands & Models: 1994 to October 2011 Oct 2011 60 Brands 1,309 models 26% Import Duty January 1994 17 Brands 192 Models 115% Import Duty

14
SA Automotive Industry Development of FBU export volume - units -38% 26%37%

15
SA Automotive Industry Development of Component Exports - R Bio -37% 12% 10%

16
SA Automakers (7 Car and 2 Truck Producers) New Investments R Bio Total (1995 – 2011FC) = R42.3 Bio Total = R4.5 Bio Total = R10.7 Bio Total = R18.7 Bio Total = R8.5 Bio
 New Investments R Bio Total (1995 – 2011FC) = R42.3 Bio Total = R4.5 Bio Total = R10.7 Bio Total = R18.7 Bio Total = R8.5 Bio")
17
Rationalisation of Platforms in the SA Auto Industry OEMPre 199520102011 (projected) BMW411 Fiat2Ceased in 2008- GM322 Ford931 MBSA522 Nissan732 VW522 Toyota622 Total411512
 BMW411 Fiat2Ceased in GM322 Ford931 MBSA522 Nissan732 VW522 Toyota622 Total411512")
18
SA Pass. & LCV Market 1950 to 2011 LCVPassenger 91% - 45% 41%

19
Growth in Auto Industry SA vs Global YearGlobal Production (Mio units) SA Production (Mio units) SA Exports (Mio units) SA Component Exports (R Bio) 200057.80.3570.06812.6 2011 FC780.5660.30136 % Growth3559343186
 SA Production (Mio units) SA Exports (Mio units) SA Component Exports (R Bio) FC % Growth")
20
Overview 1.SA Auto Industry in the Global Context 2.The importance of stable Government Policy for the Auto Sector 3.Reflection on achievements from the MIDP Program 4.Automotive Production Development Program (APDP) 5.Roadmap
 5.Roadmap")
21
Objectives of the APDP Production increase to 1.2 million vehicles per annum by 2020 with associated deepening of the components industry. Provide appropriate levels of support for these ambitious targets. Achieve better balance between domestic and export sales to supply growing domestic demand. Ensure consistency with WTO rules.

22
Structure of the APDP The APDP consists out of 4 pillars that will drive the programme: 1.Import Duty 2.Vehicle Assembly Allowance (VAA) 3.Production Incentive (PI) 4.Automotive Investment Scheme (AIS) APDP Import Duty taxation Vehicle Assembly Allowance Production Incentive Automotive Investment Scheme Duty Rebate Mechanisms Cash Grants 1234
 3.Production Incentive (PI) 4.Automotive Investment Scheme (AIS) APDP Import Duty taxation Vehicle Assembly Allowance Production Incentive Automotive Investment Scheme Duty Rebate Mechanisms Cash Grants 1234")
23
Pillar 1: Import Duty The New APDP will have stable, moderate import tariffs from 2012: 25% for Completely Built Up Vehicles (CBUs). 18% for CBU’s out of Europe via the EU preferential rate. 20% for CKD components used by vehicle assemblers. FBU Import Duty RateCKD Import Duty Rate MIDP APDP MIDP APDP

24
Pillar 2: Vehicle Assembly Allowance (VAA) The Vehicle Assembly Allowance (VAA) will allow vehicle manufacturers with a plant volume of at least 50,000 units per annum to import a percentage of their components duty free. 20% reducing to 18% over 3 years. Introduction in 2013. MIDP APDP

25
Pillar 3: Production Incentives (PI) The Production Incentive will be in the form of a duty credit aimed at raising production value-added: 55% reducing to 50% over 5 years. Value-added = Sales minus Imported Components and Non qualifying Raw materials. Additional 5% for vulnerable sub-sectors. OEM’s accrue the PI Benefit for the parts supplied by component manufacturer Qualifying Raw Materials 25% Standard Value added on raw materials PGM’s Leather Aluminium Steel Stainless steel

26
Pillar 4: Automotive Investment Scheme AIS) The AIS program provides support to light motor vehicle manufacturers and automotive component manufacturers. AIS provides for a taxable Cash Grant of 20% of the qualifying investment in Productive Assets (OEM has / will achieve 50 000 annual production within 3 years). An additional taxable Cash Grant of 5% to 10% is available to projects that are considered as strategic by the DTI and meet specified performance requirements. Project below R 30 mio by light motor vehicle manufacturers and R1 mio by component manufacturers will not qualify. The approved AIS grant is paid over a period of 3 years. The commencement date of the program was 1 st of July 2009 (Retroactive legislation).
. An additional taxable Cash Grant of 5% to 10% is available to projects that are considered as strategic by the DTI and meet specified performance requirements. Project below R 30 mio by light motor vehicle manufacturers and R1 mio by component manufacturers will not qualify. The approved AIS grant is paid over a period of 3 years. The commencement date of the program was 1 st of July 2009 (Retroactive legislation)..")
27
Overview 1.SA Auto Industry in the Global Context 2.The importance of stable Government Policy for the Auto Sector 3.Reflection on achievements from the MIDP Program 4.Automotive Production Development Program (APDP) 5.Roadmap
 5.Roadmap")
28
Legend: Domestic Market only The roadmap towards 1.2 mil vehicles and achieving international competitiveness 2005 2013 350,000 600,000 Local production volume per annum Domestic supply with some global and regional exports MIDP Vulnerable Sectors Light Vehicles MCV / HCV Investment Support IDC AIS Local content Development OtherIPAP 2 APDP 1995

29
ImportedImported in LocalLocal 40% 70-80% Local Content Excl. engine & gearbox Local Content Development

30
Legend: Domestic Market only The roadmap towards 1.2 mil vehicles and achieving international competitiveness 2005 20132020 And Beyond 350,000 600,000 1,200,000 Local production volume per annum Domestic supply with some global and regional exports Enhanced International Competitiveness MIDP Tooling Initiative Beneficiation Strategy Vulnerable Sectors Light Vehicles MCV / HCV Investment Support IDC AIS Local content Development Existing trade Agreements AGOASADCEU OtherIPAP 2 APDP Preferential Procurement APDP 1995

31
Beneficiation Strategy Why is a beneficiation strategy so important? Because in general local raw material costs provide no competitive advantage for local beneficiators as they are internationally priced commodities (LME etc.). NAAMSA endorses the importance of the early introduction of effective beneficiation strategy as a key intervention to establish sustainable long term competitiveness. In particular, reference was made to “developmental pricing” that would support a lower commodity input cost for our Industry. Raw Material cost Imported parts Local parts Operating costs Overheads Typical export part cost make up % 50 100 70
. NAAMSA endorses the importance of the early introduction of effective beneficiation strategy as a key intervention to establish sustainable long term competitiveness. In particular, reference was made to developmental pricing that would support a lower commodity input cost for our Industry. Raw Material cost Imported parts Local parts Operating costs Overheads Typical export part cost make up %")
32
Legend: Domestic Market only The roadmap towards 1.2 mil vehicles and achieving international competitiveness 2005 20132020 And Beyond 350,000 600,000 1,200,000 Local production volume per annum Domestic supply with some global and regional exports Enhanced International Competitiveness MIDP Tooling Initiative Beneficiation Strategy Vulnerable Sectors Light Vehicles MCV / HCV Investment Support IDC AIS Local content Development Existing trade Agreements AGOASADCEU Infrastructure Development Electricity Tariffs OtherIPAP 2 APDP Preferential Procurement APDP 1995

33
% Cumulative Inflation Cost Increases Energy vs CPI (2007 – 2011)
")
34
Legend: Domestic Market only The roadmap towards 1.2 mil vehicles and achieving international competitiveness 2005 20132020 And Beyond 350,000 600,000 1,200,000 Local production volume per annum Domestic supply with some global and regional exports Enhanced International Competitiveness MIDP Tooling Initiative Beneficiation Strategy Vulnerable Sectors Light Vehicles MCV / HCV Investment Support IDC AIS Local content Development Existing trade Agreements AGOASADCEU Infrastructure Development Ports and Rail Electricity Tariffs OtherIPAP 2 APDP Preferential Procurement Labour Industrial stability Productivity APDP 1995

35
Nr of working days lost due to strikes SA vs other Countries Note: Days lost during 2010 for SA = 20.6 Mio Country GDP (Mio USD) 2010 Canada1,574,051 South Africa357,259 France*2,582,527 Spain1,409,946 Britain2,247,455 Ireland204,261 Italy2,055,114 Australia1,235,539 Germany*3,315,643 USA14,657,800 Belgium465,676 Finland239,232 Denmark310,760 Poland468,539 Netherlands783,293 Sweden455,848 Russia1,465,079
 2010 Canada1,574,051 South Africa357,259 France*2,582,527 Spain1,409,946 Britain2,247,455 Ireland204,261 Italy2,055,114 Australia1,235,539 Germany*3,315,643 USA14,657,800 Belgium465,676 Finland239,232 Denmark310,760 Poland468,539 Netherlands783,293 Sweden455,848 Russia1,465,079")
36
Legend: Domestic Market only The roadmap towards 1.2 mil vehicles and achieving international competitiveness 2005 20132020 And Beyond 350,000 600,000 1,200,000 Local production volume per annum Domestic supply with some global and regional exports Enhanced International Competitiveness MIDP Tooling Initiative Beneficiation Strategy Vulnerable Sectors Light Vehicles MCV / HCV Investment Support IDC AIS Local content Development Existing trade Agreements AGOASADCEU Infrastructure Development Ports and Rail Electricity Tariffs OtherIPAP 2 APDP Preferential Procurement Labour Industrial stability Skills / training Productivity APDP Wage Inflation 1995

37
% Cumulative Inflation Cost Increases Wages vs CPI (2007 – 2011)
")
38
Legend: Domestic Market only The roadmap towards 1.2 mil vehicles and achieving international competitiveness 2005 20132020 And Beyond 350,000 600,000 1,200,000 Local production volume per annum Domestic supply with some global and regional exports Enhanced International Competitiveness MIDP Tooling Initiative Beneficiation Strategy Local Content / Global Suppliers Vulnerable Sectors Light Vehicles MCV / HCV Investment Support IDC AIS Local content Development Existing trade Agreements AGOASADCEU Infrastructure Development Ports and Rail Electricity Tariffs New trade agreements Mercusor Africa (SSA) BRIC OtherIPAP 2 APDP Preferential Procurement Labour Industrial stability Skills / training Productivity APDP Wage Inflation 1995
 BRIC OtherIPAP 2 APDP Preferential Procurement Labour Industrial stability Skills / training Productivity APDP Wage Inflation 1995")
39
Exporting to Sub-Saharan Africa

40
Legend: Domestic Market only The roadmap towards 1.2 mil vehicles and achieving international competitiveness 2005 20132020 And Beyond 350,000 600,000 1,200,000 Local production volume per annum Domestic supply with some global and regional exports Enhanced International Competitiveness MIDP Tooling Initiative Beneficiation Strategy Local Content / Global Suppliers Vulnerable Sectors Light Vehicles MCV / HCV Investment Support IDC AIS Local content Development Existing trade Agreements AGOASADCEU Infrastructure Development Ports and Rail Electricity Tariffs New trade agreements Mercusor Africa (SSA) BRIC OtherIPAP 2 Fuel quality APDP Preferential Procurement Labour Industrial stability Skills / training Productivity APDP Wage Inflation 1995
 BRIC OtherIPAP 2 Fuel quality APDP Preferential Procurement Labour Industrial stability Skills / training Productivity APDP Wage Inflation 1995")
41
SA Fuel Quality vs Global Players

42
Legend: Domestic Market only The roadmap towards 1.2 mil vehicles and achieving international competitiveness 2005 20132020 And Beyond 350,000 600,000 1,200,000 Local production volume per annum Domestic supply with some global and regional exports Enhanced International Competitiveness MIDP Tooling Initiative Beneficiation Strategy Local market growth Local Content / Global Suppliers Vulnerable Sectors Light Vehicles MCV / HCV Investment Support IDC AIS Local content Development Existing trade Agreements AGOASADCEU Infrastructure Development Ports and Rail Electricity Tariffs New trade agreements Mercusor Africa (SSA) BRIC OtherIPAP 2 Fuel quality APDP Preferential Procurement Labour Industrial stability Skills / training Productivity APDP Wage Inflation Electric vehicles 1995
 BRIC OtherIPAP 2 Fuel quality APDP Preferential Procurement Labour Industrial stability Skills / training Productivity APDP Wage Inflation Electric vehicles 1995")
43
Passenger and LCV Market in SA Annual Local Market increase required until 2020 = 8.9% Units

Similar presentations


 on the South African Automotive Sector Evans.>")


 “European R&D Benchmarking (2002)” Science, Technology and Innovation Policy Student Presentations Students: Miguel.>")

 Germany To which country does the UK export the most.>")


