Download presentation
Presentation is loading. Please wait.

1
Biofuel Energy Trends and Opportunities Dr. Cole R. Gustafson Dept. of Agribusiness North Dakota State University 1 cole.gustafson@ndsu.edu

2
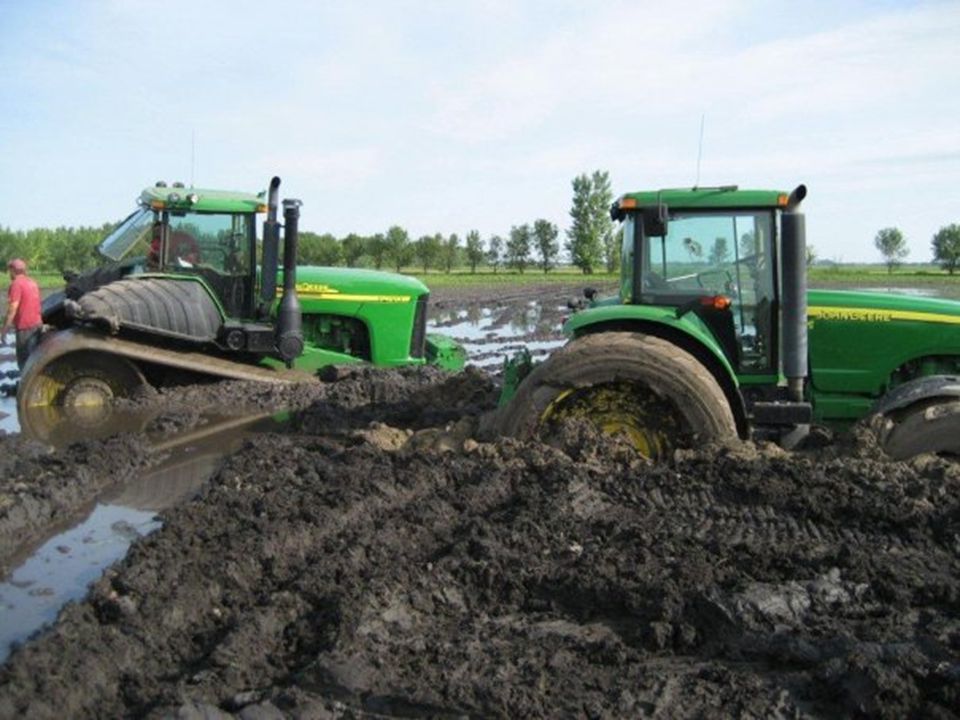
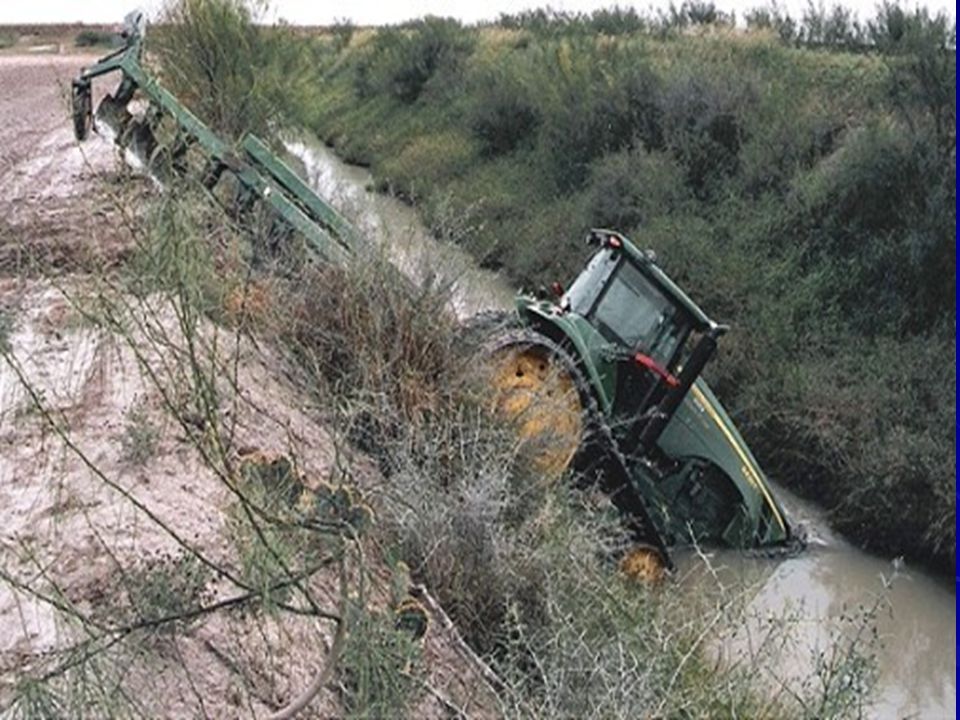
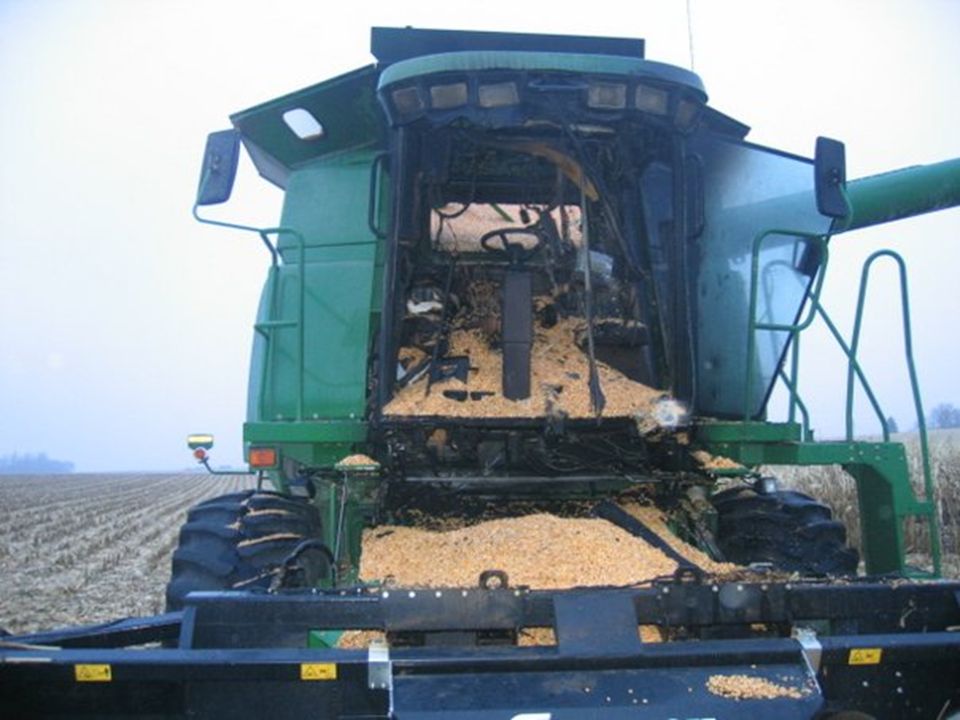
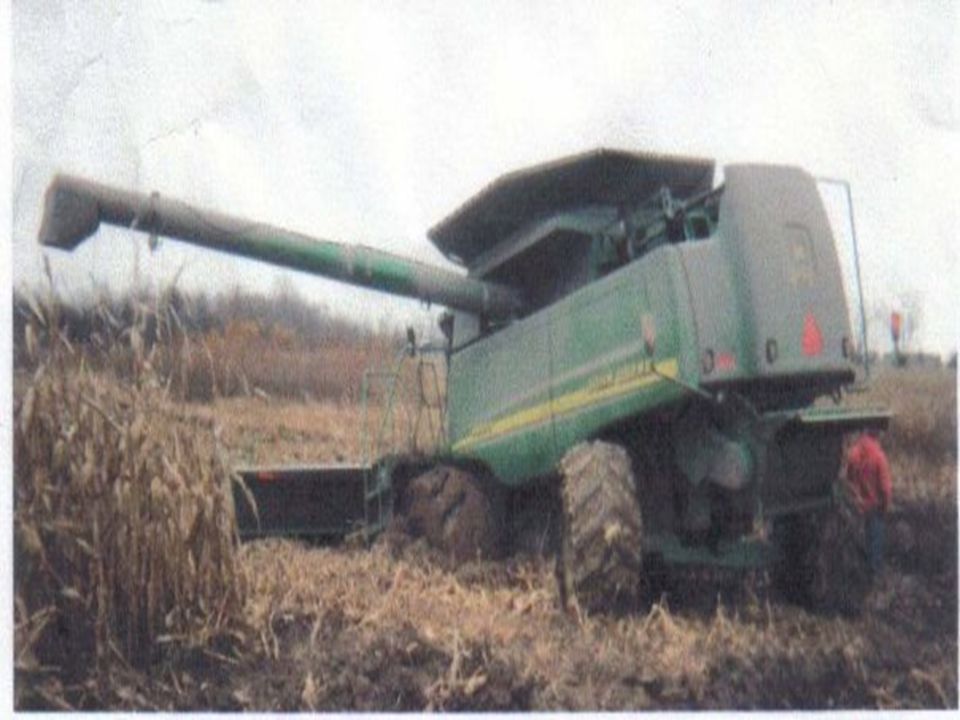
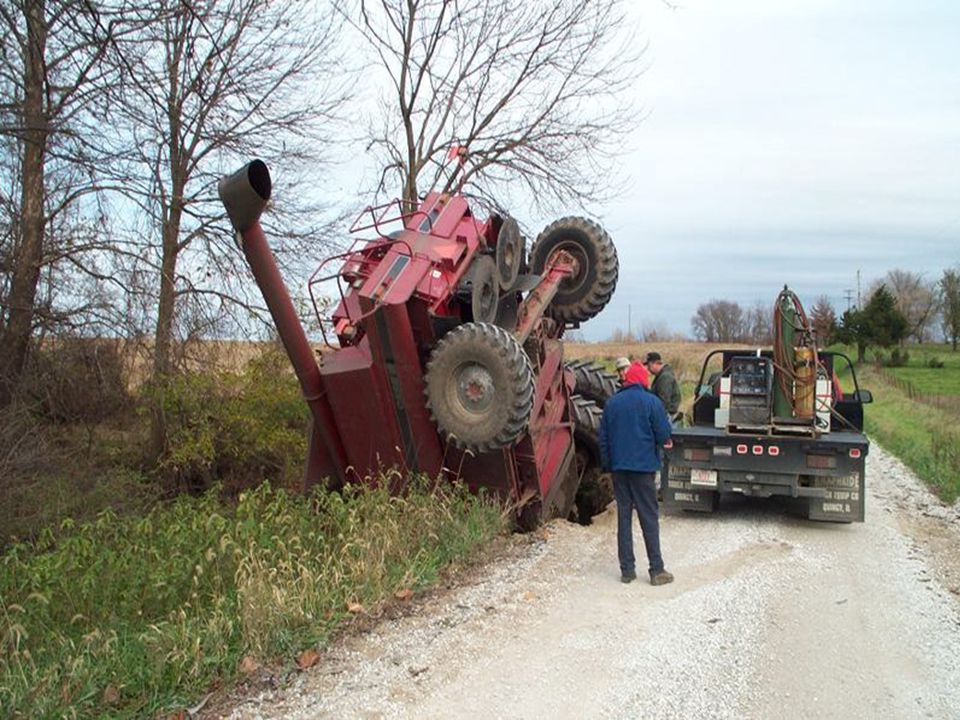
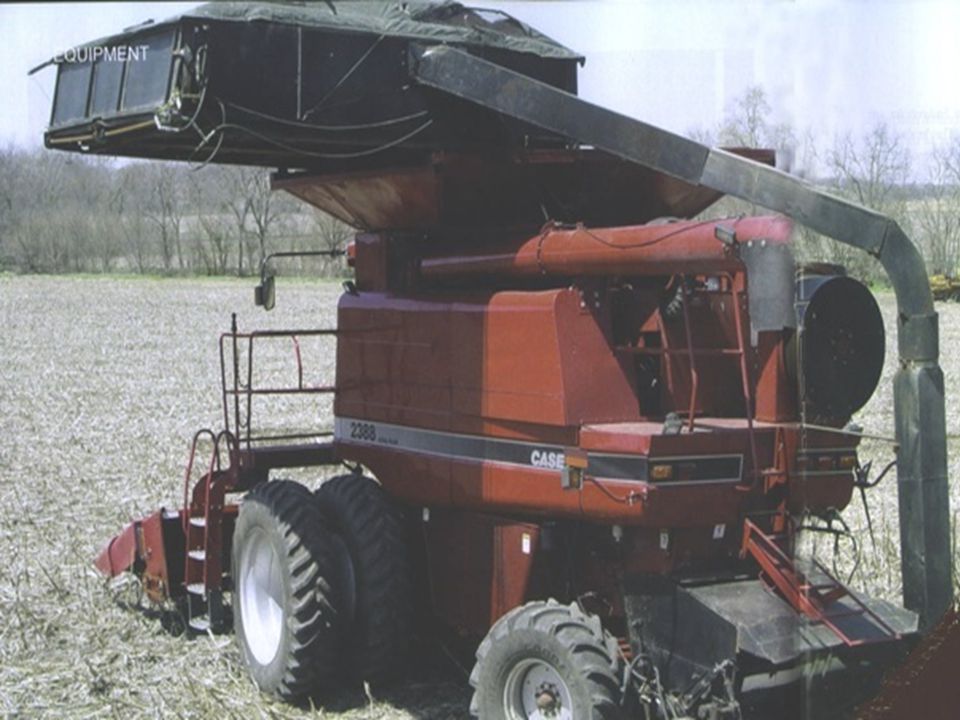
The Challenge of Raising Corn in New Areas

10
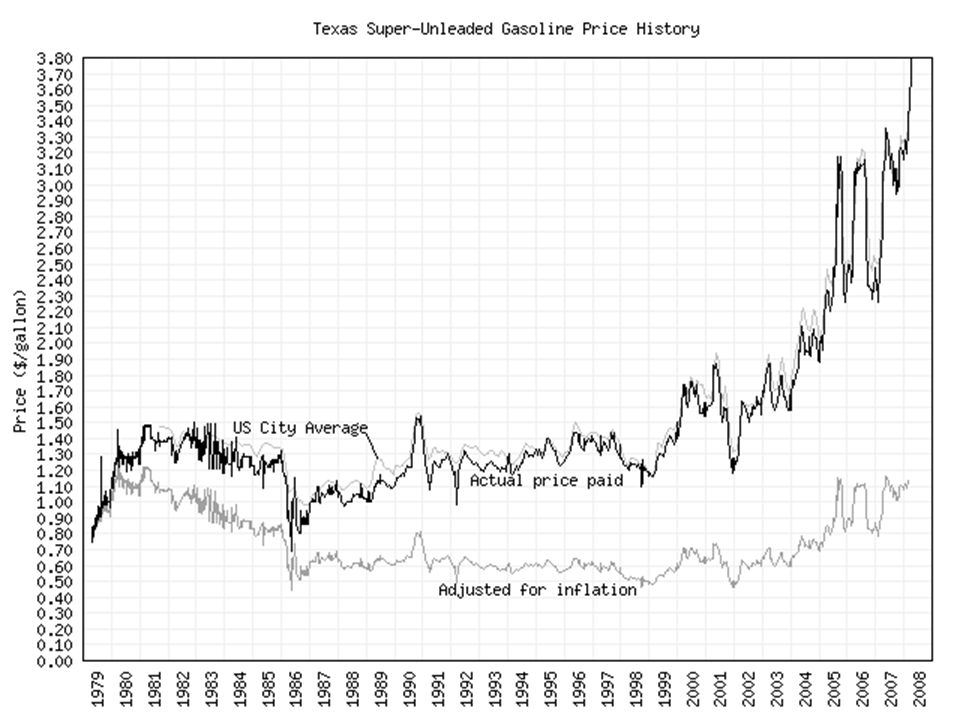
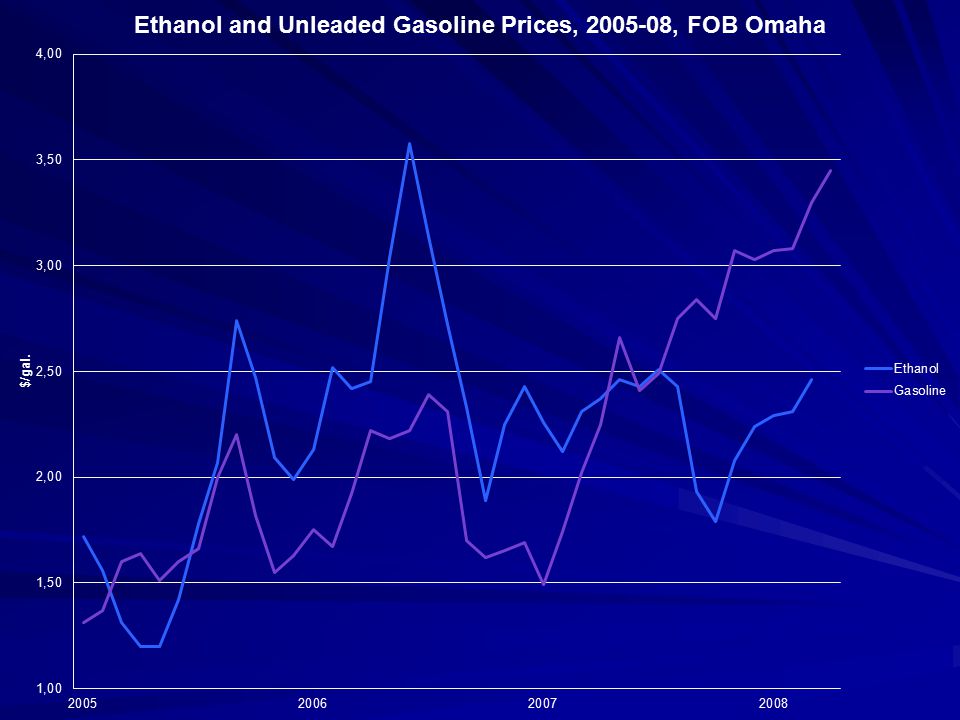
Reasons for Gasoline Price Increase Reduced refining capacity

11
Minn pipeline

12
U.S. Oil Supplied by 34” Enbridge Pipeline? 3%5%10%15%

13
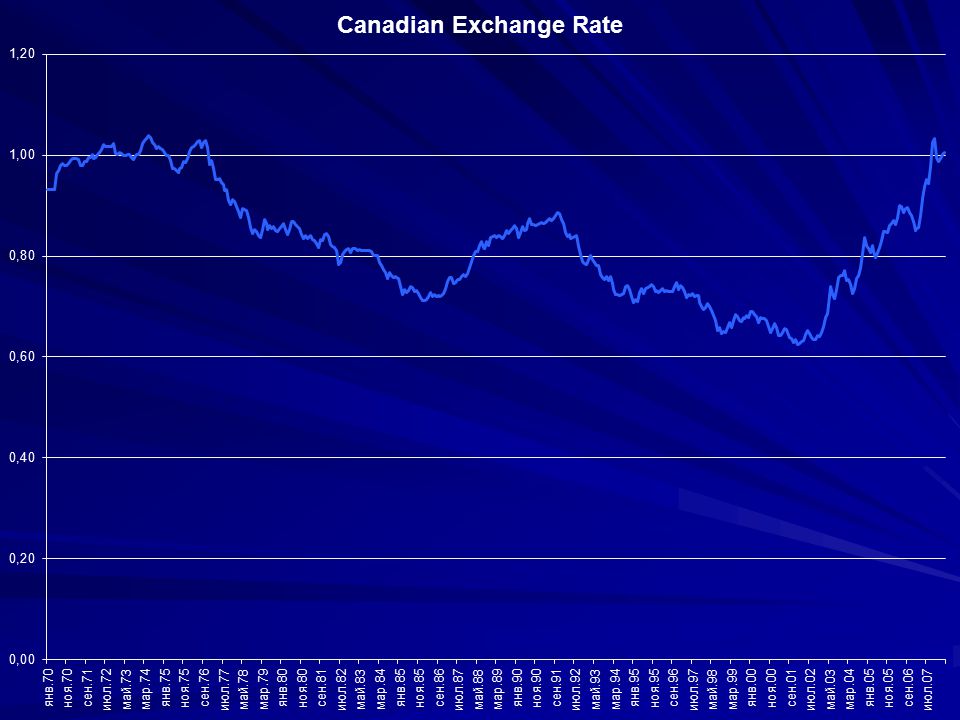
Reasons for Gasoline Price Increase Reduced refining capacity Rising prices have not curbed demand Boutique fuel blends Exchange Rates

16
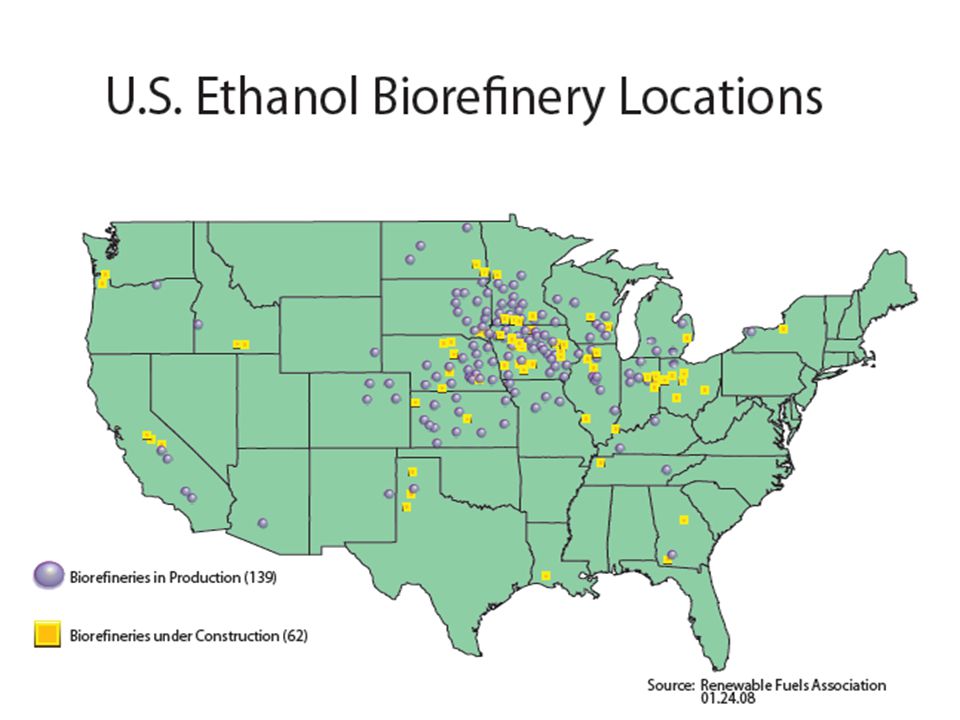
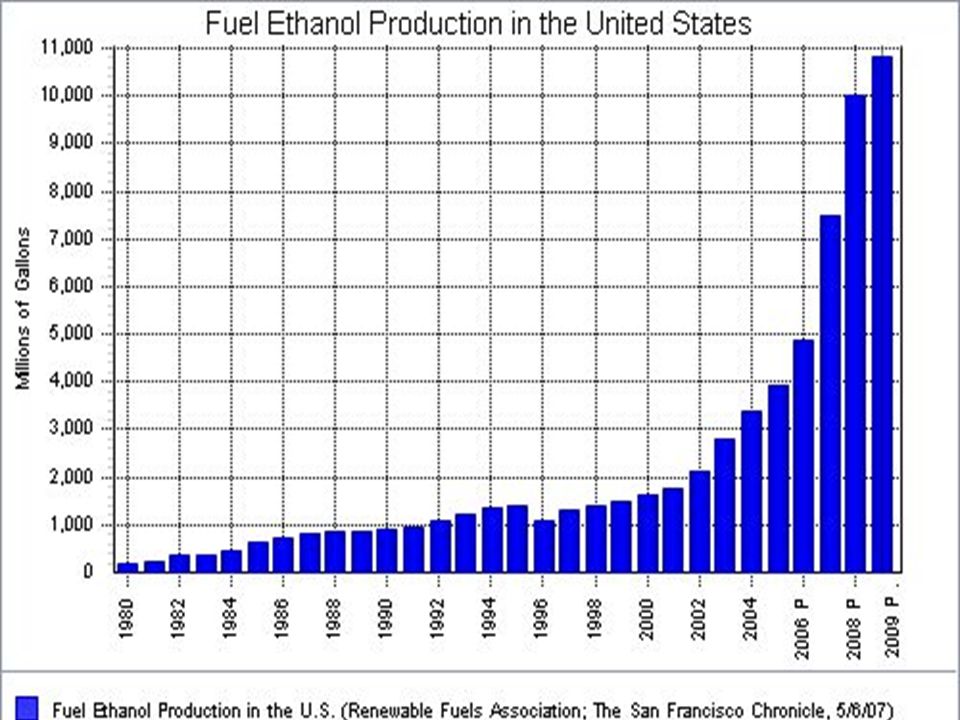
Rapid Historical Investment Renewable Fuel Standard motivated industry expansion (Tax credits, import tariffs, blend mandate) Favorable gasoline/corn price ratio provided high returns on investment –High investment returns enabled plants to pay high prices for corn –$3 billion of investment capital flowed into agriculture sector –External investment has rural development implications
 Favorable gasoline/corn price ratio provided high returns on investment –High investment returns enabled plants to pay high prices for corn –$3 billion of investment capital flowed into agriculture sector –External investment has rural development implications")
17
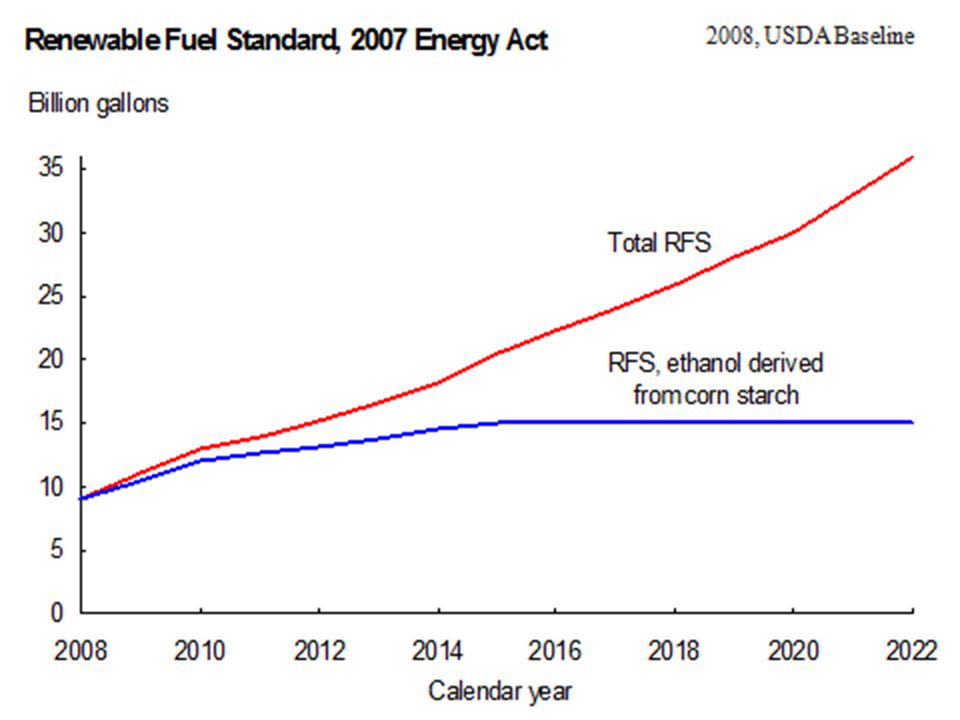
Energy Independence and Security Act of 2007 36 billion gals. ethanol by 2022 Of this, 21 billion from cellulosic

18
YearConventional Biofuel Advanced Biofuel Cellulosic Biofuel Biomass- based Diesel 20089.0 200910.50.600.5 201012.00.950.100.7 201112.61.350.250.8 201213.22.000.501.0 201313.82.751.00* 201414.43.751.75* 2015-202215.05.50-21.03.00-16.0*

19
Imported Sugar/Ethanol -ApexBrasil/Unica, $10 million promotion campaign -Grupo Santos, $12 billion, 60 sugarcane plants -BP, $60 million sugar to ethanol, Gaois, Brazil -NAFTA, Jan. 2008, Mexican Sugar Tariff Removed EP Overview 3/3/08

23
Ethanol Plant Ownership Current Plants –47 percent of plants are farmer owned –39 percent of production from farmer owned Plants under Construction –12 percent of plants are farmer owned –11 percent of production farmer owned – (1 percent ownership loss => 1 less local job)
")
25
Estimated Ethanol Production Costs for New Construction 0% Return on Equity12% Return on Equity Corn Price $/bu. 60 Million Gal./Year $/gal. 120 Million Gal./Year $/gal. 60 Million Gal./Year $/gal. 120 Million Gal./Year $/gal. 2.001.191.141.321.24 3.001.441.401.571.49 4.001.701.661.831.75 5.001.961.912.082.00 6.002.212.162.342.25 Vern Eidman, 2007

26
What an Average Ethanol Plant Can Pay for Corn… Ethanol Price And cover variable costs And cover variable costs plus int., dep., & taxes $1.85/gal. DDG prices stable DDG prices stable$4.50$3.55 $1.85/gal DDG prices rise DDG prices rise$5.50$4.15 $2.35/gal $7.50$6.10 Source: Keith Collins, USDA

27
Investment Climate Has Cooled Rising price of corn and supply uncertainty Construction costs have risen Tax credits are not certain New concerns about environmental impact, resource demands (water), and product quality Investment portfolios of lenders becoming saturated Federal loan programs do not align with scale of new plants New biomass technology may render existing corn plant technologies less profitable
, and product quality Investment portfolios of lenders becoming saturated Federal loan programs do not align with scale of new plants New biomass technology may render existing corn plant technologies less profitable")
28
New Biomass Plants Abengoa Energy, Chesterfield, MO - $76m - corn, wheat, milo ALICO, LaBelle, FL - $33m - yard, wood, energycane BlueFire Ethanol, Irvine, CA - $40m - green/wood waste Poet, Sioux Falls, SD - $80m - corn fiber Iogen, Shelley, ID - $80m - wheat, barley straw Range Fuels, Soperton, CA - $76m – wood ICM, Colwich, KS - $30m – agri. waste Lignol Innovations, Berwyn, PA - $30m – wood residues Pacific Ethanol, Sacramento, CA - $24m – agri./forest Stora Enso, Wisconsin Rapids, WI - $30m – wood waste Aebiofuels, Butte, MT

30
New Ethanol Technology Fractionation –Endosperm, 82% of kernel, 86% starch –Germ, 10% of kernel, 80% oil –Pericarp, 8% of kernel, gasify Gasification of distillers grains Fluid Bed Technology

31
Energy Out/ Fossil Energy Input %GHG Reduction vs. Gasoline/Diesel Gasoline0.81 Ethanol (corn grain) 1.25-1.3512-26 Ethanol (cellulose) 10.082-85 Diesel0.83 Biodiesel (soybean oil) 1.93-3.2141-78 Energy Balance and Greenhouse Gas Impacts of Ethanol and Biodiesel
 Ethanol (cellulose) Diesel0.83 Biodiesel (soybean oil) Energy Balance and Greenhouse Gas Impacts of Ethanol and Biodiesel.")
32
Ethanol’s Impact on Greenhouse Gases Gov. Schwarzenegger (1/9/07) signed "low- carbon fuel standard” to reduce the carbon intensity of transportation fuels by at least 10 percent by 2020.
 signed low- carbon fuel standard to reduce the carbon intensity of transportation fuels by at least 10 percent by")
33
Plevin, 2007

34
Questions ?

Similar presentations