Download presentation
Presentation is loading. Please wait.

1
Ch. 10 Replenishable but Depletable Resources: Water

2
Introduction How do economic and political institutions influence efficient water use? Politics plays a big role: “Grapes of Wrath,” by John Steinback “Chinatown” – movie “Milagro Beanfield War” - movie How do we determine the efficient allocation of water among users?

3
Potential for Water Scarcity
Two sources of water: 1) Groundwater- underground aquifers most groundwater cannot be recharged; formed over geologic time; much is overpumped in Texas, the Edwards Aquifer (which is rechargeable) provides San Antonio all of its water in High Plains of Texas & U.S., the Ogallala aquifer (nonrechargeable) supplies all of agriculture. Many are concerned about it depletion. 90% of world’s readily available freshwater is groundwater. Only 2.5% is renewable. 83 billion gallons/day groundwater withdrawals in U.S.
 Groundwater- underground aquifers. most groundwater cannot be recharged; formed over geologic time; much is overpumped. in Texas, the Edwards Aquifer (which is rechargeable) provides San Antonio all of its water. in High Plains of Texas & U.S., the Ogallala aquifer (nonrechargeable) supplies all of agriculture. Many are concerned about it depletion. 90% of world’s readily available freshwater is groundwater. Only 2.5% is renewable. 83 billion gallons/day groundwater withdrawals in U.S.")
4
Potential for Water Scarcity
1) Groundwater- underground aquifers California, Texas, Nebraska, Arkansas, and Florida are largest users of groundwater Surface water withdrawals have been relatively constant but groundwater withdrawals have increased 14% since 1985 in U.S. 1.5 billion people in the world depend on groundwater for drinking supplies. Agriculture is the largest user : worldwide, agriculture accounts for 67% of groundwater withdrawals
 Groundwater- underground aquifers. California, Texas, Nebraska, Arkansas, and Florida are largest users of groundwater. Surface water withdrawals have been relatively constant but groundwater withdrawals have increased 14% since 1985 in U.S. 1.5 billion people in the world depend on groundwater for drinking supplies. Agriculture is the largest user : worldwide, agriculture accounts for 67% of groundwater withdrawals.")
5
Potential for Water Scarcity
2) Surface water- lakes and rivers Fresh surface water withdrawals in U.S. are 262 billion gallons per day (ESTIMATED USE OF WATER IN THE UNITED STATES IN 2000 by Susan S. Hutson, Nancy L. Barber, Joan F. Kenny, Kristin S. Linsey, Deborah S. Lumia, and Molly A. Maupin U.S. Geological Survey Circular 1268, U.S. Department of the Interior, U.S. Geological Survey) See Figure 2 of report
 Surface water- lakes and rivers. Fresh surface water withdrawals in U.S. are 262 billion gallons per day (ESTIMATED USE OF WATER. IN THE UNITED STATES IN 2000 by Susan S. Hutson, Nancy L. Barber, Joan F. Kenny, Kristin S. Linsey, Deborah S. Lumia, and Molly A. Maupin U.S. Geological Survey Circular 1268, U.S. Department of the Interior, U.S. Geological Survey) See Figure 2 of report.")
6
Efficient Allocation of Surface Water
Efficiency requires that marginal net benefits are equalized among users. MNB0 = MNB1 If MNBs are not equal, then a transfer from lower value (MNB) to the higher net benefit (MNB) will improve welfare In Fig. 10.3, during a drought, the efficient allocation would be to not give any water to user 0 and give it all to user 1.
 to the higher net benefit (MNB) will improve welfare. In Fig. 10.3, during a drought, the efficient allocation would be to not give any water to user 0 and give it all to user 1.")
7
Fig. 10.3 Efficient Allocation of Surface Water Price S1 S0
(Dry year) S0 (Wet year) A Marginal Net Benefits are equal MNB1 B Aggregate Marginal Net Benefit MNB0 QB0 QA1= QT1 QA0 Quantity of water QT0
 S0. (Wet year) A. Marginal Net Benefits are equal. MNB1. B. Aggregate Marginal Net Benefit. MNB0. QB0. QA1= QT1. QA0. Quantity of water. QT0.")
8
Efficient Allocation of Ground Water
In many cases, groundwater is a depletable resource. This is similar to rising extraction cost problem in Chapter 7 (Fig. 7.5) Pumping will stop when either: 1)water table is exhausted, or 2)marginal cost of pumping was either greater than the marginal benefit of the water or greater than the marginal cost of acquiring water from another source
 Pumping will stop when either: 1)water table is exhausted, or. 2)marginal cost of pumping was either greater than the marginal benefit of the water or greater than the marginal cost of acquiring water from another source.")
10
Current Allocation System
During the 1700s in the United States, most water was allocated by “riparian rights” to the owner of the land adjacent to the water. This system was satisfactory with small population But, as population grew and moved to the arid West, it did not work well. The system of “Prior Appropriation” was developed-- “first in time--first in right.” Prior appropriation was developed by the miners and farmers who wanted water diverted.

11
Current Allocation System
Before 1860, very little government involvement in water. After 1860, government became more involved in restricting uses of water. Water “belonged” to state. Claimants only had usufructory rights. Since 1902, the federal government has built almost 700 dams to provide water and power to help settle the West.

12
Sources of Inefficiency
1) Restrictions on transfers difficult to equalize marginal net benefits when transfers are restricted. 1) Beneficial use restrictions: must use it or lose it. If you conserved water this proved that you “needed” less. 2) Preferential use restrictions: bureaucrat determines who gets water, not market.
 Restrictions on transfers. difficult to equalize marginal net benefits when transfers are restricted. 1) Beneficial use restrictions: must use it or lose it. If you conserved water this proved that you needed less. 2) Preferential use restrictions: bureaucrat determines who gets water, not market.")
13
Sources of Inefficiency
2) Federal reclamation projects taxpayers pay for projects enjoyed by users, primarily in the West. Natural Resources Defense Council study found that Wetlands Water District in California’s San Joaquin Valley has paid about $10-$12 per acre foot, only a fraction of the fully amortized cost, less than 10%. (Acre foot is the amount of water to flood an acre of level land to a depth of one foot = 325,851 gallons.)
 Federal reclamation projects. taxpayers pay for projects enjoyed by users, primarily in the West. Natural Resources Defense Council study found that Wetlands Water District in California’s San Joaquin Valley has paid about $10-$12 per acre foot, only a fraction of the fully amortized cost, less than 10%. (Acre foot is the amount of water to flood an acre of level land to a depth of one foot = 325,851 gallons.)")
14
Sources of Inefficiency
3) Water Pricing: too low for 2 reasons: a) average costs are used instead of marginal costs b) marginal scarcity rent is not included. Studies of Tucson, Arizona and Honolulu, Hawaii found that price did not include scarcity value of groundwater. 4) Common Property Problem many aquifers can be overpumped by users who face the “use it or lose it” dilemma.
 Water Pricing: too low for 2 reasons: a) average costs are used instead of marginal costs. b) marginal scarcity rent is not included. Studies of Tucson, Arizona and Honolulu, Hawaii found that price did not include scarcity value of groundwater. 4) Common Property Problem. many aquifers can be overpumped by users who face the use it or lose it dilemma.")
15
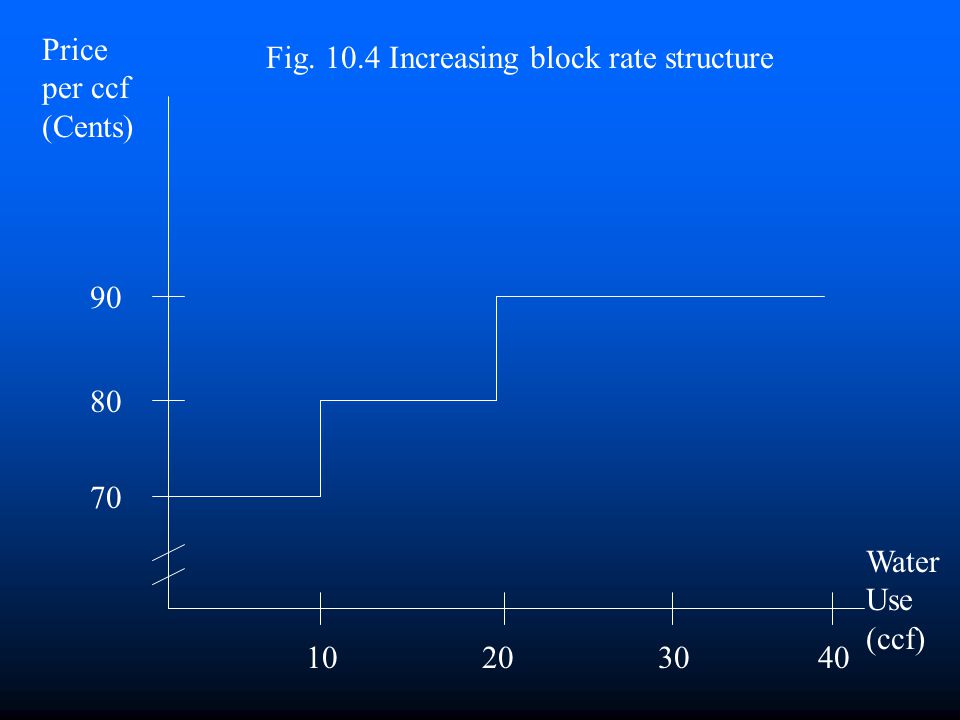
Potential Remedies 1) Eliminate restrictions on transfers. Allow users to reap the benefits of conserving water by allowing them to sell the water they save. 2) Allow instream uses of water to have secure property rights such as fishing, rafting, protection of wildlife. 3) Use increasing block rates to encourage water conservation and to charge the true marginal cost of water. See Fig for different types of variable pricing structures.
 Eliminate restrictions on transfers. Allow users to reap the benefits of conserving water by allowing them to sell the water they save. 2) Allow instream uses of water to have secure property rights such as fishing, rafting, protection of wildlife. 3) Use increasing block rates to encourage water conservation and to charge the true marginal cost of water. See Fig for different types of variable pricing structures.")
16
Price per ccf (Cents) Fig Increasing block rate structure 90 80 70 Water Use (ccf) 10 20 30 40
17
Potential Remedies 3 cont.) many cities have used decreasing block rates in the past. But more are beginning to use increasing block rates, especially in the West. 4) Establish water deeds system Don’t forget the politics of water are powerful. Watch “Chinatown” sometime. You might enjoy reading example 10.4 about Tucson’s water problems (not in 8th edition).
 many cities have used decreasing block rates in the past. But more are beginning to use increasing block rates, especially in the West. 4) Establish water deeds system. Don’t forget the politics of water are powerful. Watch Chinatown sometime. You might enjoy reading example 10.4 about Tucson’s water problems (not in 8th edition).")
Similar presentations