Download presentation
Presentation is loading. Please wait.

1
Injustice, Inequality and the Cuts Danny Dorling, public meeting organized by Equality NW 5 April 2011, 6.30-9pm, Friends Meeting House, Manchester 5 graphs from the book and 5 new pieces of evidence

2
Elitism is believing that just a few children are sufficiently able to be fully educated and only a few of those are then able to govern; the rest must be led – unequal in ‘potential’. ?

3
The tenets of injustice: 1.Elitism is essential – for economic efficiency? 2.Exclusion necessary - the poor will always be with us no matter how rich we are. Because we cannot afford to alleviate poverty?

13
Those of the world’s 25 richest large countries which are in Europe + USA

14
Rich World Inequality League Ratio of the income of the best-off tenth to worse of tenth of households 17.7 Singapore15.9 US15.0 Portugal13.8 UK 13.4 Israel12.5 Australia12.5 New Zealand11.6 Italy 10.3 Spain10.2 Greece9.4 Canada9.4 Ireland 9.2 Netherlands9.1 France9.0 Switzerland8.2 Belgium 8.1 Denmark7.8 S. Korea7.3 Slovenia6.9 Austria 6.9 Germany6.2 Sweden6.1 Norway5.6 Finland 4.5 Japan The 24 richest countries in the world with a population of 1 million+ Source, UNDP world development report 2009, not updated since then.

15
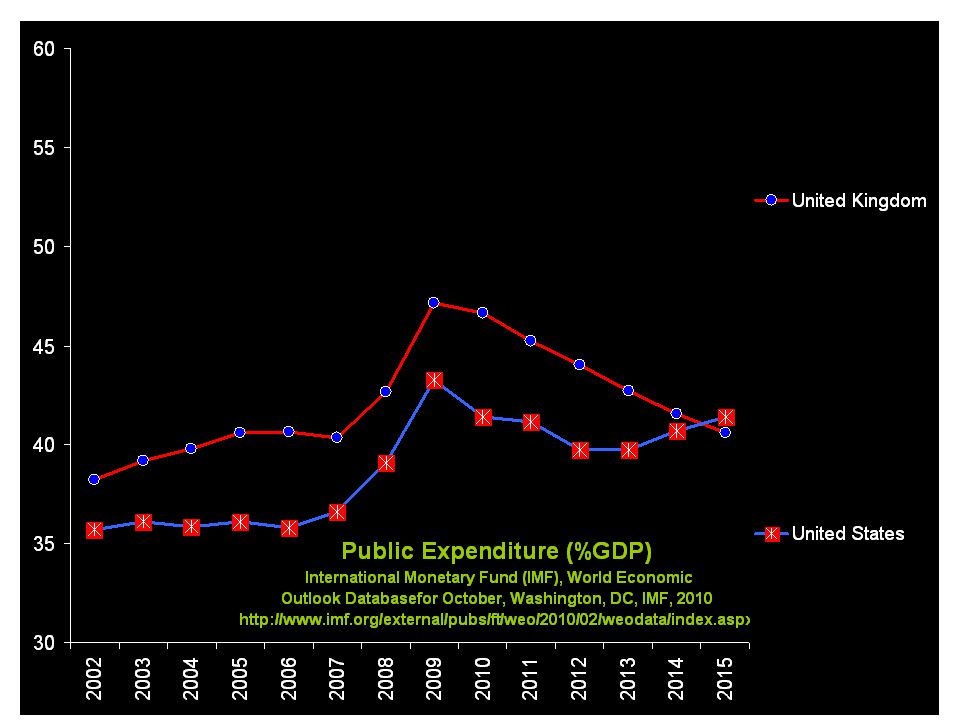
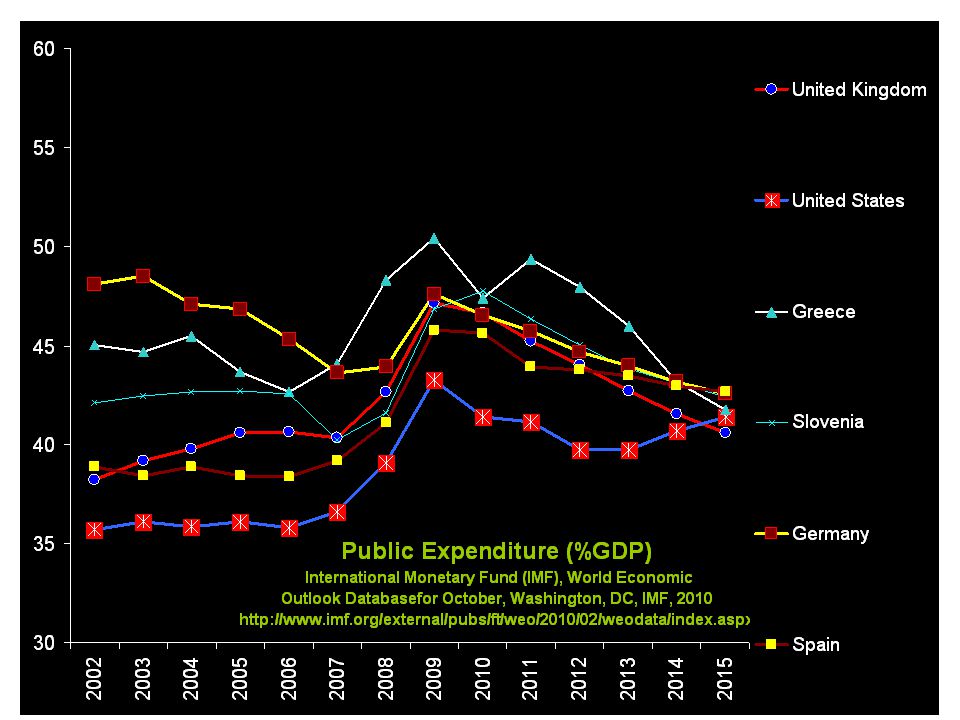
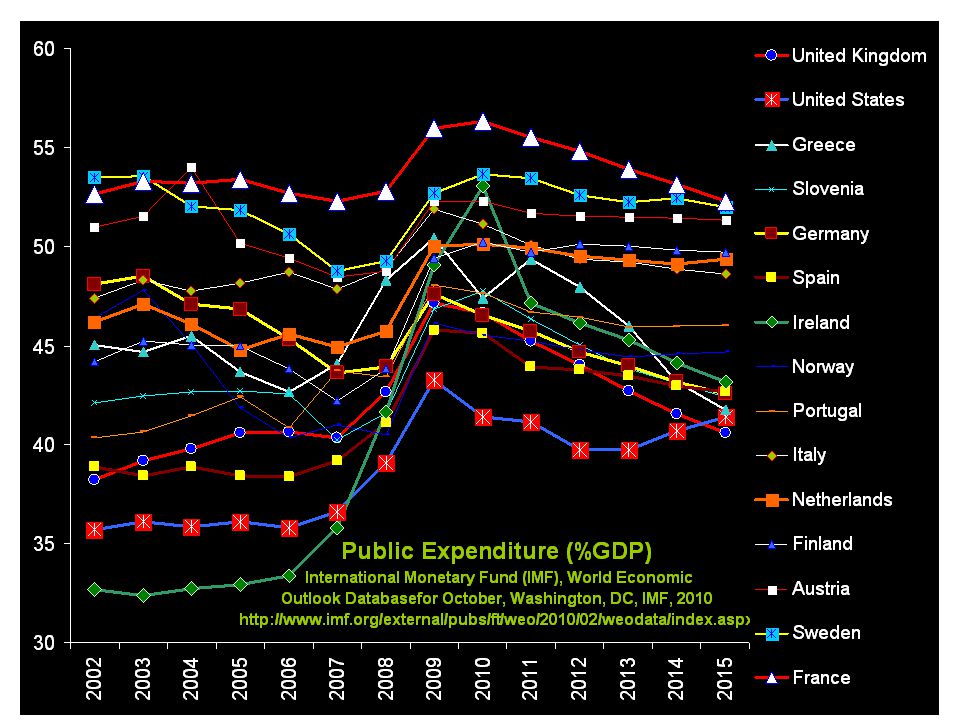
Talk of cuts returning us to ‘2005’ are disingenuous ‘Still’ 3% higher than 2002 by 2015, but much higher unemployment, lower wages so more in-work benefits needed, an aging population so higher health costs, some 51% of women attending university so why not 51% of men, higher school costs, and debt payments to make, and – in 2002, no Iraq war to pay for (‘defence’ up 2% ’01-’05).
.")
16
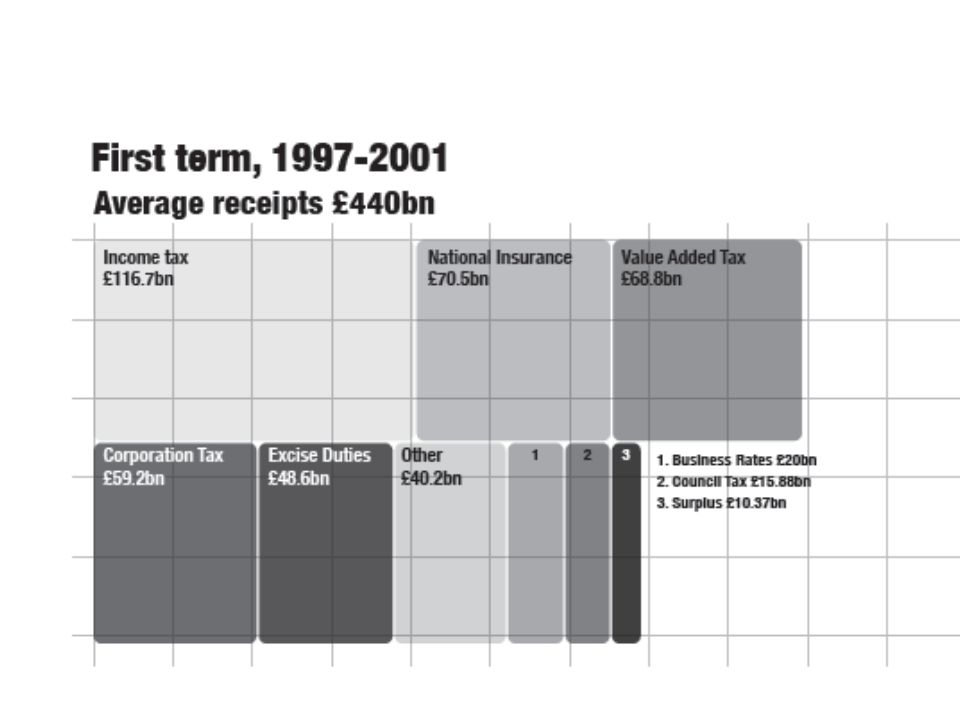
Thanks to Jon Swords for this and next three: http://www.envplan.com/graphics_a.html

18
Three terms: £10bn under, £31bn over (progress), £74bn over (bail-out) £22bn more in 5 years +20bn +£14bn ▼
, £74bn over (bail-out) £22bn more in 5 years +20bn +£14bn ▼")
19
In short. The 1 st Labour government saved money The 2 nd Labour government moved spending towards the European Union norm – but still much lower. The 3 rd Labour government (2005-2010) reduced spending as a % of GDP until the crisis of 2008. Sources – Jon Swords (1997-2008), and IMF
 reduced spending as a % of GDP until the crisis of Sources – Jon Swords ( ), and IMF.")
20
Spot the difference…. 2005 to 2010 Each parliamentary constituency is drawn with its area roughly proportional to its electorate. 2005 results have been projected onto 2010 boundaries.

21
Are we becoming more segregated by voting?

22
Voter segregation now risen for the seventh general election in a row. Only 1918 more segregated than 2010. 2010

23
The tide changed 1968-1974 The rise in electoral segregation has coincided in Britain with the increased acceptance of arguments that suggest some people are worth much more than others. Justifying injustice. In 2010 the Sunday Times Rich List 1000 were each ‘worth’ £335.5 million (+30%). In 2011 the UK billionaire count rose by over 10% …. as did unemployment.
. In 2011 the UK billionaire count rose by over 10% …. as did unemployment..")
24
A small number believe prejudice is natural, greed is good and despair is inevitable… They have come to believe that most others are naturally, perhaps genetically, inferior to them. And many of this small group believe that their friends’ and their own greed is helping the rest of humanity as much as humanity can be helped; they are convinced that to argue against such a counsel of despair is foolhardy.

25
Income inequality has risen – before & after tax lines below are share of the best-off 1% (‘Injustice’) 2011
 2011")
26
Inequalities in health (‘Injustice’). The two lines below are how more often people in the poorest areas die aged under age 65, and how less often those in the best-off areas 2010

27
Rise in anxiety and depression amongst older adolescents in the most unequal affluent countries (source – ‘Injustice’) There was a rapid rise in the number of older school children reporting concerns 2008- 2009 before the government cancelled the ‘TellUs’ survey in summer 2010. How anxious would you be now – if you were age 15 today?

28
Politically it is very hard for the last government to blame this one for rising inequalities. Health Inequalities 1999-2008 (summary): Figure 3. Inequalities in life expectancy between areas in Great Britain 1999–2008 Source: Difference between the best and worst-off districts, 1999–2008 (ONS). But health inequalities may have finally fallen slightly in 2009 between areas. Almost everything that could be done to increase them is occurring now. Especially in housing....
: Figure 3. Inequalities in life expectancy between areas in Great Britain 1999–2008 Source: Difference between the best and worst-off districts, 1999–2008 (ONS). But health inequalities may have finally fallen slightly in 2009 between areas. Almost everything that could be done to increase them is occurring now. Especially in housing.....")
29
Conclusion: The near future really will be very different, because, for at least the last six human generations, the near future has changed radically with each single generation. Don’t despair that there won’t be change. Don’t assume it will be for the better, nor necessarily for the worse. The very least we can do is describe clearly the crux of our present predicament – that much that is currently wrong is widely seen as either inevitable or justifiable. There are many alternatives, elsewhere in the world today, in our past, and in our imaginations and aspirations. Tax the wealthy (reparation), cut what is waste (war), don’t saddle future generations with debt (fees), understand that inequality causes poverty, concertina down incomes in the public sector and for any subcontractor, introduce a ‘right to sell’ to deter housing speculation, stop blaming immigrants – so many alternatives – so where to start?
, cut what is waste (war), don’t saddle future generations with debt (fees), understand that inequality causes poverty, concertina down incomes in the public sector and for any subcontractor, introduce a ‘right to sell’ to deter housing speculation, stop blaming immigrants – so many alternatives – so where to start .")
Similar presentations


 Inequality in Europe and the USA March 28 2014.>")


 Inequality and poverty in Europe and the USA November 11 2010.>")


