Download presentation
Presentation is loading. Please wait.

1
S ECTION 4.1 – T RANSFORMING R ELATIONSHIPS Linear regression using the LSRL is not the only model for describing data. Some data are not best described linearly. In some cases the removal of outliers from data may cause a drop in the correlation so that linear no longer does a satisfactory job of describing the data. In some cases the bulk of the data may not be linear at all. Non-linear relationships between two quantitative variables can sometimes be changed into linear relationships by transforming one or both variables.

2
S ECTION 4.1 – T RANSFORMING R ELATIONSHIPS Transforming can be thought of as re-expressing the data. We may want to transform either the explanatory variable x, or the response variable y in a scatter plot, or maybe even both. We will call the transformed variable " t " when talking about the transforming in general. Many variables take only 0 or positive values, so we are particularly interested in how functions behave for positive values of t.

3
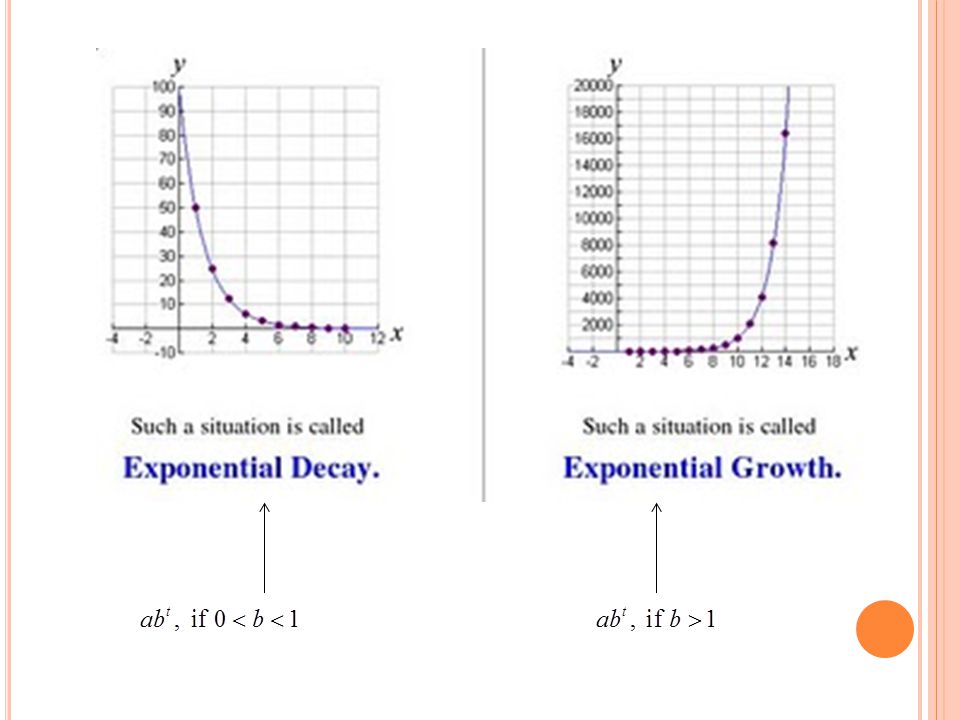
The following models are common functions in which you should be familiar with their shape and equation. These are models in which t > 0.

5
The following scatterplot represents brain weight against body weight for 96 species of mammals.

6
The scatterplot is not very satisfactory since most mammals are so small relative to elephants and hippos The lower left corner of the plot shows that most of the species overlap forming a “blob” The correlation with all 96 species is r =.86, but removing the elephant, r =.50 To get a closer look at the observations that are in the lower-left corner, the 4 outliers were removed

7
This scatterplot represents the 92 observations with the 4 outliers removed. Instead of a linear relationship, you can see that as body weight increases, the graph bends to the right which is representative of a logarithmic function.

8
The following plot includes the original 96 observations, but instead of plotting the y-value against the x -value, the logarithm of the brain weights ( y -value) were plotted against the logarithm of the body weights ( x -value). There are no longer any extreme outliers or very influential observations and the pattern is very linear with r =.96

9
The ladder of power functions is in the form: linear reciprocal square root logarithmic inverse square

10
C ONCAVITY OF P OWER F UNCTIONS

11
E XPONENTIAL G ROWTH

12
T RANSFORMING DATA

13
R EVIEW P ROPERTIES OF L OGARITHMS 13

14
E XAMPLE 1 – G ROWTH OF C ELL P HONE U SE The cell phone industry enjoyed substantial growth in the 1990’s. One way to measure cell phone growth is to look at the number of subscribers. Find a linear model to predict the number of subscribers in the year 2000. Year19901993199419951996199719981999 Subscribers (thousands) 528316,00924,13433,78644,04355,31269,20986,047 There is an increasing trend, but the overall pattern is not linear. The pattern looks like an exponential curve. Is this exponential growth?
 ,00924,13433,78644,04355,31269,20986,047 There is an increasing trend, but the overall pattern is not linear. The pattern looks like an exponential curve. Is this exponential growth .")
15
While the curve may appear to be exponential growth, we can’t simply depend on what our eyes see. If you suspect exponential growth, first calculate the ratios of consecutive terms to see if they are the same fixed percentage of the previous total. To avoid overflow in the calculator it is good practice to code the years (let 1990 = 1) Don’t use 0 since you can’t take the log of 0 E XAMPLE 1 – G ROWTH OF C ELL P HONE U SE YearSubscribersRatioslog(y) 15,283--3.72288 416,009--4.20436 524,1341.514.38263 633,7861.404.52874 744,0431.304.64388 855,3121.264.74282 969,2091.254.84016 1086,0471.244.93474 Means that the # of subscribers in 1994 is 151% of or 1.51 times the # of subscribers in 1993. Could also say that it’s a 51% increase. On average, subscribers were increasing around 35% each year.
 Don’t use 0 since you can’t take the log of 0 E XAMPLE 1 – G ROWTH OF C ELL P HONE U SE YearSubscribersRatioslog(y) 15, , , , , , , , Means that the # of subscribers in 1994 is 151% of or 1.51 times the # of subscribers in Could also say that it’s a 51% increase. On average, subscribers were increasing around 35% each year..")
16
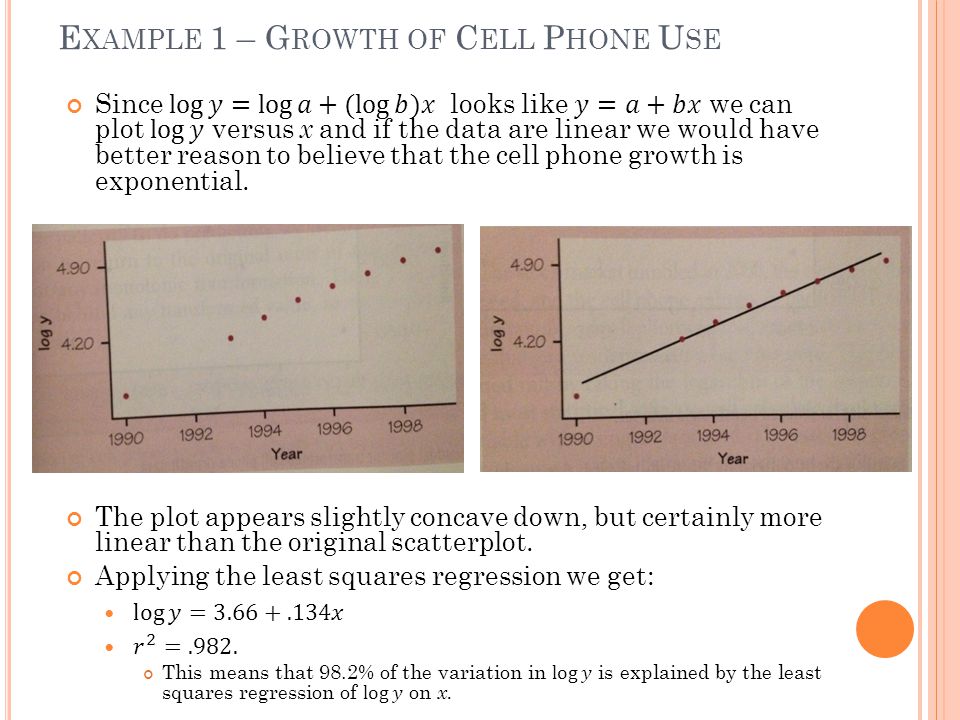
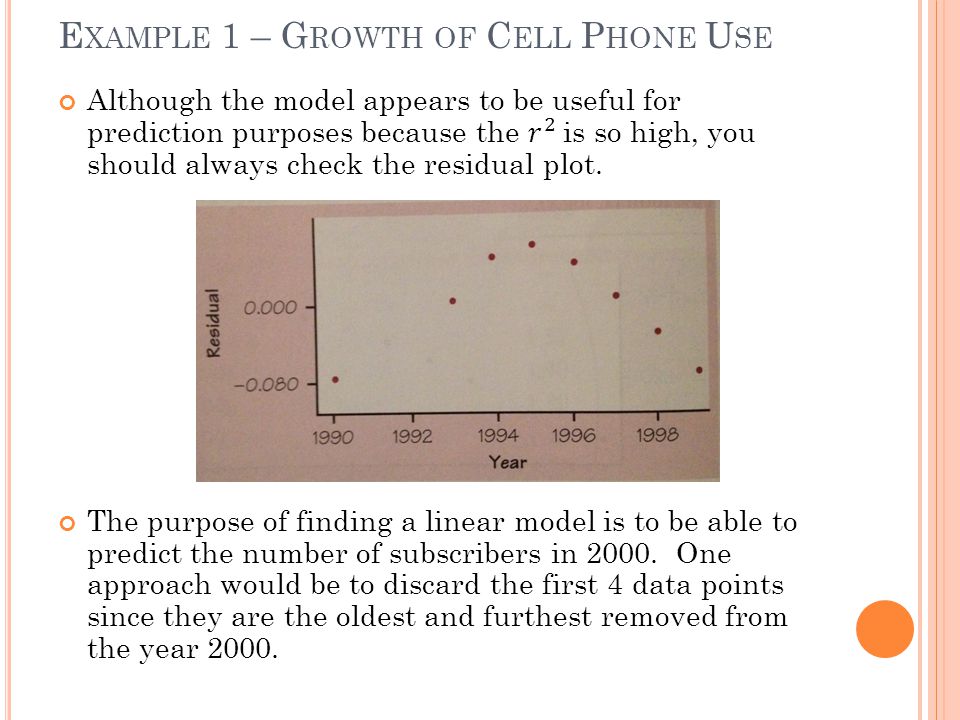
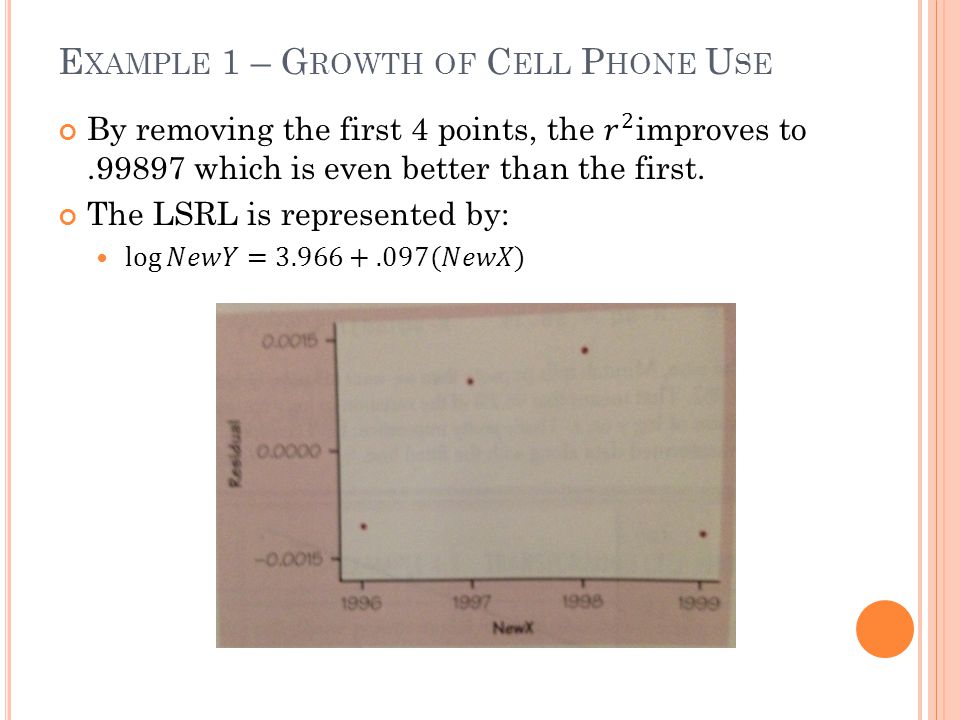
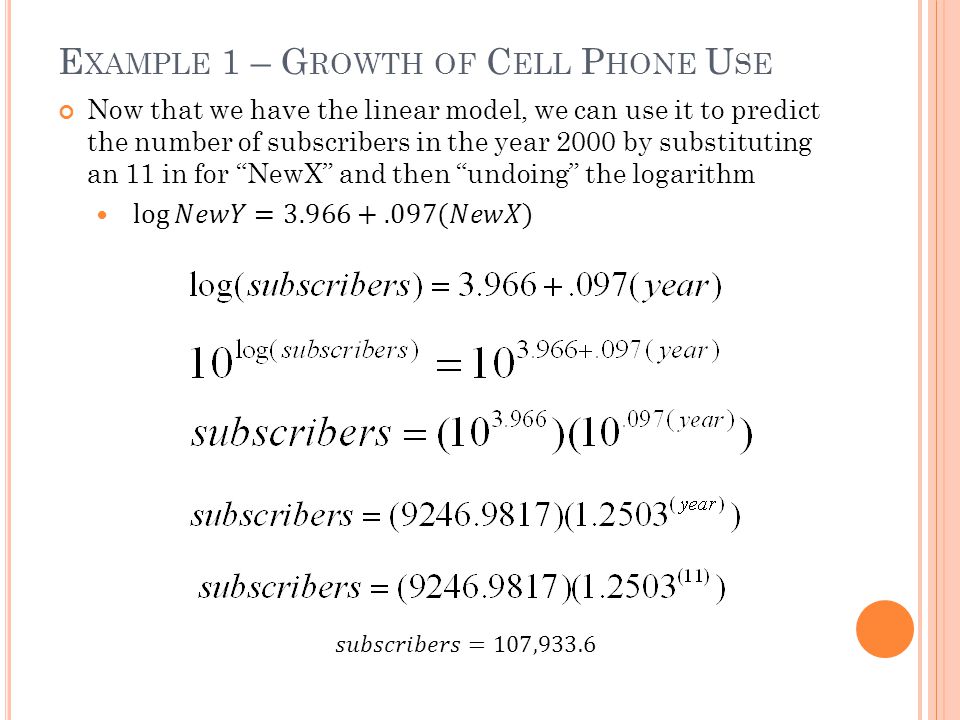
E XAMPLE 1 – G ROWTH OF C ELL P HONE U SE

21
Homework: p.212-213 #’s 6-8

Similar presentations


 data. Tell where y = log(x)>")

 Data.>")

