Download presentation
Presentation is loading. Please wait.

1
Disaster Research Center Jenniffer Santos-Hernández Disaster Research Center University of Delaware Developing Informed Radar Technology: The social dimensions of risk communication This work was supported by the Engineering Research Centers (ERC) Program of the National Science Foundation under NSF Cooperative Agreement No. EEC-0313747. Any opinions, findings and conclusions, or recommendations expressed in this material are those of the authors and do not necessarily reflect those of the National Science Foundation.

2
The CASA Project Inter-disciplinary, Multi-institution research effort ERC Director: Dr. David McLaughlin, UMASS, Amherst Director of Industry, Government, and End User Partnerships: Brenda Phillips Senior Social Science Faculty: Havidán Rodríguez and Walter Díaz Other faculty associated to the DRC-CASA project: William Donner and Joseph Trainor DRC-CASA Graduate students: Jenniffer M. Santos-Hernández DRC-CASA Undergraduate students: Claudia Flores, Paige Mikstas, Yesenia Rodríguez, Spencer Schargorodski, Kathleen Shea, Stephen Shinn, Jasmine Wynn

3
Social Scientists in CASA How improved forecasting can reduce the exposure and vulnerability of individuals and property to every-day and extreme weather events? What factors inform weather related decisions at different levels? How are warnings communicated to the general population? Under what conditions are these warnings interpreted correctly? Through the use of field research, focus groups, in-depth interviews, and surveys, we are examining how the end-user community, particularly emergency managers and the general public, access, interpret, utilize, and respond to weather forecasts Use of both qualitative and quantitative approaches

4
Research Efforts Survey of emergency managers’ access and use of weather information In-depth interviews with emergency managers, weather forecasters, and other emergency management related personnel to understand the processes by which emergency managers acquire, manage, and use weather information (Oklahoma and Puerto Rico) Quick-response research after Hurricane Katrina Quick-response research after tornado warnings Phone Survey on response to tornado warnings Social Vulnerability Index for Puerto Rico Online GIS integrated platform – Disaster Decision Support Tool Evaluation of the implementation of FEMAs CERT program in Puerto Rico
 Quick-response research after Hurricane Katrina Quick-response research after tornado warnings Phone Survey on response to tornado warnings Social Vulnerability Index for Puerto Rico Online GIS integrated platform – Disaster Decision Support Tool Evaluation of the implementation of FEMAs CERT program in Puerto Rico")
5
Objectives – Public Response Phone Survey Explore and describe public response and the household decision making process following a severe weather warning or a hazard event Using Computer Assisted Telephone Interviewing (CATI), explore the public’s response to severe weather warning/events in communities in Oklahoma, Kansas, Minnesota, Illinois, Mississippi, Tennessee and Alabama in 2008 and 2009. Develop quantitative and predictive models, which are based on initial extensive qualitative research with emergency managers and the general public following severe weather events

6
DRC-CATI Deployment Methodology

7
Questionnaire 127 questions in total yielding about 429 variables: Damage to home, business, or other property Shelter availability and preferences Social Vulnerability Social Networks Insurance coverage Effectiveness of Siren Systems Behavioral outcomes of lead time Social and environmental cues Protection of possessions and pets Reception of warnings and watches Understanding of warnings and watches Questions on false alarms Geographic warning specificity Past experience with other disasters

8
Methodology GENESYS Sampling Systems: Genesys provided samples based on DRC sampling requests in the impacted areas Over 600 interviews completed in counties in Oklahoma, Minnesota, Kansas, Illinois, Mississippi, Tennessee and Alabama. Average duration of interviews: 35 minutes Calls were made 1-3 weeks after event

9
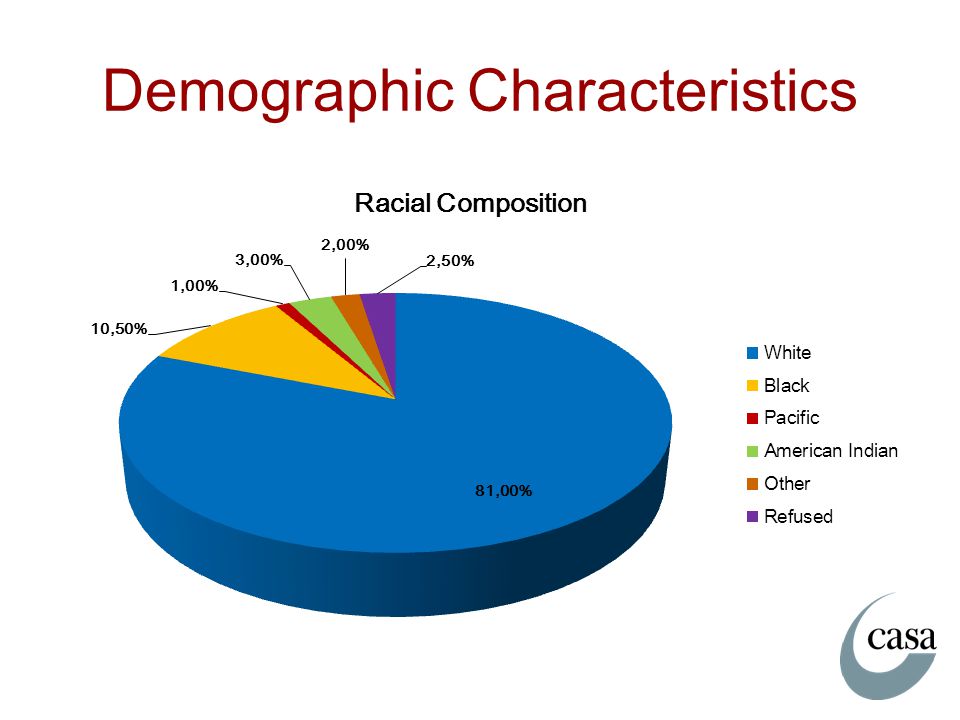
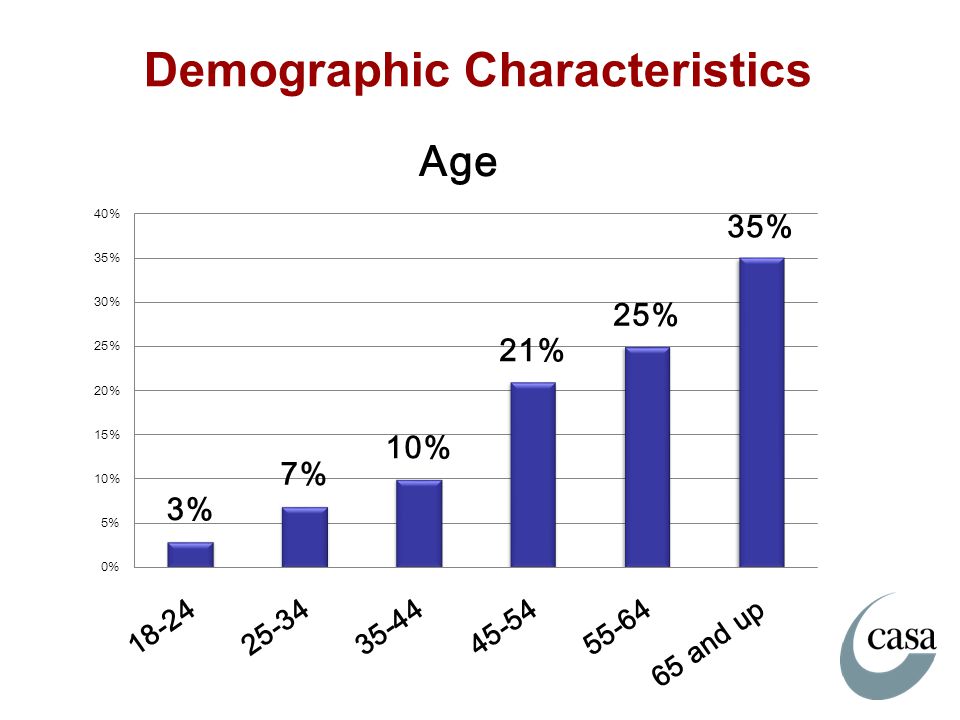
Demographic Characteristics

12
Annual Income

13
Were you aware that a tornado or severe storm had been observed in the surrounding area before it got to your town?

14
Did you receive a warning or notification of a tornado or severe storm in your region?

15
From whom did you receive this information?

17
When you first found out a tornado or severe storm was present inside or near your town or city, about how many minutes did it take before it hit your neighborhood? (Average = 27.9 minutes)
.")
18
Did the tornado sirens in your community go off?

19
Did you look outside to verify whether the tornado or severe storm was coming?

20
Did you receive information from the Internet during the last 30 minutes before the tornado or severe storm arrived?

21
Why did you not receive information from the internet?

22
Did you receive information from television during the last 30 minutes before the tornado or severe storm arrived?

23
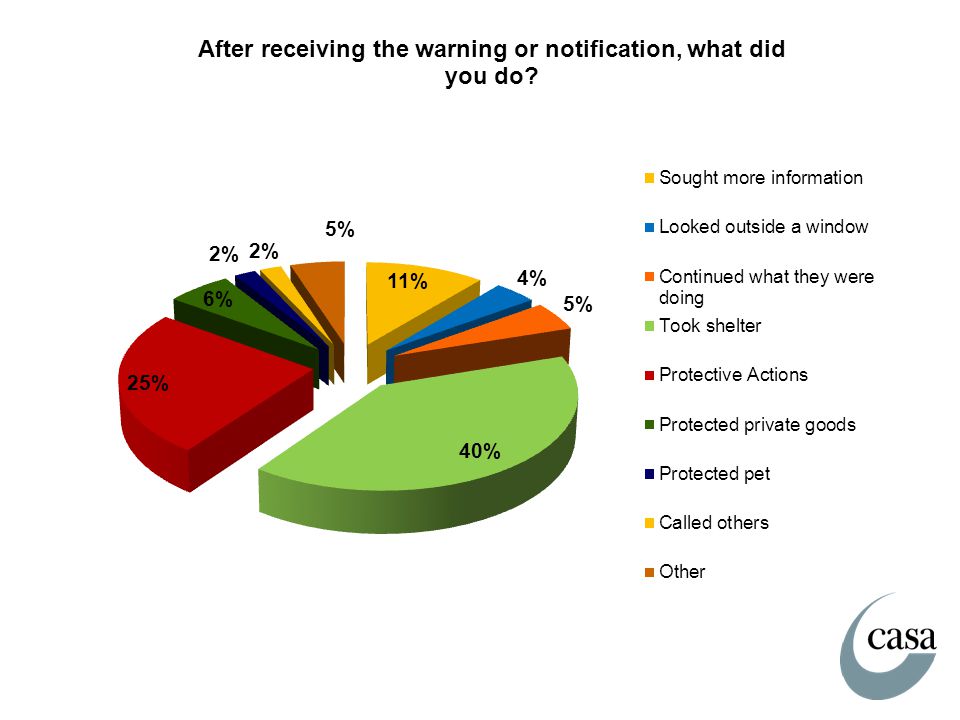
Did you take any actions to protect yourself, your family, or your property from the hazard event?

24
What information led you to seek shelter?

25
NOAA Radio Ownership

26
How often would you say you listen to a NOAA radio for information about tornadoes or severe storms?

27
Tornado Watch & Warning and False Alarms Respondents appear to have difficulty in understanding the differences between watches and warnings and what is a false alarm Participants seem to understand that watches and warnings represent some type of danger, but they are unable to clearly differentiate between these two concepts

28
Watch Definition: Examples “I think the watch is the more dangerous one” “Same as a warning” “When the TV flashes yellow” “They put it up on the TV and tell you what time it will be in your area and when to take shelter” “They feel like there’s one [tornado] in our vicinity” “A tornado is on the ground near your house” “Tornado was been sighted in my area” “Watch for the tornado coming to you”
![Watch Definition: Examples I think the watch is the more dangerous one Same as a warning When the TV flashes yellow They put it up on the TV and tell you what time it will be in your area and when to take shelter They feel like there’s one [tornado] in our vicinity A tornado is on the ground near your house Tornado was been sighted in my area Watch for the tornado coming to you](http://images.slideplayer.com/15/4704460/slides/slide_28.jpg "Watch Definition: Examples I think the watch is the more dangerous one Same as a warning When the TV flashes yellow They put it up on the TV and tell you what time it will be in your area and when to take shelter They feel like there’s one [tornado] in our vicinity A tornado is on the ground near your house Tornado was been sighted in my area Watch for the tornado coming to you")
29
Watch Definition

30
Warning Definition

31
False Alarm Definition

32
In your opinion, how trustworthy are the weather forecasts provided in your region? Not TrustworthyVery Trustworthy

33
Next Steps Continue CATI Survey; expand sample size and geographic areas Develop predictive models on protective action: Binary logistic model to predict protective action following severe weather warning or a hazard event Estimate the probability that the dependent variable will assume a certain value (e.g., take protective action or not) based on a number of independent variables
 based on a number of independent variables")
34
Canon (1994) asserts that technology is not socially neutral and that we must have an understanding of the context in which it is implemented. Technology matters, but what really matters is the application of the substantive knowledge that we generate regarding how individuals respond (or not) to severe weather events and how can we improve their response in order to minimize the devastating impacts associated with these events. Technology and the social dimensions of risk communication
 to severe weather events and how can we improve their response in order to minimize the devastating impacts associated with these events. Technology and the social dimensions of risk communication.")
Similar presentations


 Annual Partnership Topic (APT) Building America’s Resilience to Hurricane Disasters Dr. Timothy Spangler AMS Summer.>")


 Louisiana OHSEP Director’s Meeting.>")


 determines what information managers need and then gathers, sorts, analyzes, stores, and distributes.>")


