Download presentation
Presentation is loading. Please wait.

1
Ismailia 1/2015 1976 1956 MICRONUTRIENT DEFICIENCIES IN PLANTS: THEIR OCCURRENCE IN THE MIDDLE EAST, EFFECTS ON HUMANS AND ANIMALS AND REMEDY STRATEGIES Mohamed M. El-Fouly Fertilization Technology Department (Project: Micronutrients and Plant Nutrition Problems) National Research Centre Cairo – Dokki – Egypt e-mail: nrc-mic@link.net mohelfouly@link.net
 National Research Centre Cairo – Dokki – Egypt")
2
Ismailia 1/2015 1976 1956 Contents Introduction Deficiencies in soils Deficiencies in plants Correction approaches Soil treatment Foliar application Seed treatment Plant breading Conclusions

3
Ismailia 1/2015 1976 1956 Introduction

4
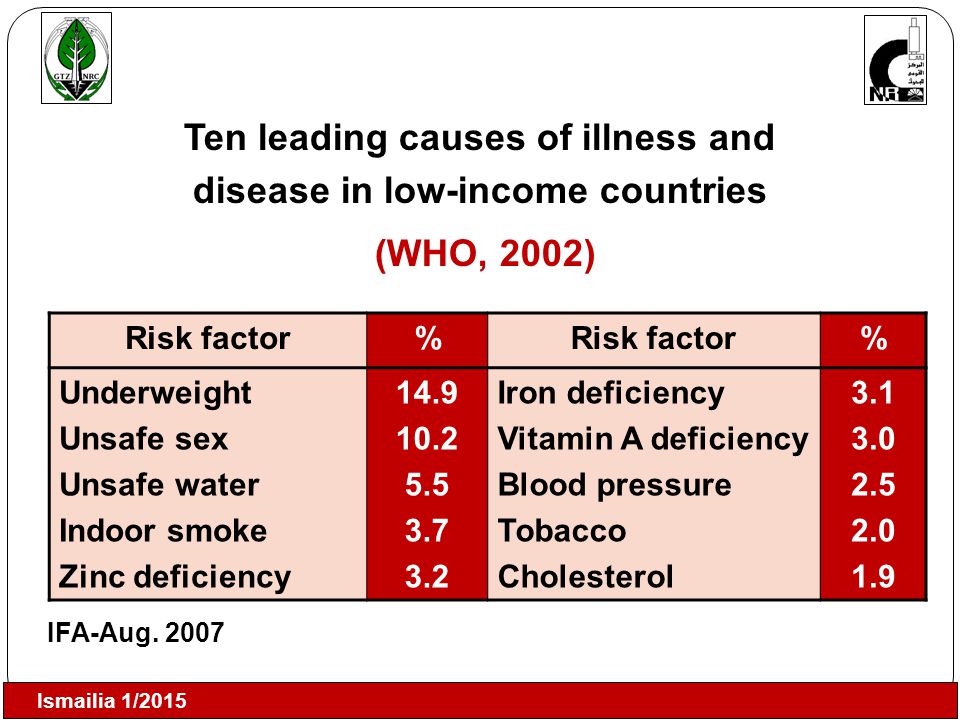
Ismailia 1/2015 1976 1956 Ten leading causes of illness and disease in low-income countries (WHO, 2002) Risk factor% % Underweight Unsafe sex Unsafe water Indoor smoke Zinc deficiency 14.9 10.2 5.5 3.7 3.2 Iron deficiency Vitamin A deficiency Blood pressure Tobacco Cholesterol 3.1 3.0 2.5 2.0 1.9 IFA-Aug. 2007
5
Ismailia 1/2015 1976 1956 NutrientSymptoms Fe Anemia is well known in all countries Zn School and preschool children have low intake Growth retardation In Jordan average intake 90% with lowest 71% of needs Morocco 29% of population has Zn deficiency In Egypt lot of indications of Zn deficiency occurrence in children and adolescents Global estimations of figure the possible deficiency in the region reach 74% of the population Others No much documented data Deficiencies in humans in the Region

6
Ismailia 1/2015 1976 1956 Micronutrients of high importance for Agriculture in the MENA Region Fe Mn Cu Zn B Se ? Why ?

7
Ismailia 1/2015 1976 1956 Low natural content in the soil High pH values of the soil (low availability) High salt content (low availability) High CaCO3 content Agronomic practices counteracting the continuous supply of nutrients/availability e.g. (irrigation / methods of fertilizers application) Crop intensification (high demand in short periods) Interaction between nutrients Major Reasons
 Crop intensification (high demand in short periods) Interaction between nutrients Major Reasons.")
8
Ismailia 1/2015 1976 1956 Major works on micronutrients in the region Sillanpaa (Finnland) (Regional) 1970’s National Research Centre, Cairo Micronutrient project (Egypt & Arab Countries) El-Fouly et al. 1976 Turkey – Cakmak et al. 1993 Iran – Malakouti et al. 1990’s Pakistan 1990’s India 1990’s

9
Ismailia 1/2015 1976 1956 Deficiencies in Soils

10
Ismailia 1/2015 1976 1956 Micronutrient content and its evaluation in soils of some selected areas in Egypt Area FeMnZnCu % deficient% Deficient% deficient Field Crops : Alluvial (0-30) Dakahlia 5000 samples Behira 308 samples Calcareous Nubaseed 582 samples Fruits trees Alluvial Kaliobia (0-60) 462 samples Sandy Gianacleese 0 5 98 40 93 0 6 98 5 98 44 18 65 56 19 10 0 92 3 36 % Deficient = % of total samples contain deficient amounts Source : El-Fouly (1986)
 Dakahlia 5000 samples Behira 308 samples Calcareous Nubaseed 582 samples Fruits trees Alluvial Kaliobia (0-60) 462 samples Sandy Gianacleese % Deficient = % of total samples contain deficient amounts Source : El-Fouly (1986)")
11
Ismailia 1/2015 1976 1956 Studies in Egypt – Syria – Jordan –- Turkey India – Pakistan – Yemen – Oman – Morocco – Tunisia - Sudan Showed Deficiencies in Soils in Zn Fe Cu M n

12
Ismailia 1/2015 1976 1956 Zn concentration in Surface and Sub-Surface Soil layers in some locations at Ismailia District (Ismailia Governorate)
")
13
Ismailia 1/2015 1976 1956 Mn concentration in Surface and Sub-Surface Soil layers in some locations at Ismailia District (Ismailia Governorate)
")
14
Ismailia 1/2015 1976 1956 Zinc deficiencies in calcareous soils on a district level DistrictNo. of Samples % soil samples deficient E. Champaran Muzaffarpur Samastipur Begusarai Vaishali Saran Gopalganj Siwan Overall 429 1309 1195 715 331 1094 599 1015 6687 60 75 57 54 48 77 78 79 68 Singh and Singh (2007)
.")
15
Ismailia 1/2015 1976 1956 Deficiencies in Plants

16
Ismailia 1/2015 1976 1956 Deficiency status in some selected crops in Egypt according to leaf analysis criteria % of total analyzed samples contain less than adequate Area FeMnZnCu Wheat Menoufia (121 samples) Behira (138 samples) 29 1 70 61 75 22 -1 Corn Menoufia (180 samples) Behira (170 samples) 10 - 27 1 32 23 - 13 Fababeans Menoufia (45 samples) Behira (158 samples) 35 - 80 62 85 30 -9-9
 Behira (138 samples) Corn Menoufia (180 samples) Behira (170 samples) Fababeans Menoufia (45 samples) Behira (158 samples)")
17
Ismailia 1/2015 1976 1956 Deficiency status in some selected crops in Egypt according to leaf analysis criteria % of total analyzed samples contain less than adequate (Continue) Area FeMnZnCu Soybean Menoufia (100 samples) Behira (35 samples) 25 - 25 - 25 - 37 Clover Menoufia (230 samples) Behira (152 samples) 26 7 100 30 90 33 -3-3 El-Fouly (1980)
 Area FeMnZnCu Soybean Menoufia (100 samples) Behira (35 samples) Clover Menoufia (230 samples) Behira (152 samples) El-Fouly (1980)")
18
Ismailia 1/2015 1976 1956 CropFeMnZnCu Wheat6070805 Maize6030805 Sorghum1030805 Cotton70 855 Sugar cane2580 5 Rice3060905 Vegetables50100 5 Orchards100 15 Legumes100 15 Estimated micronutrient deficiencies in major crops in Egypt (% of total area) hidden + temporarily deficiencies NRC-GTZ Project
 hidden + temporarily deficiencies NRC-GTZ Project")
19
Ismailia 1/2015 1976 1956 Crop species considered particularly susceptible to micro- nutrient deficiencies ManganeseBoronCopperZincFeMolybdenum Sugar beet WheatMaizePeanutsCauliflower PeasCottonBarley Field beans CloverBroccoli CottonOilseed rapeOnionsWheatSoybeanAlfalfa Dwarf beansSunflowerCarrotsRicePeas Oats Cauliflower/ cabbage Red beetPeanuts BarleyAlfalfaLettuceSorghum WheatCelerySpinach Potato Lettuce

20
Ismailia 1/2015 1976 1956 Estimated crop requirements for Zinc, Manganese, iron and Copper in Egypt Crop Percentage of surveyed crop area requiring micronutrients (%) ZnMnFeCu Wheat Maize Sorghum Cotton Sugar-cane Rice Vegetables Orchards Legumes 80 85 80 90 100 70 30 70 80 60 100 60 10 70 25 30 50 100 5 15 Sources : El-Fouly and Fawzi (1995)
 ZnMnFeCu Wheat Maize Sorghum Cotton Sugar-cane Rice Vegetables Orchards Legumes Sources : El-Fouly and Fawzi (1995)")
21
Ismailia 1/2015 1976 1956 Other Countries in the region have also micronutrient deficiencies in major field crops as well as fruits / vegetables especially under irrigation systems

22
Ismailia 1/2015 1976 1956 Grazing Animals Low Micronutrient Contents In Plants Low Intake Diseases

23
Ismailia 1/2015 1976 1956 Correction Approaches

24
Ismailia 1/2015 1976 1956 APPROACHES TO CORRECT DEFICIENCY : Treat the seed : Soaking Mixing Treat the soil: Fertilizers containing micronutrients Treat the plant : Fertilizers containing micronutrients Spraying foliar fertilizers Breeding high efficiency cultivars Treat the animal : Metered water Feeding blocks and licks Supplementation through the feed Injecting Producing fodder with high content Treat humans : Food fortification Supplementation capsules Increasing natural content of food produced

25
Ismailia 1/2015 1976 1956 Soil treatment

26
Ismailia 1/2015 1976 1956 Single compound Multinutrient compound Added to macronutrients Non-chelated Chelated Mixed Formulated

27
Ismailia 1/2015 1976 1956 Effect of Zn soil application on yield, Zn concentration and Zn uptake (Peanut) GregoryNC 10Giza 5Giza 6 Seed yield -Zn +Zn 109 156 158 74 100 56 59 Zn concentration in seeds g/g dry wt. -Zn +Zn 86 93 73 85 71 72 77 83 Zn uptake mg/plant -Zn +Zn 17 25 21 37 14 18 8 16 Semida - Unpublished

28
Ismailia 1/2015 1976 1956 Soil Treatments Added to NPK’s or Only Micronutrients (Chelated/Salts) Availability for long time is not guaranteed (pH stability – agronomic practices / Variation of needs/time) used only particular situations
 Availability for long time is not guaranteed (pH stability – agronomic practices / Variation of needs/time) used only particular situations")
29
Ismailia 1/2015 1976 1956 Seed Treatment

30
Ismailia 1/2015 1976 1956 Effects of seed Zn content on grain yield of bread wheat cultivar Atag grown under rainfed and irrigated conditions in a Zn-deficient calcareous soil with (+Zn = 23 kg Zn/ha) and without Zn (-Zn) fertilisation in Central Anatolia (Yilmaz et al., 1998). Seed Zn content RainfedIrrigared -Zn+Zn-Zn+Zn ng Zn/seedKg grain/ha 355480272057007170 800920317059307800 14651040284061907450 Mean810281059407470

31
Ismailia 1/2015 1976 1956 Effect of Zn content in seeds prior to seeding and yield under no additional Zn (Peanut) Seed Zn ug/seed g/g seed-1 Yield g/plant Gregory47 109 Giza 5324374 Giza 6172055 NC 1035 156 El-Fouly et al. unpublished

32
Ismailia 1/2015 1976 1956 Effect of application methods of some micronutrients on some chemical contents in the bulb at harvest. (Averages of two seasons) CharactersControl MnCu Seed soaking Root dipping Foliar spray Seed soaking Root dipping Foliar spray L.S.D. at 5% T.S.S.11.613.012.513.312.812.013.50.6 Total Nitrogen1.212.43.52.92.22.11.90.38 Phosphorus0.30.6 0.40.50.40.5N.S Manganese mg/kg132426372022202.4 Copper mg/kg0.8 1.00.71.34.31.80.4 Hindi et al. (1983)
 CharactersControl MnCu Seed soaking Root dipping Foliar spray Seed soaking Root dipping Foliar spray L.S.D. at 5% T.S.S Total Nitrogen Phosphorus N.S Manganese mg/kg Copper mg/kg Hindi et al. (1983).")
33
Ismailia 1/2015 1976 1956 Foliar Treatment

34
Ismailia 1/2015 1976 1956 Changes in micronutrients concentration in potato tubers of three potato cultivars as affected by micronutrients foliar spray S = Spunta M = Monaliza D = Diamont Source : Nofal et al., 1998 Treatments (g/fed.) Zn (ppm) Mean SMD 1995/1996 Control 13.1711.1711.1211.82 400 14.4013.9314.20 14.18 80017.8315.3314.0015.72 120017.9715.5016.5016.66 1996/1997 Control13.3013.7014.8013.93 40016.0716.1317.0016.40 80018.2016.1317.4317.25 120023.1016.2017.8019.03
 Zn (ppm) Mean SMD 1995/1996 Control /1997 Control")
35
Ismailia 1/2015 1976 1956 Effect of foliar application with micronutrient compounds on micronutrients concentration of potato tubers (ppm) during two seasons Source : Khalifa et al., (2003) Treatment Fe (ppm)Mn (ppm)Zn (ppm) 2001/20022002/20032001/20022002/20032001/20022002/2003 Control20.9332.105.407.2012.8312.00 400g/fed/29.6033.508.10 13.3613.37 800g/fed.41.9751.539.309.6021.6315.80 1200g/fed.37.6336.508.708.4012.8313.43 L.S.D. at 0.5% 15.2013.021.440.582.233.62

36
Ismailia 1/2015 1976 1956 Effect of spraying Mn, Zn, Fe combination on potato cultivars grown on clay soils (Experiment II). Treatment Tuber yield t/ha Nutrient concentration in leaves ppm FeMnZnCu Aran Banner 1. Control16.3b167b46b23b18a 2. Mn + Zn + Fe19.6a284a67a39a20a Alpha 1. Control22.5b118b52b22b16a 2. Mn + Zn + Fe26.0a177a61a34a15a Values with the same letter are not significantly different Fawzi et al. (1983)
.")
37
Ismailia 1/2015 1976 1956 Micronutrients content of soybean seeds as affected by micronutrient fertilizers (Average of two seasons) Treatment Micronutrients conc. (ppm) Micronutrients content ug/plant) FeMnZnFeMnZn 1. Control141a41a50a1650a480a585a 2. Nervanid Mn (14%)146a59c55ab2175b879d820c 3. Nervanid Zn (13%)158ab43a51c2386c649b921d 3. Pholaz A176c54b59b2605d799c 873c d 4. Pholaz Mn (15%)144a58c53a2246b908d827c 5. Ferriblix (Fe 6 %)165b50b52a2294b695b723b Firgany et al. (1988)
 Micronutrients content ug/plant) FeMnZnFeMnZn 1. Control141a41a50a1650a480a585a 2. Nervanid Mn (14%)146a59c55ab2175b879d820c 3. Nervanid Zn (13%)158ab43a51c2386c649b921d 3. Pholaz A176c54b59b2605d799c 873c d 4. Pholaz Mn (15%)144a58c53a2246b908d827c 5. Ferriblix (Fe 6 %)165b50b52a2294b695b723b Firgany et al. (1988).")
38
Ismailia 1/2015 1976 1956 1976 The effect of foliar application of Zn and Fe on the yield of two onion cultivars Bybordi and Malakoti (2007b) Yield (ton/ha) FAO Expert Meeting Cairo 12/07 FG G F G E F G E F CD D D F BC C A B
 Yield (ton/ha) FAO Expert Meeting Cairo 12/07 FG G F G E F G E F CD D D F BC C A B")
39
Ismailia 1/2015 1976 1956 1976 FAO Expert Meeting Cairo 12/07 1956 The effect of foliar application of Zn and Fe on NO 3 concentrations in bulbs of two onion cultivars Bybordi and Malakoti (2007 b) NO 3 (mg/kg) A AB A B B BC C C CD E D E F EF
 NO 3 (mg/kg) A AB A B B BC C C CD E D E F EF")
40
Ismailia 1/2015 1976 1956 1976 Micronutrient levels in ryegrass at different harvest cuts following foliar application of zinc at 1L/ha Moran (2004) Zinc conc.-ppm Zn in DM Cut number FAO Expert Meeting Cairo 12/07
 Zinc conc.-ppm Zn in DM Cut number FAO Expert Meeting Cairo 12/07")
41
Ismailia 1/2015 1976 1956 Soil Sample Application Method Kg/ha Fe Mg kg -1 Mn Mg kg -1 Zn Mg kg -1 Cu Mg kg -1 1 Soil 0198.972.8164.213.9 0.5205.381.6175.916.1 1.0224.188.2186.219.0 2.0224.199.5201.518.8 Foliage 0201.270.6168.113.3 0.5262.8105.7219.820.7 1.0268.1109230.624.4 2.0329.9134.7261.825.6 The effects of microplex on mineral contents of spinach

42
Ismailia 1/2015 1976 1956 Cereal grain Zn concentration as affected by Zn fertilization of deficient soils : some examples Species Zn concentration (mg kg -1 ) Reference Control+Zn Wheat Rice Corn Sorghum 14 15 18 12 6 71 33 44 45 28 Rashid and Fox (1992) Rashid et al. (2006) Rashid and Fox (1992) Abdul Rashid (2007)
 Rashid and Fox (1992) Abdul Rashid (2007).")
43
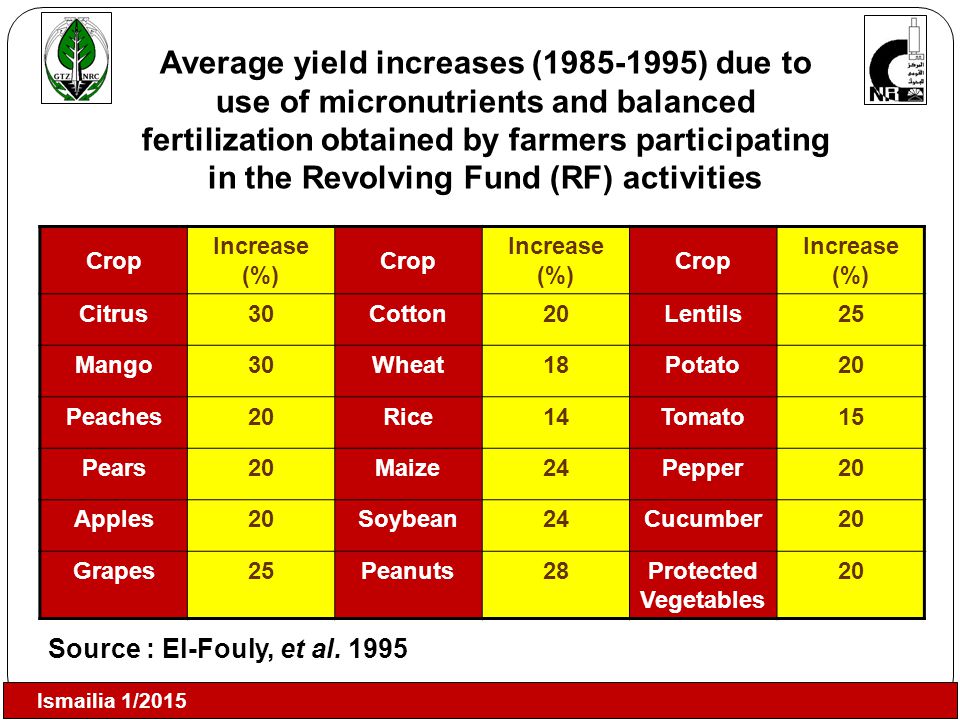
Ismailia 1/2015 1976 1956 Average yield increases (1985-1995) due to use of micronutrients and balanced fertilization obtained by farmers participating in the Revolving Fund (RF) activities Crop Increase (%) Crop Increase (%) Crop Increase (%) Citrus30Cotton20Lentils25 Mango30Wheat18Potato20 Peaches20Rice14Tomato15 Pears20Maize24Pepper20 Apples20Soybean24Cucumber20 Grapes25Peanuts28Protected Vegetables 20 Source : El-Fouly, et al. 1995
44
Ismailia 1/2015 1976 1956 WHO Strategy 2010 – 2019 “Promote the production and consumption of micronutrient rich foods as the ONLY truly sustainable solution to micronutrient deficiencies problems”

45
Ismailia 1/2015 1976 1956 Biofortification Strategies for Micronutrients 1)Increase uptake 2)Increase translocation 3)Increase storage capacity
Increase uptake 2)Increase translocation 3)Increase storage capacity")
46
Ismailia 1/2015 1976 1956 Testing Genotypes for Fe and Zn Contents Phaseolus Beans (CIAT) Rice(IRRI) Wheat (CIMMYT) Cassava (CIAT)
 Rice(IRRI) Wheat (CIMMYT) Cassava (CIAT)")
47
Ismailia 1/2015 1976 1956 Harvest Plus BeanIronZn Rwanda Congo 2012 MilletIronZnIndia2012 RiceZnIron Bangladesh, India 2013 WheatZnIron India, Pakistan 2013 Miller, D. and Welch, R.M.

48
Ismailia 1/2015 1976 1956 Average, minimum and Statistics of 90 germplasms evaluated at six locations in Zimbabwe for grain iron and zinc concentration during 1997-98 Site Iron (mg/kg)Zinc (mg/kg) Mean grain yield (ton/ha) MeanMinMaxMeanMinMax Harare, N applied 8.0218.514.426.021.916.731.5<.001 Harare, N stress3.2013.211.119.823.718.431.2<.001 Matopos1.4017.513.820.724.018.829.1<.001 Rattray7.1218.114.622.819.715.325.8<.001 Kadoma9.6217.614.325.319.415.023.3<.001 Glandala7.6518.113.225.723.817.830.8<.001 Across sites6.1717.214.421.822.018.528.5<.001
Zinc (mg/kg) Mean grain yield (ton/ha) MeanMinMaxMeanMinMax Harare, N applied <.001 Harare, N stress <.001 Matopos <.001 Rattray <.001 Kadoma <.001 Glandala <.001 Across sites <.001")
49
Ismailia 1/2015 1976 1956 Iron and Zinc content of some selected varieties of brown rice Variety Iron Mean + SE mg/kg No. of samples Mean + SE mg/kg No. of samples Jalmagna22.4 + 1.4531.8 + 7.74 Zuchem20.2 + 1.8434.2 + 5.03 Xua Bue Nuo18.8 + 0.8224.3 + 0.72 Madhuker14.4 + 0.5334.7 + 2.83 IR6411.8 + 0.5323.2 + 1.43 IR3611.8 + 0.9520.9 + 1.44 Gregorio et al. (2000)
.")
50
Ismailia 1/2015 1976 1956 Increase the micronutrients content in product Improving human and animal helath Germination improvement of resulted seeds Improving seedling growth Raising stress resistance Raising the resistance to pests Micronutrient Fertilization Yield increases +

51
Ismailia 1/2015 1976 1956 Conclusions Micronutrient remedy measures should be addressed within a holistic approach taking major essential elements into consideration (interaction between nutrients) Agricultural practices deliver quick solution for the low micronutrient content in food and feed and lead to economic vi yield increases with high micronutrient contents Recommended agricultural practices remedy differ according to soil type, crop and prevailing agricultural practice Breeding/genetic engineering programs can deliver a long run solution, provided they take other essential elements and balanced nutrition of crops into consideration while testing genotypes
 Agricultural practices deliver quick solution for the low micronutrient content in food and feed and lead to economic vi yield increases with high micronutrient contents Recommended agricultural practices remedy differ according to soil type, crop and prevailing agricultural practice Breeding/genetic engineering programs can deliver a long run solution, provided they take other essential elements and balanced nutrition of crops into consideration while testing genotypes")
52
Ismailia 1/2015 1976 1956 Acknowledgement Thanks are due to the Academy of Scientific Research and Technology, Egypt and the German Ministry for Economic Cooperation for their support during the early stages of the micronutrient program in the NRC.

53
Ismailia 1/2015 1976 1956 شكراً لحسن إستماعكم

Similar presentations


 1. INTRODUCTION:>")


