Download presentation
Presentation is loading. Please wait.

2
Risk Factors for Asthma Mary Ellen Gordian MD MPH Institute for Circumpolar Health Studies University of Alaska Anchorage

3
What is Asthma? Asthma is a chronic respiratory disease characterized by: eosinophilic inflammation of the airways; bronchial hyper-responsiveness to stimuli.

4
Different Types of Asthma Allergic asthma is associated with allergy as much as 80% of childhood asthma is related to allergy. Intrinsic asthma is not associated with allergy. Post-infective asthma occurs after a lower respiratory infection. Frequently clears by age 5.

5
Known Risk Factors for Asthma Family history – genetic predisposition Environmental tobacco smoke Combination of family history and environmental tobacco smoke exposure is additive.

6
World Wide Increase in Asthma Multi-center surveys show that asthma is increasing worldwide. Greatest increases in “westernized” English-speaking countries. Urban areas have more asthma cases than rural areas. Increase in both children and adults.

7
Asthma Rates Asthma Increasing Australia Costa Rica New Zealand Oman Peru Singapore United Kingdom United States No Asthma Increase Albania Estonia Indonesia Latvia Uzbekistan

8
The Icon of Westernization What is westernization? Individualization Independence Initiative and your own car!

9
Allergens associated with Asthma Dust mite allergy has been associated with asthma. Cockroach allergen are common in inner city children, associated with asthma. Molds have been implicated. Animal allergens (cat is ubiquitous) Children with allergy have increased risk of asthma.
 Children with allergy have increased risk of asthma..")
10
So why the increase in ALLERGIC RESPONSES! To survive in an environment full of foreign protein antigens, animals developed a method of response that minimized the energy needed to encounter non-infectious protein. Recognition and minimal response- tolerogenic response Cytokine IL-10 dampens immune responses.

11
What is Causing the Increase? Dietary Hypothesis Changes in diet result in increased susceptibility to allergic response. Hygiene Hypothesis Increased cleanliness reduces level of endotoxin which changes the immune system Adjuvant Hypothesis Exposure to petroleum exhaust fumes changes the immune system

12
Concerns for Dietary Hypothesis Reduction in locally grown food. Increases in chemically treated food. Salt intake is increased. Omega 3 fatty acids reduce allergic response in animals. Early intake of cow’s milk protein or soy protein may increase risk of allergy.

13
Hygiene Hypothesis Environmental exposure to endotoxin has a crucial role in the developing immune system driving the immune response from cell-mediated immunity (inflammation) to antibody production.
 to antibody production.")
14
Hygiene Hypothesis Children living on farms have less risk of allergy and asthma. Children in daycare have decreased risk. Children with older siblings less risk. Children with animal pets have less risk. Increased amount of endotoxin exposure in farm homes, and homes with dogs

15
Adjuvant Theory The exposure to traffic pollution results in changes in the immune system which promotes cell-mediated Th2 immunity characterized by inflammation. There is direct experimental evidence for this.

16
Evidence for Adjuvant Theory Children living near to freeways in Holland have greater symptoms, reduced FEV1. Children hospitalized for asthma live near high traffic areas as compared to children hospitalized for GI problems in U.K. Children living near traffic have more cough in Japan.

17
Laboratory Evidence People experimentally exposed to diesel exhaust (DE) have 16 x greater response to ragweed allergen than people not exposed. People exposed to DE make IgE to new antigen exposure, while people not exposed make IgA, IgG, but not IgE.

18
Mary Ellen’s Theory Petroleum exhaust affects the tolerogenic response, reduces IL-10 and promotes allergic responses----Not proven yet

19
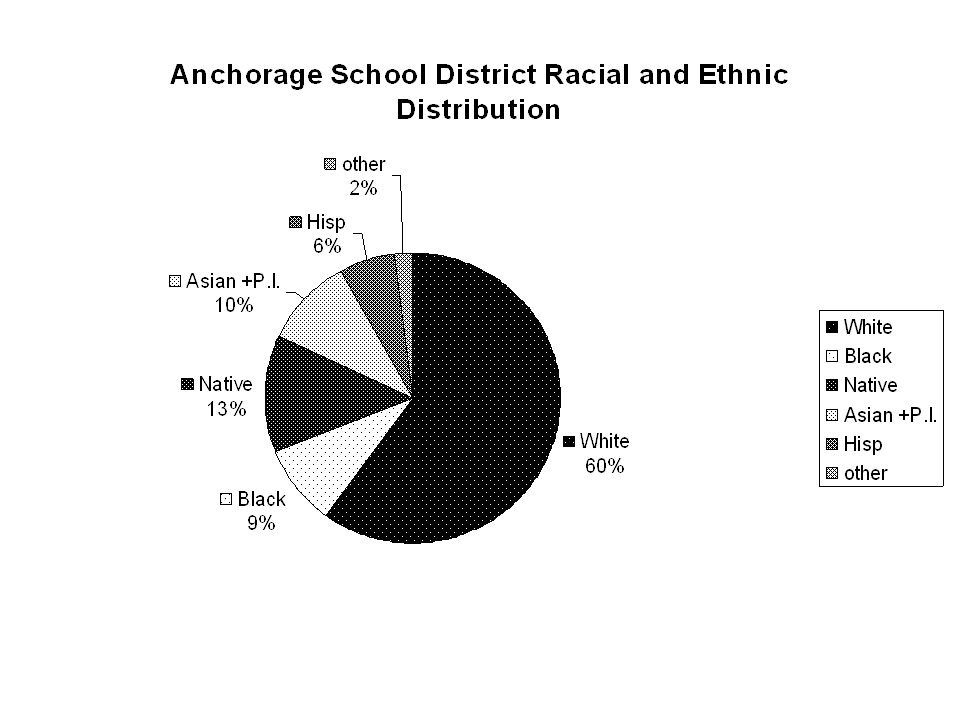
What are we doing in Alaska? Survey of Anchorage parents of children in kindergarten and first grade in 13 schools regarding asthma diagnoses, symptoms, demographics, home environment and family history. Over 1100 surveys received. Minorities well represented. All socioeconomic classes represented. Geographically distributed.

20
Study Design 13 schools representing a range of traffic exposure and socioeconomic demographics All kindergarten and first-grade students received surveys at registration, or in the classroom. (50-85% response rate) Traffic data collected from state Traffic measured on roads with no data.
 Traffic data collected from state Traffic measured on roads with no data..")
26
Traffic Variables Nearest intersection to home is located on map. Buffer zones 100 meters and buffer zones of 300 meters around intersection are drawn and the length of each road falling within buffer is measured. The length within the buffer is multiplied by the average daily traffic on that road in that segment.

27
Baseline Characteristics of Children between 5 and 7 years No Asthma AsthmaAsthma ratep-value Parental Asthma<0.001 No 734 53 6.7% Yes 151 50 24.9% Smoker in Home0.066 No 631 69 9.9% Yes 290 46 13.7% Family Income0.018 <$20K 189 36 16.0% $20-49K 375 48 11.3% $50-100K 253 19 7.0% >$100K 63 9 12.5% Gender0.314 male 470 64 12.0% female 449 50 10.0%

28
Categorization of Traffic Exposure at 100-meter Buffer No Asthma AsthmaTotal Asthma rate ______________________________________________________ Exposure Low 636 7571110.5% Medium 231 2825910.8% High 60 13 7317.8% 927 1161043

29
Regression results of 100-meter buffer and 300-meter buffer 100-meter Buffer300-meter buffer OR (95%CI)p-valueOR (95%CI) p-value Exposure0.0680.024 LowReferentReferent Medium1.06 (0.64, 1.77)1.37 (0.85, 2.23) High2.38 (1.19, 4.76)2.74 (1.35, 5.56) Parental Asthma<0.001<0.001 NoReferentReferent Yes4.27 (2.74, 6.65)4.30 (2.75, 6.72) Smoker in home0.2030.177 NoReferentReferent Yes1.34 (0.86, 2.10)1.37 (0.87, 2.15) Family Income0.1830.256 <$20KReferentReferent $20-49K0.72 (0.43, 1.21)0.76 (0.45, 1.28) $50-100K0.49 (0.26, 0.93)0.52 (0.27, 1.01) >$100K0.81 (0.33, 1.94)0.89 (0.37, 2.17) Gender0.3510.338 maleReferentReferent female0.81 (0.53, 1.25)0.81 (0.53, 1.25)
p-valueOR (95%CI) p-value Exposure LowReferentReferent Medium1.06 (0.64, 1.77)1.37 (0.85, 2.23) High2.38 (1.19, 4.76)2.74 (1.35, 5.56) Parental Asthma<0.001<0.001 NoReferentReferent Yes4.27 (2.74, 6.65)4.30 (2.75, 6.72) Smoker in home NoReferentReferent Yes1.34 (0.86, 2.10)1.37 (0.87, 2.15) Family Income <$20KReferentReferent $20-49K0.72 (0.43, 1.21)0.76 (0.45, 1.28) $50-100K0.49 (0.26, 0.93)0.52 (0.27, 1.01) >$100K0.81 (0.33, 1.94)0.89 (0.37, 2.17) Gender maleReferentReferent female0.81 (0.53, 1.25)0.81 (0.53, 1.25)")
30
Some Unexpected Findings A great many children do not live in the neighborhood school boundaries. Children diagnosed with asthma have an increased number of respiratory illnesses. There is variation in asthma rates between schools, highest 20%, lowest 6%.

31
Conclusions Children exposed to high traffic volumes have two and a half times greater risk of being diagnosed with asthma. The effect size of high traffic volume within 3 blocks of home is as great or greater than having a smoker in the house. Residential housing and schools should be protected from high traffic areas.

Similar presentations


 Royal Liverpool and Broadgreen University Hospitals NHS Trust, Liverpool, United Kingdom.>")


