Download presentation
Presentation is loading. Please wait.

1
THE RELATIONSHIP BETWEEN GENOTYPE AND PHENOTYPE – WHAT WE KNOW AND WHAT WE DON’T KNOW. PAUL SCHLIEKELMAN DEPARTMENT OF STATISTICS UNIVERSITY OF GEORGIA

2
GENOMES The genome of an organism is its full DNA sequence: …AAGCTGAAGTCTTACCTATGCTACACCGTGGG… The genome contains the “instruction manual” for making the organism.

3
THE HUMAN GENOME The human genome is roughly 3.3 billion nucleotides (letters) long. Interspersed among these nucleotides are roughly 20,000-30,000 genes. Genes code for proteins. Proteins do most of the work in cells and are required for the structure, function, and regulation of the body’s tissues and organs.

4
THE HUMAN GENOME Source: http://www.scfbio-iitd.res.in/tutorial/geneticorganization.html

6
LOCUS AND ALLELE A genetic locus (plural loci) is the specific location of a gene or DNA sequence on a chromosome. A variant of the DNA sequence at a given locus is called an allele. Each position on the chromosome map above is a locus with alleles that affect the trait shown.

7
HOW DOES DNA VARY AMONG PEOPLE? Image from Wikipedia

8
A single nucleotide polymorphism (SNP) refers to a nucleotide position at which different members of population commonly (>1%) have different nucleotides. Roughly 1 in 200 nucleotide sites are SNPs in humans. This is roughly 15 million variable positions. Most SNPs (~99%) do not have any functional effect (because most DNA is not functional). However, some do cause changes in traits. SNPs originate as mutations at single nucleotide positions.
 do not have any functional effect (because most DNA is not functional). However, some do cause changes in traits. SNPs originate as mutations at single nucleotide positions..")
9
We also each carry many variants that may be shared with family members but are rare in the population at large. We do not yet have broad measurements of the extent of rare variation. Recent studies suggest that the number of rare variants that each of us carries might be several times the number of common variants.

10
OTHER TYPES OF VARIANTS

11
Copy Number Variants (image from Wikipedia)
")
12
About 12% of human DNA is the result of copy number variation. CNVs may range in size from about 1000 nucleotides to several million nucleotides in length. Like with SNPs, most CNVs don’t have any phenotypic effect. However, there has been a realization in recent years that CNVs play a major role in causing diseases and other trait variation.

13
Focus of today: What is different between people that makes them be different in traits such as height, weight, intelligence, disease occurrence, etc?

14
GENOTYPE AND PHENOTYPE A phenotype is a trait or characteristic of an organism (e.g. height, weight, IQ in humans). The genotype is the genetic makeup of an organism or group of organisms with reference to a single trait, set of traits, or an entire complex of traits. We will usually be interested in the genotypes of the set of loci that control a phenotype.
. The genotype is the genetic makeup of an organism or group of organisms with reference to a single trait, set of traits, or an entire complex of traits. We will usually be interested in the genotypes of the set of loci that control a phenotype..")
15
DNA SEQUENCE VARIATION Differences between species are due to differences in their DNA sequence. Differences between individuals within a species are due to differences in their DNA sequences and differences in their environment.

16
GENOTYPE AND ENVIRONMENT Variation in a trait between individuals is due to a variation in genotype between the individuals and variation in environment between them. P = G + E + GXE P=phenotype, G=genotype, E=environment.

17
EXAMPLE – HUMAN HEIGHT Genetic component: All of the locations (possibly hundreds or thousands) in the genome that have DNA sequence variation that impacts height. Environmental component: Everything other than the DNA sequence that affects height: diet, exercise, chemical exposures, mother’s behavior during pregnancy, etc.

18
NATURE VERSUS NURTURE A fundamental question is how important genetics is versus environment in determining traits. This question has become known as the nature versus nurture debate. We can quantify for a trait this using math/statistics along with data on the correlation in the trait between relatives.

19
EXAMPLE - HEIGHT Height (inches): 68, 64, 71, 69, 70, 70, 72, 64, 70, 70, 74, 73, 70, 64, 68, 65, 69, 75, 70, 69, 67, 79, 67, 73, 68, 69, 71, 73, 64 Suppose that wish to determine how much effect that genetics has on height. We measure the heights of 30 adult men:

20
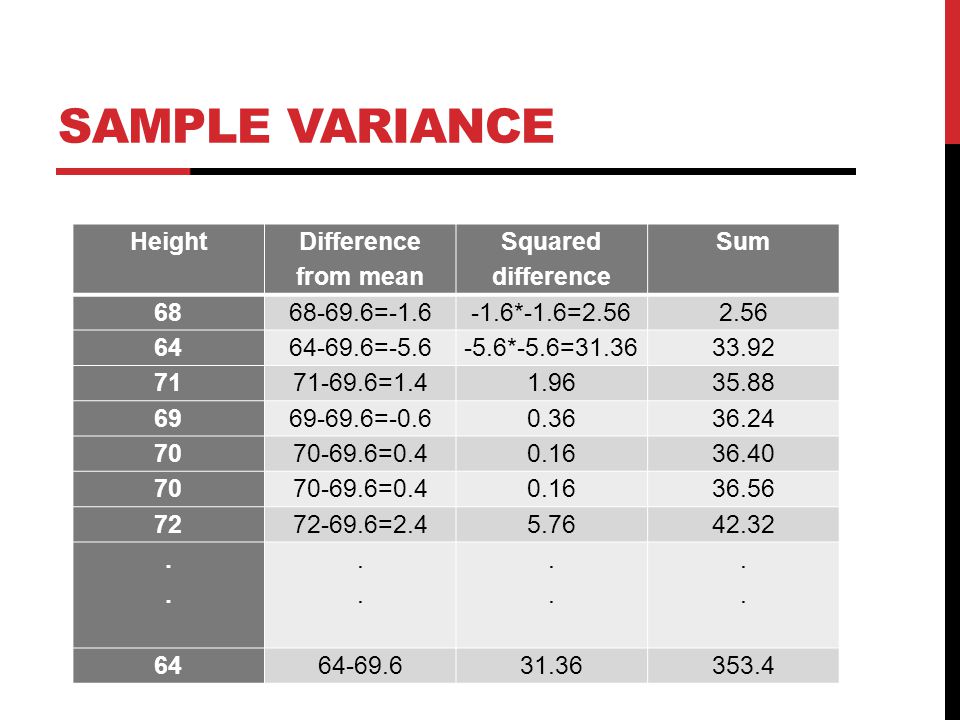
SAMPLE MEAN One measure that we use to quantify a sample is the mean or average: This is just under 5 feet 10 inches. This tells us something about the typical height in the sample. We would also like to know something about whether most people are near average, or whether many are very different from average.

21
SAMPLE VARIANCE Height Difference from mean Squared difference Sum 6868-69.6=-1.6-1.6*-1.6=2.562.56 6464-69.6=-5.6-5.6*-5.6=31.3633.92 7171-69.6=1.41.9635.88 6969-69.6=-0.60.3636.24 7070-69.6=0.40.1636.40 7070-69.6=0.40.1636.56 7272-69.6=2.45.7642.32................ 6464-69.631.36353.4
22
SAMPLE VARIANCE This is a measure of how different the heights are from the average. If everyone were exactly the same height, then the variance would be 0. If half of the men were all 4’10” and the other half were all 6’10”, the mean would still be the same, but the variance would increase to about 103!

23
DIVIDING UP THE VARIANCE We can show via some math that if Then Variance(P)=Variance(G)+Variance(E) Based on this, we define the following:
=Variance(G)+Variance(E) Based on this, we define the following:")
24
HERITABILITY The heritability of a trait in a population is the proportion of variance of the trait that is due to genetics.

25
CORRELATION BETWEEN RELATIVES Observation: The stronger the genetic component of a trait, the higher the correlation in the trait between relatives should be. We can use this idea (again via some fairly complicated math) to estimate the heritability.
 to estimate the heritability..")
26
CORRELATION BETWEEN RELATIVES

27
If is the correlation between relatives of type X and type Y, then under some fairly reasonable assumptions about the genetics of the traits, we can show:

28
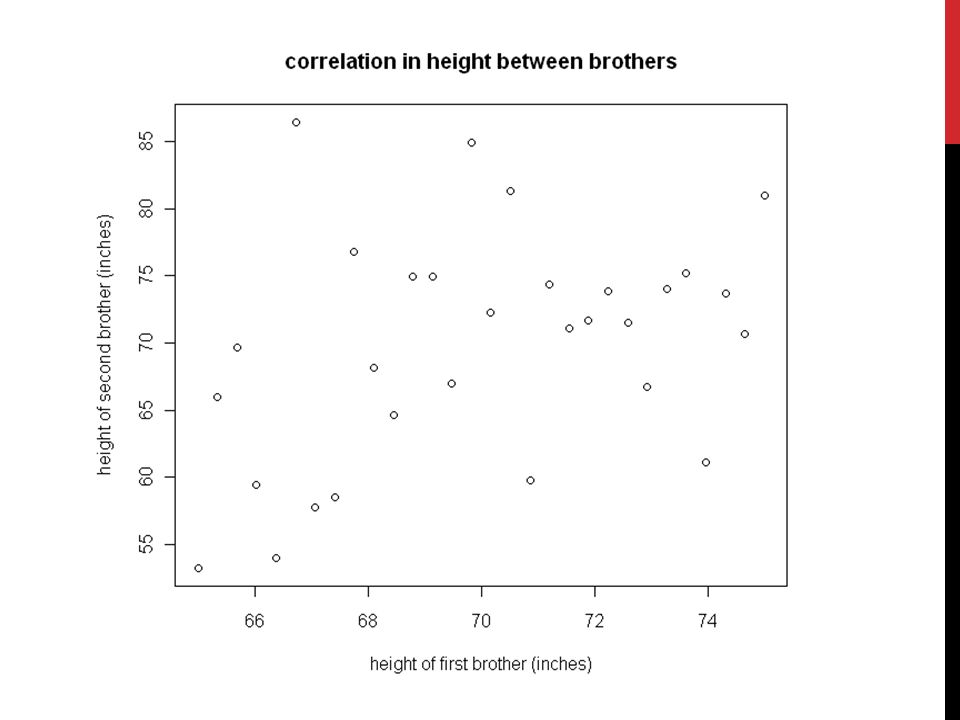
Back to Height Example Suppose that we also measured the height of brothers of all of the men in the sample. We would find a strong correlation between the heights of the brothers.

30
We calculate the correlation and find that it is 0.37. The heritability of the trait is equal to 2 times the correlation in the trait between siblings. Thus, our estimate for the heritability of human height is 2X0.37=0.74 or 74%. That is, we estimate that 74% of the variance in human height is due to genetics. Note that this is an estimate and thus will not be exactly right (we can quantify how close it is likely to be, but that is for another day!).
..")
31
EXAMPLE HERITABILITY VALUES Example heritability values in humans Traitheritability Adult Height80% IQ60%-80% Obesity70%-80% Schizophrenia80% Survival to age 8530% Survival to age 100apparently much higher neuroticism21% narrow sense, 44% broad sense extraversion22% narrow sense, 38% broad sense altruism15% narrow sense, 17% broad sense achievement striving9% narrow sense, 18% broad sense

32
CAVEAT ON HERITABILITY ESTIMATES Note that I said “fairly reasonable” assumptions. Interactions between loci and between loci and environment could inflate these estimates. Disagreement exists about how reliable these estimates are.

33
GENE MAPPING Goal: Find the specific DNA sequence differences between individuals that lead to variation in a trait of interest between them. Understanding the genetic basis of traits can help us Find disease cures. Predict disease risk. Understand evolutionary history. Understand differences between different populations.

34
GENE MAPPING

35
DISEASE MAPPING PROCEDURE Identify SNPS spread throughout the genome. Take a sample of people, some with the disease and some without. Find the genotype at each SNP. Find whether disease genotype at each SNP is associated with the disease. If the SNP is associated with the diseaser,then we know that a genetic variant that affects disease risk is nearby.

36
SIMPLE VERSUS COMPLEX GENETIC TRAITS Simple traits are those caused by alleles at a single locus. Examples include Huntington’s Disease, Cystic Fibrosis, Albinism. Complex traits are those whose variation is caused by multiple (possible hundreds or thousands) of different genetic loci. Most important traits (e.g. height, IQ) and diseases that affect many people (e.g. psychiatric disorders, cancers) are complex.
 of different genetic loci. Most important traits (e.g. height, IQ) and diseases that affect many people (e.g. psychiatric disorders, cancers) are complex..")
37
HISTORY OF GENE MAPPING IN HUMANS Since the 1970’s, genes have been mapped for thousands of different simple genetic diseases and other traits. In contrast, there has been little progress in unraveling the genetics of complex traits.

38
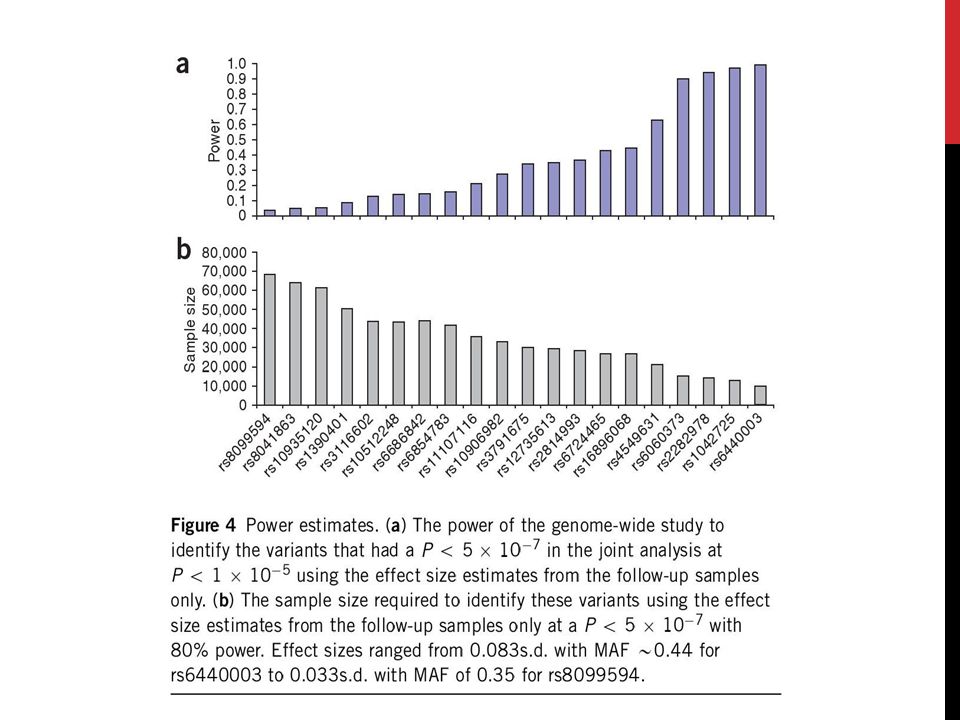
GENOME SCAN FOR HUMAN HEIGHT Sample of 13,665 adults of European ancestry: Each person genotyped on about 500,000 SNP markers. Height was measured for each person. Stage 1: 20 SNPs that affect human height were found. Hurrah!....but wait: Stage 2: These 20 SNPs were genotyped in a new set of 16,482 people.

39
GENOME SCAN FOR HUMAN HEIGHT

40
The SNP alleles change height by between ~0.2 cm and 0.6 cm per allele. Despite a 13,000 sample size, 500K markers, and the HapMap, this study could only account for 3% of the known genetic variation in human height.

41
WHERE IS THE REST OF THE REST OF THE GENETIC VARIATION? One possibility is that the sample size was too low to pick up most of the variation. I showed above how the effect size of the genotype must be quite large (e.g. 1.5-2.0) before we have a good chance to detect it. However, most genetic variants probably don’t have this much effect.
 before we have a good chance to detect it. However, most genetic variants probably don’t have this much effect..")
43
THE MISSING HERITABILITY PROBLEM In the last ten years, over 1000 genome scan studies like this one have been conducted for many different human diseases and other traits. A clear pattern has emerged: although many of these studies find multiple causative genetic variants, in most cases we can only account for less than 10% of the known genetic variance. The question of why these studies have failed has become known as the missing heritability problem.

44
CAUSES FOR THE MISSING HERITABILITY No one knows, but there are numerous hypotheses: Complex traits are controlled by many genetic variants of very small effect. Complex traits are controlled by rare variants. Interactions between genetic variants play a major role in controlling complex traits. GenotypeXEnvironment interactions play a major role. etc.

45
WHERE NEXT? Not clear – depends on what the cause of the missing heritability actually is. There is currently a great deal of effort to clarify this. Many variants of small effect? Probably hopeless. Rare variants? May be solvable by full genome sequencing. Interactions between variants? Maybe hopeless, but solutions may be possible. GenotypeXEnvironment Interactions?

46
WHOLE GENOME SEQUENCING The first DNA sequence of a single human individual (published in 2000) took $3 billion dollars and hundreds of people around the world working full time for 15 years. Now, a complete (more or less) human DNA sequence can be produced in a few days by a single lab technician at a cost of a few thousand dollars. It is widely believed that this cost will drop to under $1,000 dollars in the near future.
 human DNA sequence can be produced in a few days by a single lab technician at a cost of a few thousand dollars. It is widely believed that this cost will drop to under $1,000 dollars in the near future..")
47
WHOLE GENOME SEQUENCING With WGS, we no longer have to worry about markers and whether any are close to the locus. We simply have every single nucleotide position and so can (in principle) find any DNA that is variable. The currently is much excitement in the gene mapping world about WGS and its potential. However, it is still very unclear how well it will work in the face of the issues raised above.
 find any DNA that is variable. The currently is much excitement in the gene mapping world about WGS and its potential. However, it is still very unclear how well it will work in the face of the issues raised above..")
48
PERSONAL GENOMICS With sequencing this cheap, it would be feasible for everyone in the U.S. to get a full genome sequence. This raises the possibility that within a decade or two, your DNA sequence will be a standard part of your medical record and even in your personal possession. Google DNA?

49
WHAT COULD BE DONE WITH PERSONAL GENOMES? The Dream (nightmare?): Predict risk for many different diseases. Tailor disease treatments according to genotype. Predict height, IQ, etc. of child at birth. The Reality: We are still a very long way from this. As discussed above, we still can only account for small amount of the variation of most traits.
: Predict risk for many different diseases. Tailor disease treatments according to genotype. Predict height, IQ, etc. of child at birth. The Reality: We are still a very long way from this. As discussed above, we still can only account for small amount of the variation of most traits..")
50
THE PRESENT There are already several companies that will analyze your DNA for you: https://www.23andme.com/howitworks/ In my opinion, this is mostly a waste of money. We simply don’t know enough about the genetics of most traits to be able to make useful predictions (what good does it do you to know that your risk for disease X is 5% higher than average?). Could be useful if you are worried about being a carrier for some simple genetic disease.
. Could be useful if you are worried about being a carrier for some simple genetic disease..")
51
ETHICAL CONCERNS Would you want to know if you have a high risk for Alzheimers or bipolar disorder? Would it be a good thing if people’s IQ could be predicted with high certainty at birth? What might insurance companies or potential employers do with this information?

Similar presentations


 Harvard Medical School - Wu Laboratory www.pged.org.>")


