Download presentation
Presentation is loading. Please wait.

1
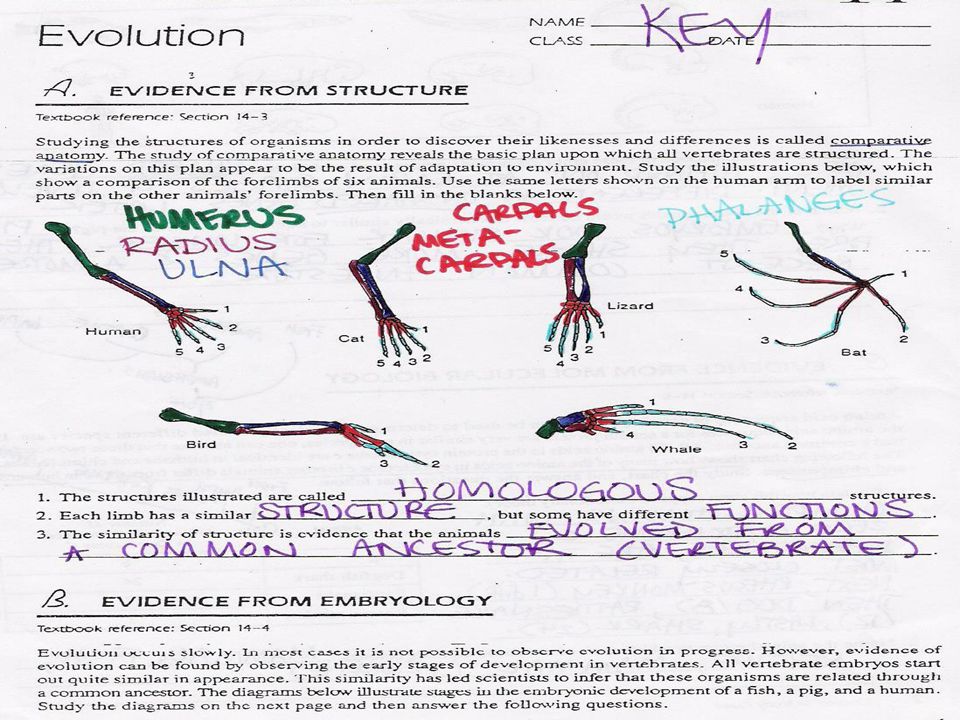
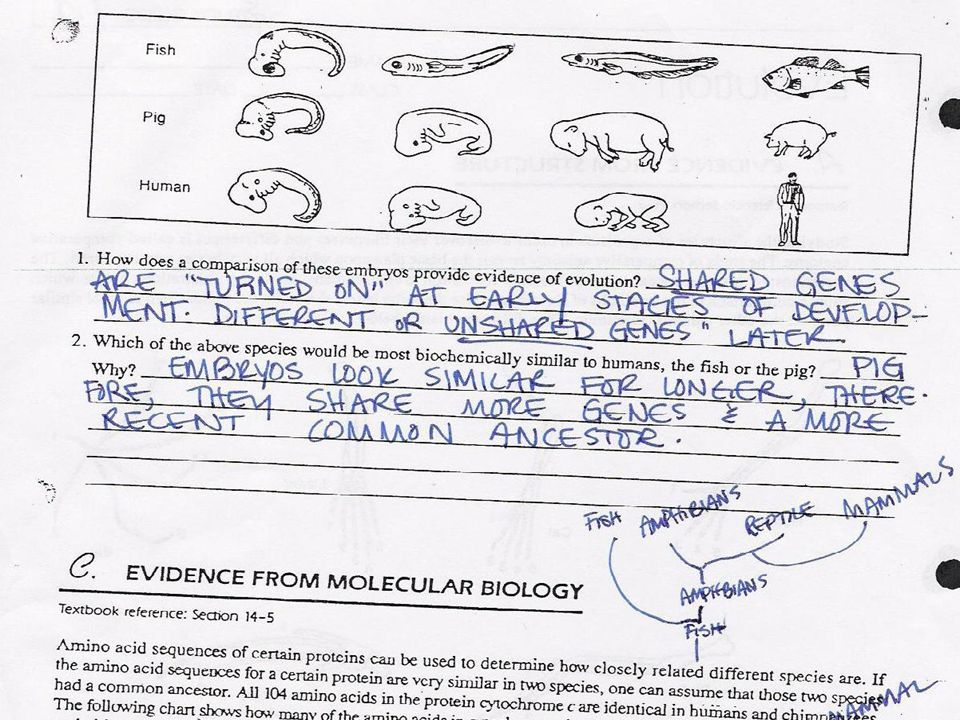
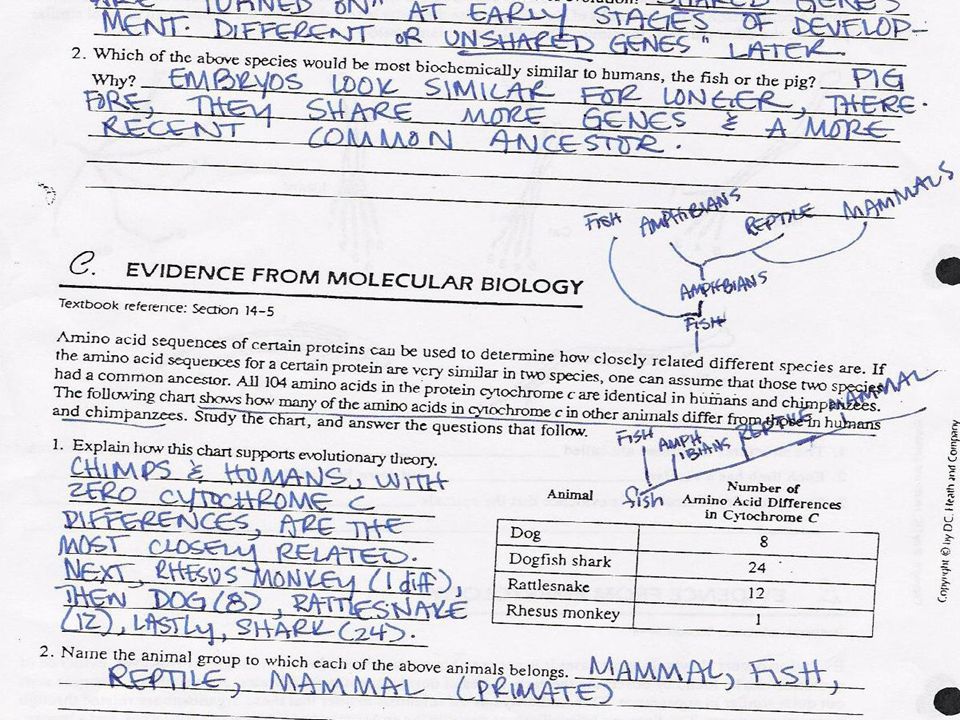
CHAPTER 16 THE EVOLUTION OF POPULATIONS & SPECIATION

2
Population Genetics Is the study of evolution from a genetic point of view. Populations have genetic differences those differences show up in their phenotypes. This bell curve can be used to show the range of phenotypes and the relative number of individuals in the population w/ the phenotype. Ex. Height, fur color, leg length, neck length Certain phenotypes may increase fitness while some decrease fitness BELL CURVE

3
Variations in genotype arise in 3 main ways
Mutations of DNA (s phase) Recombination (meiosis) Random fusion of gametes during sexual reproduction
 Recombination (meiosis) Random fusion of gametes during sexual reproduction.")
4
the total genetic information available in a population.
the gene pool the total genetic information available in a population. This is not a gene pool. It is a pretty pool in Bali.

5
Better example of gene pool…
The Darwin Awards. Awards to stupid people who have accidentally killed themselves thus removing their genes from the gene pool.

6
Evolution is the change in allele frequencies from one generation to the next.
ie. In the case of rabbits, the white rabbits are easy to see because they don’t camouflage well. When the recessive phenotype is selected against… Fewer homozygous recessive bunnies survive to reproduce and therefore there is more food to support heterozygous and homozygous dominant bunnies who reproduce more. So the frequency of recessive alleles decreases and frequency of dominant alleles increases from one generation to the next

7
GENETIC DRIFT is the: Random increase or decrease in allele frequencies. (By chance) The effect is more pronounced when populations are SMALL. Ex. Flipping a coin. Should be 50% heads & 50% tails. If you flip 1000 or 100 times it will be. If you flip 10 times it won’t.

8
Two special kinds of genetic drift are commonly observed as:
The Founder Effect Population Bottleneck Both reduce the population size significantly, but for different reasons.

9
The founder effect occurs when the allele frequencies in a group of migrating individuals are, by chance, not the same as that of their population of origin. Ex. Amish (German immigrants to Pennsylvania). One founder had an allele for polydactylism. After 200 years of reproductive isolation %Amish with polydactylism > % humans with polydactylism.
. One founder had an allele for polydactylism. After 200 years of reproductive isolation. %Amish with polydactylism > % humans with polydactylism.")
10
FOUNDER EFFECT If a population began with a few individuals — one or more of whom carried a particular allele — that allele may come to be represented in many of the descendants. Ex. Ellis-Van-Creveld syndrome results in shortened limbs and six fingers on each hand. Ex. Sickle cell anemia more prevalent among African Americans than the general public-- malaria as NS.

11
A population bottleneck occurs when the population undergoes a dramatic decrease in size due to natural catastrophe, disease, predation, or human influences. Ex. Ice ages, volcanic eruption, hunting. Ex. Tay-Sachs more prevalent among Ashkanazi Jews than the general public.

12
What’s going to happen to the diversity of the new Population?
Allele frequencies of new population will be different from the original population. Some genetic diversity is lost.

13
POPULATION BOTTLENECKS put species at risk of extinction.
Elephant seal CHEETAH

14
Cheetahs, the fastest of the land animals, seem to have passed through a similar period of small population size with its accompanying genetic drift. Examination of 52 different loci has failed to reveal any polymorphisms; that is, these animals are homozygous at all 52 loci. The lack of genetic variability is so profound that cheetahs will accept skin grafts from each other just as identical twins & inbred mouse strains do. Whether a population with such little genetic diversity can continue to adapt to a changing environment remains to be seen.

15
By 1900 hunting of the northern elephant seal off the Pacific coast had reduced its population to only 20 survivors. Since hunting ended, the population has rebounded from this population bottleneck to some 100,000 animals today. However, these animals are homozygous at every one of the gene loci that have been examined.

16
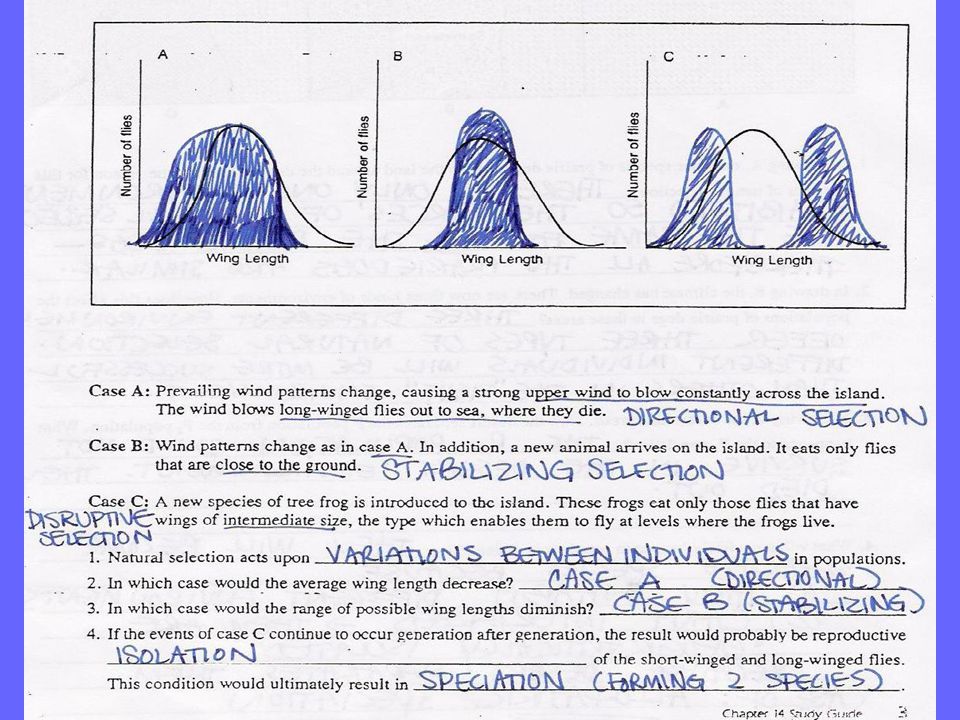
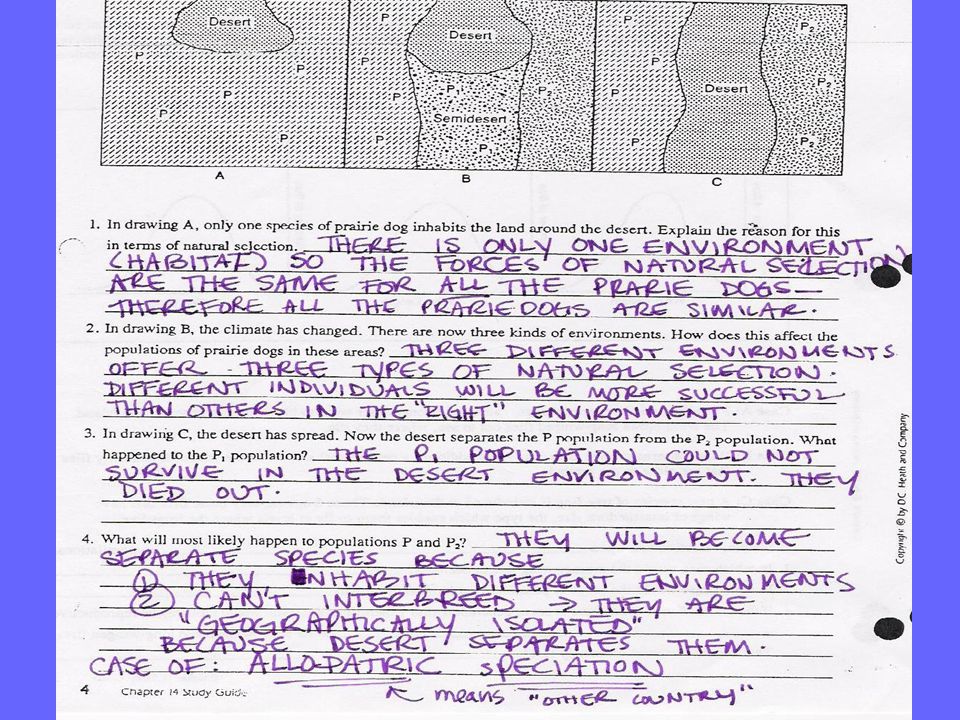
Disruptive Selection could lead to SPECIATION
SPECIATION is the formation new species. Happens if populations become ISOLATED- no gene flow 1) geographic isolation… ie. islands, separate continents 2) reproductive isolation a) prezygotic… ie. mechanical incompatibility b) postzygotic… ie. miscarriage or sterile offspring
 geographic isolation… ie. islands, separate continents. 2) reproductive isolation. a) prezygotic… ie. mechanical incompatibility. b) postzygotic… ie. miscarriage or sterile offspring.")
17
What is the morphological/biological SPECIES concept
What is the morphological/biological SPECIES concept? Same species IF individuals are capable of reproducing to produce fertile offspring.

19
HARDY-WEINBERG genetic equilibrium is a “negative proof” for evolution
HARDY-WEINBERG genetic equilibrium is a “negative proof” for evolution. When allele frequencies change- evolution is occurring… HW conditions prevent changes in ALLELE frequencies. Allele frequencies remain the same if: 1. There are no mutations- a dominant allele doesn’t become recessvie 2. There is no gene flow- immigration or emigration to upset the balance of alleles in the population 3. The population is large- to avoid genetic drift, change due to random events or chance 4. Mating is random- no preference for mates 5. Natural Selection does not occur- all phenotypes have the same chance for survival.

20
Hardy-Weinberg Equations
p2 + 2pq + q2 = 1 p + q = 1 P = frequency of dominant alleles q = frequency of recessive alleles P2 = frequency of homo dominant genotypes 2pq = frequency of heterozygous genotypes q2 = frequency of homo recessive genotypes

21
What is the relationship between phenotype and genotype?
Organisms with the recessive phenotype definitely have the homozygous recessive genotype. Organisms with the DOMINANT phenotype may be heterozygous or homozygous dominant. You can’t be sure of their genotype w/out doing a test cross or looking at a family pedigree. We can use this fact to solve Hardy-Weinberg math problems. % recessive phenotype= % recessive genotype = q2

22
PRACTICE PROBLEM: In a population of 100 individuals 16 display the recessive phenotype while the other 84 display the dominant phenotype. Use the HW equations to calculate the allele frequencies for the dominant and recessive alleles.

23
What do you know? Phenotypes!!!
q2= recessive phenotype= 16/100 p2 + 2pq = dominant phenotype = 84/100 LET’S SOLVE FOR q If q2 = 0.16 then q= the square root of .16 is 0.4 q = 0.4 LET’S SOLVE FOR p p = p = 0.6

24
Can you calculate the # of homozygous dominants and the # of heterozygous individuals?
Heterozygotes are represented by… 2pq 2 x 0.6 x 0.4= .48 Homozygous dominants are represented by… p2 (0.6)2 = 0.36
2 =")
25
Double check… do those numbers add up?
Homo rec + hetero + Homo dom = 100%

26
In the population of 400, 100 exhibit the recessive phenotype.
Calculate the allele frequencies. (p and q) Calculate the genotype frequencies.
 Calculate the genotype frequencies.")
27
100/400= recessive phenotype frequency
Recessive phenotype frequency=recessive genotype frequency Homozygous dominant genotype frequency = q2 = .25 q2 = .25 What is the square root of .25? = .5 Recessive allele frequency = q =. 5 P+q = 1 so P = 1-.5 Dominant allele frequency = P = .5 Homozygous dominant genotype frequency = P2 = .52 = .25 Heterozygous genotype frequency = 2pq = 2x.5x.5= .50

28
TYPES OF NATURAL SELECTION

29
TYPES OF NATURAL SELECTION
Stabilizing selection Directional selection Disruptive selection Sexual selection Artificial selection

30
STABILIZING SELECTION Selects against the extreme phenotypes
Heterozygous individuals are favored

31
DIRECTIONAL SELECTION Selects against an extreme phenotype
Favors the other extreme

32
DISRUPTIVE SELECTION Selects against the median phenotype
Favors phenotypes at both extremes

33
The evolutionary process is sped up
through ARTIFICIAL SELECTION- humans are the agent of selection… choosing which individuals mate

34
Sexual Selection traits that decrease survival but increase chances for reproduction increase.
Intersexual selection = females choosing males based on appearance or behavior.

35
Male vs. Male competition = intrasexual selection
males competing with one another for access to mates.

36
VIDEO: WHY SEX?

Similar presentations


 Population Genetics Study of evolution from a genetic point of view Population: individuals of the same species that.>")


