Download presentation
Presentation is loading. Please wait.

1
PATO An Ontology of Phenotypic Qualities
George Gkoutos University of Cambridge

2
Phenotype Information
Literature Qualitative descriptions Experimental data Quantitative descriptions Various representation methodologies Complex phenotype data Need for : “A platform for facilitating mutual understanding and interoperability of phenotype information across species and domains of knowledge amongst people and machines” …..

3
Representation of Phenotypic data
Organism attributes T – Species G – Genotype I – Strain S – Genotypic Sex A – Alleles at named loci E–Environmental/handling condition D – Age/stage of development Assay means of making observations Phenotypic Character any feature of the organism that is observed or 'assayed'.

4
Assay Controlled Vocabulary
Abnormality Relative_to Ranges of values Allows the schema to be dynamic Definition of qualities and their relations Explicit differences (between laboratories) Allows labs around the world to “plug-in” their assays to the schema Phenotypic Character Assay Phenotypic Character Phenotypic Character
 Allows labs around the world to plug-in their. assays to the schema. Phenotypic. Character. Assay. Phenotypic. Character. Phenotypic. Character.")
5
Phenotypic character representation methodologies
Pre-composition Examples: MGI Mouse genotype-phenotype annotation (Mammalian Phenotype) Gramene trait annotation (Plant trait ontology) etc. Pre-composition often follows the compositional structure occasionally adopted by GO terms. Positive/negative regulation of mitosis positive/negative + regulation of mitosis (GO: ) Increased/decreased angiogenesis increased/decreased + angiogenesis (GO: ) Advantages Easy for annotation Control Complex phenotypic information Disadvantages Lack of rigidity Ontology management Expansion Quantitative data
 Gramene trait annotation (Plant trait ontology) etc. Pre-composition often follows the compositional structure occasionally adopted by GO terms. Positive/negative regulation of mitosis positive/negative + regulation of mitosis (GO: ) Increased/decreased angiogenesis increased/decreased + angiogenesis (GO: ) Advantages. Easy for annotation. Control. Complex phenotypic information. Disadvantages. Lack of rigidity. Ontology management. Expansion. Quantitative data.")
6
Methodologies (cont.) post-composition
The post-composition methodology takes advantage of the ability to describe phenotypes by describing the particular affected entity (bearer), which could be an anatomical structure, a biological process, a particular function etc. , and the qualities that this entity possess, which can be described either in qualitative or quantitative terms. Advantages Ontology management Rigidity expansion Quantitative data Advanced queries Disadvantages Complex phenotypic information More difficult for annotation Need for constraints for ensuring meaningful annotations
, which could be an anatomical structure, a biological process, a particular function etc. , and the qualities that this entity possess, which can be described either in qualitative or quantitative terms. Advantages. Ontology management. Rigidity. expansion. Quantitative data. Advanced queries. Disadvantages. Complex phenotypic information. More difficult for annotation. Need for constraints for ensuring meaningful annotations.")
7
Phenotype And Trait Ontology (PATO)
An ontology of phenotypic qualities, which can be shared across different species and domains of knowledge. Qualities are the basic entities that we can perceive and/or measure: colors, sizes, masses, lengths etc. Qualities inhere to entities: every entity comes with certain qualities, which exist as long as the entity exist. Qualities belong in a finite set of quality types (i.e. color, size etc) and inhere in specific individuals. No two individuals can have the same quality, and each quality is specifically constantly dependent on the entity it inheres in.
 and inhere in specific individuals. No two individuals can have the same quality, and each quality is specifically constantly dependent on the entity it inheres in.")
8
Phenotypic Character PATO EQ Core Ontologies PATO Entity (E)
(e.g. anatomy, behaviour, pathology) PATO Species Independent PATO Species Independent Entity (E) Quality (Q) EQ Phenotype Description EQ Phenotype Description
 PATO. Species Independent. PATO. Species Independent. Entity (E) Quality (Q) EQ. Phenotype Description. EQ. Phenotype Description.")
9
Simple phenotype descriptions
Phenotypic Character entity + quality (mouse body weight) (mouse anatomy: body + PATO: weight) (Drosophila anatomy: eye + PATO: colour) (ChEBI: glucose + PATO: concentration) (eye colour) (glucose concentration) increased size hepatocellular carcinoma hepatocellular carcinoma (MPATH:357) has_quality increased size (PATO: )
 (mouse anatomy: body + PATO: weight) (Drosophila anatomy: eye + PATO: colour) (ChEBI: glucose + PATO: concentration) (eye colour) (glucose concentration) increased size hepatocellular carcinoma. hepatocellular carcinoma (MPATH:357) has_quality increased size (PATO: )")
10
Phenotype annotation model
Genetic Environment Evidence Qualifier Assertion Source Entity relationship Quality To create tools that enable annotators to compose structured, computationally interpretable phenotype statements. this particular fruitfly participating in this particular flight from here to there (IDs are proxies for these) An attributed statement positing some relation(s) between entities Typically accompanied by associations to evidence-oriented entities and metadata Shh participates_in heart development p53 implicated_in cancer p53 has_function DNA repair PMID:1234 mentions melanoma Abc[-] influences blood pressure Trial3456 has_inclusion_criteria (age that < 65) Attribution Properties Units Who makes the assertion When, what organization
 An attributed statement positing some relation(s) between entities. Typically accompanied by associations to evidence-oriented entities and metadata. Shh participates_in heart development. p53 implicated_in cancer. p53 has_function DNA repair. PMID:1234 mentions melanoma. Abc[-] influences blood pressure. Trial3456 has_inclusion_criteria (age that < 65) Attribution. Properties. Units. Who makes the assertion. When, what organization.")
11
Annotation: Phenotypes in literature
Evidence: light microscopy Source: PMID: Assertion eya1 E=eye disc (FBbt: ) Q=condensed (PATO: ) influences appears Date: 10/26/2007 Organization: FlyBase Version: 1 M. Ashburner 11
 Q=condensed. (PATO: ) influences. appears. Date: 10/26/2007. Organization: FlyBase. Version: 1. M. Ashburner. 11.")
12
Quantitative Data PATO – part of a representation of qualitative phenotypic information More often than not it is important to record quantitative information that results from a specific measurement of a quality Measurements involve units (Phenotypic Character + Unit) The tail of my mouse is 2.1 cm
 The tail of my mouse is 2.1 cm.")
13
PATO & measurements UO – an ontology of unit
UO’s top-level division is between primary base units of a particular measure and units that are derived from base units mapping between the various scalar qualities (such as weight, height, concentration etc.) and the corresponding units used to measure those qualities UO includes 264 terms, all of which are defined list (
 and the corresponding units used to measure those qualities. UO includes 264 terms, all of which are defined. list ( forum_id=50613)")
14
Mapping PATO to the UO

15
Linking quantitative data to qualitative descriptions
Measurement qualitative description Assay range normality necessary & sufficient conditions EQ descriptor high level annotation marking phenodeviance (e.g. MP)
")
16
Multiple phenotypic characters to describe complex phenotypes
SHH-/+ SHH-/- shh-/+ shh-/-

17
(character) = entity + quality
Phenotype (character) = entity quality Each EAV set defines a phenotypic character. By combining PCs we can build up a description that defines a complex syndrome or disease. As more is learned about a disease, PCs can be easily added or updated.
 = entity + quality. Each EAV set defines a phenotypic character. By combining PCs we can build up a description that defines a complex syndrome or disease. As more is learned about a disease, PCs can be easily added or updated.")
18
(character) = entity + quality P1 = eye + hypoteloric
Phenotype (character) = entity quality P1 = eye + hypoteloric Each EAV set defines a phenotypic character. By combining PCs we can build up a description that defines a complex syndrome or disease. As more is learned about a disease, PCs can be easily added or updated.
 = entity + quality. P1 = eye + hypoteloric. Each EAV set defines a phenotypic character. By combining PCs we can build up a description that defines a complex syndrome or disease. As more is learned about a disease, PCs can be easily added or updated.")
19
(character) = entity + quality P1 = eye + hypoteloric
Phenotype (character) = entity quality P1 = eye + hypoteloric P2 = midface + hypoplastic Each EAV set defines a phenotypic character. By combining PCs we can build up a description that defines a complex syndrome or disease. As more is learned about a disease, PCs can be easily added or updated.
 = entity + quality. P1 = eye + hypoteloric. P2 = midface + hypoplastic. Each EAV set defines a phenotypic character. By combining PCs we can build up a description that defines a complex syndrome or disease. As more is learned about a disease, PCs can be easily added or updated.")
20
(character) = entity + quality P1 = eye + hypoteloric
Phenotype (character) = entity quality P1 = eye + hypoteloric P2 = midface + hypoplastic P3 = kidney + hypertrophied Each EAV set defines a phenotypic character. By combining PCs we can build up a description that defines a complex syndrome or disease. As more is learned about a disease, PCs can be easily added or updated.
 = entity + quality. P1 = eye + hypoteloric. P2 = midface + hypoplastic. P3 = kidney + hypertrophied. Each EAV set defines a phenotypic character. By combining PCs we can build up a description that defines a complex syndrome or disease. As more is learned about a disease, PCs can be easily added or updated.")
21
+ ZFIN: PATO: eye hypoteloric midface hypoplastic kidney hypertrophied
Phenotype (character) = entity quality P1 = eye + hypoteloric P2 = midface + hypoplastic P3 = kidney + hypertrophied ZFIN: eye midface kidney PATO: hypoteloric hypoplastic hypertrophied + Each EAV set defines a phenotypic character. By combining PCs we can build up a description that defines a complex syndrome or disease. As more is learned about a disease, PCs can be easily added or updated.
 = entity + quality. P1 = eye + hypoteloric. P2 = midface + hypoplastic. P3 = kidney + hypertrophied. ZFIN: eye. midface. kidney. PATO: hypoteloric. hypoplastic. hypertrophied. + Each EAV set defines a phenotypic character. By combining PCs we can build up a description that defines a complex syndrome or disease. As more is learned about a disease, PCs can be easily added or updated.")
22
(character) = entity + quality P1 = eye + hypoteloric
Phenotype (character) = entity + quality P1 = eye + hypoteloric P2 = midface + hypoplastic P3 = kidney + hypertrophied Phenotype = P1 + P2 + P3 (phenotypic profile) = holoprosencephaly Each EAV set defines a phenotypic character. By combining PCs we can build up a description that defines a complex syndrome or disease. As more is learned about a disease, PCs can be easily added or updated.
 = entity + quality. P1 = eye + hypoteloric. P2 = midface + hypoplastic. P3 = kidney + hypertrophied. Phenotype = P1 + P2 + P3. (phenotypic profile) = holoprosencephaly. Each EAV set defines a phenotypic character. By combining PCs we can build up a description that defines a complex syndrome or disease. As more is learned about a disease, PCs can be easily added or updated.")
23
Assays for complex phenotype data & quantitative data
Phenotypic Character Assay Phenotypic Character Phenotypic Character necessary necessary & sufficient phenodeviance

24
Linking qualitative descriptions across species
Decomposition of precomposed phenotype ontologies by providing logical definitions based on PATO Link annotations across different knowledge domains and species Link phenotypic descriptions of human diseases to animal models

25
Reconciling pre and post composed annotations
Retrospective PATO definitions of pre-coordinated terms in phenotype ontology Precomposed Ontologies Mammalian Phenotype Plant trait Worm phenotype etc. OMIM

26
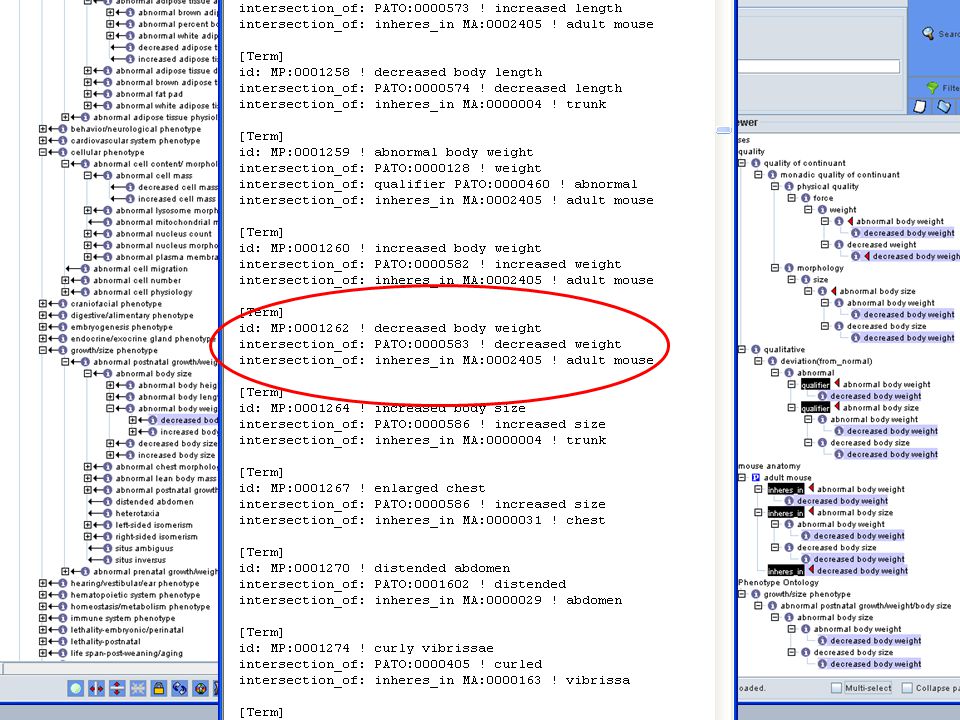
EQ definitions Aristotelian definitions (genus-differentia)
A <Q> *which* inheres_in an <E> [Term] id: MP: name: decreased body weight namespace: mammalian_phenotype_xp Synonym: low body weight Synonym: reduced body weight def: " lower than normal average weight “[] is_a: MP: ! abnormal body weight intersection_of: PATO: ! decreased weight intersection_of: MA: ! adult mouse

28
Phenotypic information captured differently within the same domain (OMIM)
Query # of records “large bone” 713 "enlarged bone" 136 "big bones" 16 "huge bones" 4 "massive bones" 28 "hyperplastic bones" 8 "hyperplastic bone" 34 "bone hyperplasia" 122 "increased bone growth" 543 OMIM is an extraordinarily valuable resource that consists of 18,344 records (all numbers are of 01/01/08 and were obtained from the NCBI's Entrez server). However, the number of records with both a known sequence and phenotypic data is small, 386 (12,017 records have a known sequence.) OMIM is, fundamentally, a text-based resource, and retrieval of information suffers from this fact, as the following Entrez searches show:
. However, the number of records with both a known sequence and phenotypic data is small, 386 (12,017 records have a known sequence.) OMIM is, fundamentally, a text-based resource, and retrieval of information suffers from this fact, as the following Entrez searches show:")
29
Phenotypic information captured differently across different domains
MP: – decreased body size MP: – decreased body height WBPhenotype – small OMIM % – short stature

30
Logical definitions allow for cross species – domain links
[Term] id: MP: ! decreased body size intersection_of: PATO: ! decreased size intersection_of: inheres_in MA: ! adult mouse id: MP: ! decreased body height intersection_of: PATO: ! decreased height id: WBPhenotype ! small intersection_of: OBO_REL:inheres_in WBls: ! Adult id: OMIM:xxxxxxx ! short stature intersection_of: OBO_REL:inheres_in FMA!:20394 ! Body intersection_of: ATO: ! decreased height intersection_of: OBO_REL:inheres_in FMA:20394 ! Body

31
Suzie Lewis....

32
Experimental Design Annotate 11 human disease genes, and their homologs Develop search algorithm that utilizes the ontologies for comparison Test search algorithm by asking, “given a set of phenotypic descriptions (EQ stmts), can we find…” alleles of the same gene homologs in different organisms members of a pathway (same organism) members of a pathway (other organisms)
, can we find… alleles of the same gene. homologs in different organisms. members of a pathway (same organism) members of a pathway (other organisms)")
33
Strategy for Annotation
Leverage OMIM gene and related disease records Use FMA, CL, GO, EDHAA, CHEBI, PATO ontologies Annotate 5 (in parallel) to check for curator consistency Annotate fly & fish orthologs (FB, ZFA) Import mouse ortholog data (MA, MP)
 to check for curator consistency. Annotate fly & fish orthologs (FB, ZFA) Import mouse ortholog data (MA, MP)")
34
Testing the methodology
Annotated 11 gene-linked human diseases described in OMIM, and their homologs in zebrafish and fruitfly: Gene Disease ATP2A1 Brody Myopathy EPB41 Elliptocytosis EXT2 Multiple Exostoses EYA1 BOR syndrome FECH Protoporphyria PAX2 Renal-Coloboma Syndrome SHH Holoprosencephaly SOX9 Campomelic Dysplasia SOX10 Peripheral Demyelinating Neuropathy TNNT2 Familial Hypertrophic Cardiomyopathy TTN Muscular Dystrophy Incomplete list of “syndromes”!!! 34

35
An OMIM Record 35

36
Annotation Results Gene # geno-types phenotype statements total
average/ allele ATP2A1 5 16 3 EPB41 4 18 EXT2 35 7 EYA1* 335 19 FECH 14 37 PAX2* 24 183 8 SHH 207 9 SOX9* 13 321 23 SOX10* 15 192 12 TNNT2 10 36 TTN 21 63 Total (11) 146 1443 This shows the results of the annotation effort. For the 11 genes we annotated 146 genotypes with a total of 1443 annotation statements. We performed 4 of these in triplicate (with asterisk) to check for consistency. Without getting into it, the genes annotated in triplicate revealed that the annotators had more than 75% similar annotations. (we just don’t have time in the 15 minutes to go through this.) 36
 This shows the results of the annotation effort. For the 11 genes we annotated 146 genotypes with a total of 1443 annotation statements. We performed 4 of these in triplicate (with asterisk) to check for consistency. Without getting into it, the genes annotated in triplicate revealed that the annotators had more than 75% similar annotations. (we just don’t have time in the 15 minutes to go through this.) 36.")
37
Experimental Design Annotate 11 human disease genes, and their homologs Develop search algorithm that utilizes the ontologies for comparison Test search algorithm by asking, “given a set of phenotypic descriptions (EQ stmts), can we find…” alleles of the same gene homologs in different organisms members of a pathway (same organism) members of a pathway (other organisms)
, can we find… alleles of the same gene. homologs in different organisms. members of a pathway (same organism) members of a pathway (other organisms)")
38
Ontology-based similarity scoring
First, you have to discuss the scoring metrics. There’s information content, and the IC ratios between things. Nodes are deemed similar on the basis of what they have in common. we are looking for similarity on the basis of shared annotations to classes in an ontology, or to compositional description classes In these cases, we used inferred annotations. E.g. if geneA is annotated to Leg and geneB to Wing, they have Appendage in common. Scoring is typically a measure of what the nodes have in common vs what one node has that the other one does not. The basicSimilarityScore (aka class overlap) is the ratio of nodesInCommon to nodesInUnion . Recall that this includes inferred annotations. This is desirable for two reasons: it allows approximate matching for non-exact classes, and it penalises general matches in favour of specific matches. The information content of a class is a measure of how "surprised" we are to see it in an annotation. The pre-reasoned results are essential for finding nodesInCommon - annotations do not necessarily match exactly - they may match further up the graph. so we do not report or double-count nodes that subsume existing nodes. Ontology-based similarity scoring Measure IC of any node: Compute ‘similarity’ by finding IC ratios between any genotypes, genes, classes, etc. 38
 is the ratio of nodesInCommon to nodesInUnion . Recall that this includes inferred annotations. This is desirable for two reasons: it allows approximate matching for non-exact classes, and it penalises general matches in favour of specific matches. The information content of a class is a measure of how surprised we are to see it in an annotation. The pre-reasoned results are essential for finding nodesInCommon - annotations do not necessarily match exactly - they may match further up the graph. so we do not report or double-count nodes that subsume existing nodes. Ontology-based similarity scoring. Measure IC of any node: Compute ‘similarity’ by finding IC ratios between any genotypes, genes, classes, etc. 38.")
39
Ontology-based Search Algorithm
Now, given that we can compute the IC ratios between any two things, then we can certainly do this for the phenotypic profiles for any two gene pairs. Given a query node q, we try to find hits h1, h2,... that are of the same type as q, and are similar to q in terms of their annotation profile, A(q). The annotation profile is the set of classes used to annotate that entity, and their ancestors, via some relevant relation(s). c ∈ A(q) iff link(r,q,c) link(r,q,c) may be computed via reasoning. For example: link(influences,sox9,curvature-of-tibia) → link(influences,sox9,morphology-of-bone) Candidate hits are prioritized according to how close they are to the profile. They are ordered in descending order by | A(h) ∩ H(q) |, and the first N are chosen as the final set Ontology-based Search Algorithm Given a query node q, we try to find hits h1, h2,... that are of the same type as q, and are similar to q in terms of their annotation profile, A(q). First step: create an annotation profile for the thing to be searched (i.e., a gene) The annotation profile is the set of classes used to annotate that entity, and their ancestors Comparing annotation profiles using same similarity IC metric c ∈ A(q) iff link(r,q,c) link(influences,sox9,curvature-of-tibia) → link(influences,sox9,morphology-of-bone) 39
. The annotation profile is the set of classes used to annotate that entity, and their ancestors, via some relevant relation(s). c ∈ A(q) iff link(r,q,c) link(r,q,c) may be computed via reasoning. For example: link(influences,sox9,curvature-of-tibia) → link(influences,sox9,morphology-of-bone) Candidate hits are prioritized according to how close they are to the profile. They are ordered in descending order by | A(h) ∩ H(q) |, and the first N are chosen as the final set. Ontology-based Search Algorithm. Given a query node q, we try to find hits h1, h2,... that are of the same type as q, and are similar to q in terms of their annotation profile, A(q). First step: create an annotation profile for the thing to be searched (i.e., a gene) The annotation profile is the set of classes used to annotate that entity, and their ancestors. Comparing annotation profiles using same similarity IC metric. c ∈ A(q) iff link(r,q,c) link(influences,sox9,curvature-of-tibia) → link(influences,sox9,morphology-of-bone) 39.")
40
Yes, we can find alleles of same gene
# geno-types allelic phenotype profiles phenotype statements # alleles >0 sim ratio average sim ratio average IC ratio total average/ allele ATP2A1 5 0.8 0.799 16 3 EPB41 4 0.315 0.422 18 EXT2 1 35 7 EYA1* 0.226 0.229 335 19 FECH 14 0.365 0.364 37 PAX2* 24 0.068 0.063 183 8 SHH 0.457 0.414 207 9 SOX9* 13 0.207 0.197 321 23 SOX10* 15 0.038 0.031 192 12 TNNT2 10 0.517 0.505 36 TTN 21 0.106 0.1 63 Total (11) 146 142 1443 Those with astersiks (*) were done in triplicate Really, here, the take home message is that for all 11 genes tested, nearly all (exception of two alleles) were able to search in a pairwise way and a find the other alleles of the same gene. (in bold). YES WE CAN!!! 40
 Those with astersiks (*) were done in triplicate. Really, here, the take home message is that for all 11 genes tested, nearly all (exception of two alleles) were able to search in a pairwise way and a find the other alleles of the same gene. (in bold). YES WE CAN!!! 40.")
41
Experimental Design Annotate 11 human disease genes, and their homologs Develop search algorithm that utilizes the ontologies for comparison Test search algorithm by asking, “given a set of phenotypic descriptions (EQ stmts), can we find…” alleles of the same gene homologs in different organisms members of a pathway (same organism) members of a pathway (other organisms)
, can we find… alleles of the same gene. homologs in different organisms. members of a pathway (same organism) members of a pathway (other organisms)")
42
UBERON: an anatomical linking ontology
Each organism has its own anatomical ontology To connect annotations across species, need a way to link the anatomies Wanted an ontology that incorporated both functional homology and anatomical similarity Created an ontology linking anatomies from ZFA, FMA, XAO, MA, MIAA, WBbt, FBbt To enable these queries that annotate using different anatomical ontologies, we needed a way to connect them together. We created an “uber” anatomy ontology that brings together the anatomical parts from the different anatomy ontologies. When used in our searches, the annotations to individual anatomy terms, like fish eye and human eye can be linked together through a common “uber” eye. NEED DIAGRAM HERE 42

43
UBERON connects phenotype entities from separate anatomy ontologies
The entities that annotations were made two in mouse, human, and zebrafish are shown in orange. Then, the links between the ontology terms have been made with the aide of the UBERON ontology… each of the annotated entities can be linked through the UBERON:forebrain term. 43

44
Homologs are found by similarity search
simIC human/ mouse simIC human/ zebrafish Gene ATP2A1 0.047 0.177 EPB41 0.328 0.141 EXT2 0.067 0.050 EYA1 0.264 0.495 FECH 0.430 0.101 PAX2 0.157 0.375 SHH 0.091 0.253 SOX9 0.226 0.383 SOX10 0.380 0.443 TNNT2 0.000 0.118 TTN 0.248 0.567 Using the UBERON connections, we are able to find homologs of each of the human disease genes in mouse and zebrafish. Here, we show the similarity ratio based on information content between the human-mouse and human-zebrafish homologous gene pairs. The phenotypic profiles for each gene represent a consolidation (promotion) of the phenotypic description Eqs. Interesting things are suggested here. Its possible that some of the zebrafish homologs (EYA1, PAX2, SHH, SOX9, SOX10, TTN) might make better models than the mouse homologs for the diseases caused by the human genes. 44
 of the phenotypic description Eqs. Interesting things are suggested here. Its possible that some of the zebrafish homologs (EYA1, PAX2, SHH, SOX9, SOX10, TTN) might make better models than the mouse homologs for the diseases caused by the human genes. 44.")
45
Experimental Design Annotate 11 human disease genes, and their homologs Develop search algorithm that utilizes the ontologies for comparison Test search algorithm by asking, “given a set of phenotypic descriptions (EQ stmts), can we find…” alleles of the same gene homologs in different organisms members of a pathway (same organism) members of a pathway (other organisms)
, can we find… alleles of the same gene. homologs in different organisms. members of a pathway (same organism) members of a pathway (other organisms)")
46
shha is phenotypically similar to homologous pathway members
zebrafish shh pathway mouse homologs human homologs shha Shh SHH smo Smo disp1 Disp1 prdm1a Prdm1 hdac1 HDAC4 scube2 wnt11 Wnt1, 7b, 3a, 9b, 10b WNT6 gli1,2a Gli2, Gli3 GLI2 bmp2b Bmp4 ndr1,2 NDRG1 hhip Hhip ptc1,ptc2 Ptch1,2 Rab23 Gas1 Nck1 Zic2 notch1a Notch1,2 Gsk3b This table shows the list of genes known to be involved in the shh pathway that were retrieved with a similarity search using the zebrafish shh as bait. The list of zf genes is like that in the earlier slide. The mouse and human homologs are also indicated. For some, the mouse/human homologs were retrieved when the zf genes were not. This could be fore several reasons… the biggest reason is that much of the knowledge of the zebrafish pathway members comes from morpholino experiments. The morpholino data was not included in our initial analyses. One of the next steps is for us to include the morpholino data and redo this search. Many of the human homologs also are not annotated… These lacking annotations for the human disease genes therefore represent significant deficiencies and extremely necessary resources for biological research. The next slide shows how these genes fall in the shh pathway… 46

47
Zebrafish SHH signaling pathway
The picture is from KEGG. Their model includes the known members of the the human HH signaling pathway. Additional genes known to be involved in the zebrafish signaling pathway have been added (gli1, gli2a, hdac1, prdm1a, bmp2b, dsp1, ndr2, scube2). Ptc and Smo are transmembrane proteins thought to form a receptor complex for the Hh ligand (7, 8), and the Gli zinc-finger transcription factors have been demonstrated to have both activating and inhibitory roles in the Hh pathway (9–13). A second Ptc gene has been isolated, Ptch-2, which encodes a putative receptor for Shh (14, 15). 47
. Ptc and Smo are transmembrane proteins thought to form a receptor complex for the Hh ligand (7, 8), and the Gli zinc-finger transcription factors have been demonstrated to have both activating and inhibitory roles in the Hh pathway (9–13). A second Ptc gene has been isolated, Ptch-2, which encodes a putative receptor for Shh (14, 15). 47.")
48
Potential candidates also found
Gene Similarity Characterization dharma 0.483 Paired type homeodomain protein that has dorsal organizer inducing activity and is regulated by wnt signaling. tbx16 0.401 T-box transcription factor regulates mesenchyme to epithelial transition and LR patterning. plod3 0.387 Lysyl hydroxylase and glycosyltransferase important for axonal growth cone migration. ntl 0.382 T-box transcription factor important for notochord and mesoderm development. kny 0.374 Glypican component of the wnt/PCP pathway tll1 0.372 Metalloprotease that can cleave Chordin and increase Bmp activity. copa Cotamer vesicular coat complex important for maintenance of the Golgi and ER transport. Important for notochord differentiation. sfpq 0.369 RNA splicing factor required for cell survival and neuronal development. lama1 Basement membrane protein important for eye and body axis development. lamc1 0.367 Basement membrane protein important for eye development atp7a 0.365 Copper transporting ATPase. atp2a1 0.363 Sarcoplasmic reticulum transmembrane ATPase that mediates calcium re-uptake. flh 0.358 Homeobox gene important for notochord and epiphysis development. Anterior/posterior expression determined by wnt activity. wnt5b 0.327 Extracellular cysteine rich glycoprotein required for convergent extension movements during posterior segmentation. In addition to the known pathway members, there were many more as-yet-unlinked genes found with similar phenotypes to shha. These represent potential pathway candidates. Here we’ve summarized some likely candidates based on their characterization. This is where the real power of this method comes in… discovery! 48

49
Results thus far Annotate 11 human disease genes, and their homologs
Develop search algorithm that utilizes the ontologies for comparison Test search algorithm by asking, “given a set of phenotypic descriptions (EQ stmts), can we find…” alleles of the same gene homologs in different organisms members of a pathway (same organism) members of a pathway (other organisms)
, can we find… alleles of the same gene. homologs in different organisms. members of a pathway (same organism) members of a pathway (other organisms)")
50
Conclusions Ontologies help
Promising new directions for ontology-based phenotype annotation Promising ways for identifying novel pathway members, generating hypotheses to test at the bench

51
Acknowledgements NCBO-Berkeley Christopher Mungall Nicole Washington
Mark Gibson Rob Bruggner U of Oregon Monte Westerfield Melissa Haendel Cambridge Michael Ashburner George Gkoutos (PATO) David Osumi-Sutherland National Institutes of Health
 David Osumi-Sutherland. National Institutes of Health.")
Similar presentations


 Chitta Baral Professor of Computer Science & Engg.>")