Download presentation
Presentation is loading. Please wait.

1
Middle Atlantic Actuarial Club September 17, 2009 Baltimore, MD Shannon Brownlee, MS Senior Research Fellow, New America Foundation Overtreated: Why Too Much Medicine is Making Us Sicker and Poorer

2
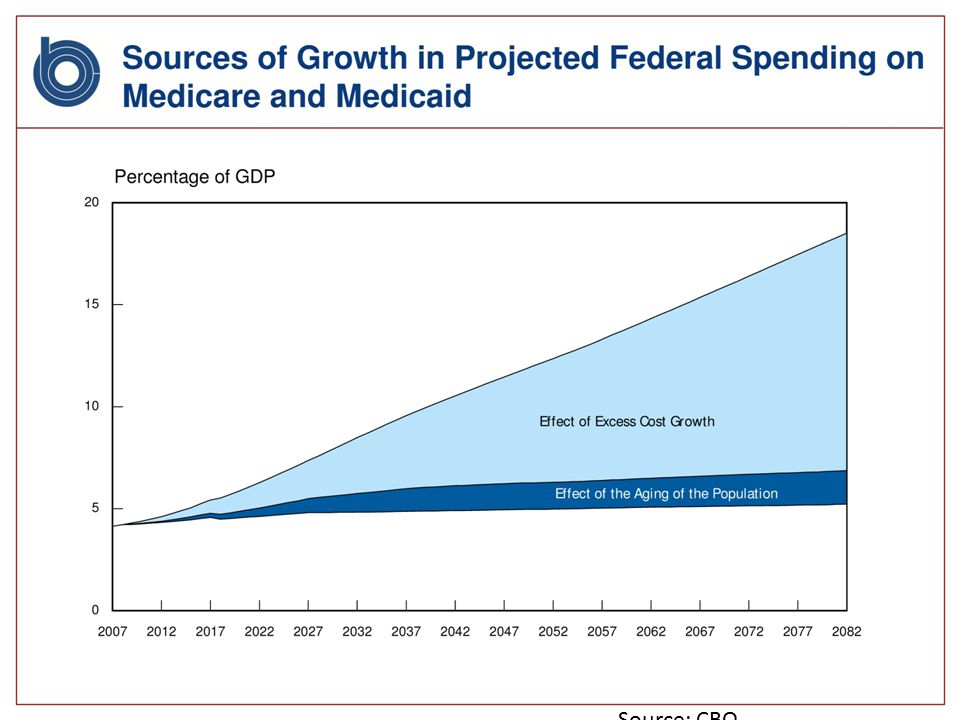
Source: CBO

4
Busting budgets MEDICARE

7
Source: WHO POOR VALUE FOR THE $$$ $$$$

9
$8,600 – 14,300 $7,800 – 8,600 $7,200 – 7,800 $6,600 – 7,200 $5,280 – 6,600 Not populated Source: Dartmouth Atlas $8,600 – 14,300 $7,800 – 8,600 $7,200 – 7,800 $6,600 – 7,200 $5,280 – 6,600 Not populated Medicare Spending per Beneficiary, 2005

10
pioneering research on variation in the delivery of healthcare services Health Affairs: most influential health policy researcher of the past 25 years 10 John Wennberg, MD, MPH., Founder, Center for Evaluative Clinical Sciences at Dartmouth Medical School

11
Preference Sensitive Care Effective Care Supply Sensitive Care Source: John E. Wennberg and Dartmouth Atlas

12
$8,600 – 14,300 $7,800 – 8,600 $7,200 – 7,800 $6,600 – 7,200 $5,280 – 6,600 Not populated Source: Dartmouth Atlas $8,600 – 14,300 $7,800 – 8,600 $7,200 – 7,800 $6,600 – 7,200 $5,280 – 6,600 Not populated Medicare Spending per Beneficiary, 2005

13
Well Bob, it looks like a paper cut, but just to be sure, let’s do lots of tests. What drives utilization?

15
Source: 2006 Dartmouth Atlas Note: Each dot represents Medicare spending in a single hospital referral region. Relationship Between Prevalence of Severe Chronic Illness and Medicare Parts A and B Reimbursements per Enrollee (2000-01)
.")
16
Source: Dartmouth Atlas Medicare Spending During Inpatient Hospitalizations per Decedent in the Last Two Years of Life Among Patients with At Least One of Nine Chronic Conditions

17
Ask your doctor if taking a pill to solve all your problems is right for you.

18
$8,600 – 14,300 $7,800 – 8,600 $7,200 – 7,800 $6,600 – 7,200 $5,280 – 6,600 Not populated Medicare Spending per Beneficiary, 2005 Source: Dartmouth Atlas $8,600 – 14,300 $7,800 – 8,600 $7,200 – 7,800 $6,600 – 7,200 $5,280 – 6,600 Not populated

19
1. Not defensive medicine -- 15 % of variation 2. Not patient demand 3. Not technology arms race 4. Local practice patterns 5. Local capacity

20
The Association Between the Supply of Cardiologists per 100,000 Residents and Visits to Cardiologists per 1,000 Medicare Enrollees (1996)
")
21
The Association Between Hospital Beds per 1,000 Residents (1996) and Discharges per 1,000 Medicare Enrollees (1995-96)
 and Discharges per 1,000 Medicare Enrollees ( )")
22
Hospital- Total FTE physician labor inputs per 1,000 decedents Total FTE specialist labor inputs per 1,000 decedents Hospital Bed inputs per 1,000 decedents ICU Bed inputs per 1,000 decedents Inpatient sector reimburs- ments per decedent NEW HAVEN 22107416$43,324 BOS- TON 29127223$50,156 MAYO 2095818$34,371 INTMT. 2084614$23,462 Source: Dartmouth Atlas Variation Among Teaching Hospitals in Resource Allocation per Chronically Ill Medicare Decedent in the Last Two Years of Life (2001-2005)
.")
23
Does higher utilization and higher spending buy better outcomes?

24
1. Lower quality 2. More hospitalizations, tests, drugs, procedures; same volume of elective surgery 3. Worse communication between physicians 4. Lower patient satisfaction 5. Worse access to care; longer waiting times 6. Worse coordination of care 7. Higher mortality Source: 2008 Dartmouth Atlas of Chronic Care

25
$8,600 – 14,300 $7,800 – 8,600 $7,200 – 7,800 $6,600 – 7,200 $5,280 – 6,600 Not populated Source: Dartmouth Atlas $8,600 – 14,300 $7,800 – 8,600 $7,200 – 7,800 $6,600 – 7,200 $5,280 – 6,600 Not populated Medicare Spending per Beneficiary, 2005

26
1. $600-$800 Billion overtreatment 2. 30,000 premature deaths

27
Fisher E et al. N Engl J Med 2009;360:849-852 Annual Growth Rates of per Capita Medicare Spending in Five U.S. Hospital- Referral Regions, 1992-2006

28
1. $600-$800 Billion overtreatment 2. 30,000 premature deaths 3. Inefficient, expensive markets are getting more so faster 4. Models for greater efficiency – Mayo, Kaiser, Billings, Geisinger 5. Other models – direct medical practice

29
1. MEDICARE: penalties, shared savings for organizing (ACO), bundled payments, direct medical practice 2. PRIVATE PAYERS: bundled payments, shared savings, direct medical practice
, bundled payments, direct medical practice 2. PRIVATE PAYERS: bundled payments, shared savings, direct medical practice.")
30
WE NEED DATA FROM BOTH MEDICARE AND PRIVATE PAYERS : 1. Utilization per 1,000 population 2. In real time

31
THE HEALTH CARE TRAIN WRECK

Similar presentations


 14.7 to19.7 (13) 12.3 to >")

 Medical Foundations & Groups Home-Based Services Hospitals.>")


>")


