Download presentation
Presentation is loading. Please wait.

1
Seasonal Usage of Off-Channel Habitats in the Entiat River by Juvenile Chinook Salmon Nicholas Albrecht and Tom Desgroseillier PIT Tag Workshop Skamania Lodge, WA January 27 th -29 th, 2015

2
Integrated Status and Effectiveness Monitoring Program (ISEMP) Design monitoring programs to address multiple management objectives Assess the status of anadromous salmonid populations, their tributary habitat, restoration, and management actions – Status and Trend Monitoring – Intensively monitored watershed (IMW) Entiat River, WA Bridge Creek, John Day River, OR Lemhi River, ID – Evaluating benefits of habitat restoration
 Design monitoring programs to address multiple management objectives Assess the status of anadromous salmonid populations, their tributary habitat, restoration, and management actions – Status and Trend Monitoring – Intensively monitored watershed (IMW) Entiat River, WA Bridge Creek, John Day River, OR Lemhi River, ID – Evaluating benefits of habitat restoration")
3
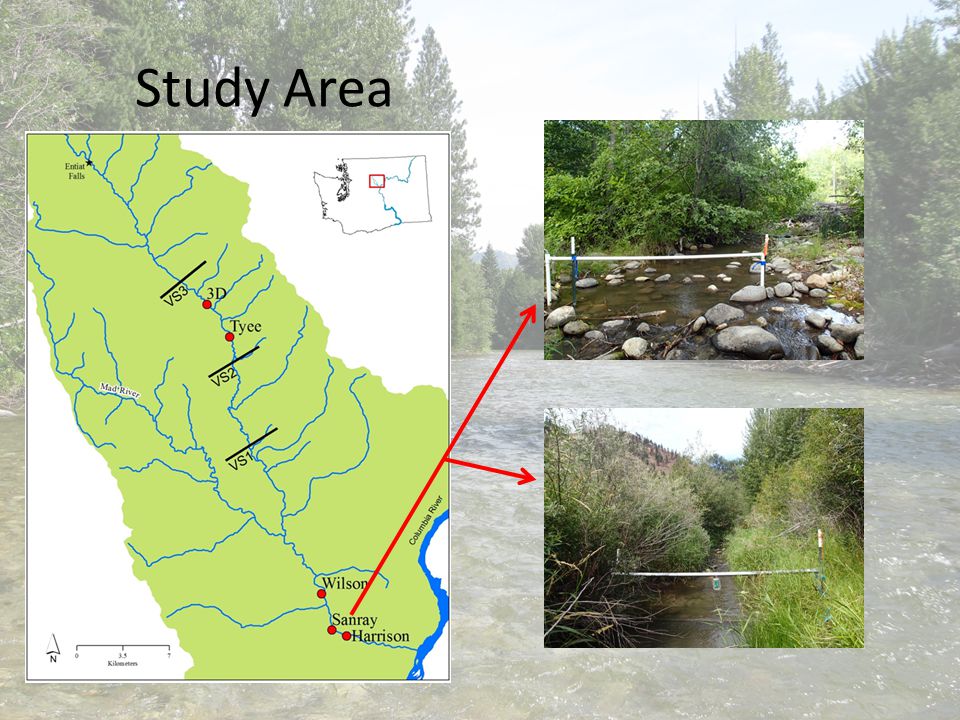
The Entiat River Basin Originates from 11 glaciers and snowfields in the Cascade Mountains 69 km Drains 1,085km 2 Supports 8 salmonid species – Chinook Salmon (Oncorhynchus. tshawytscha) – Steelhead/Rainbow Trout (O. mykiss) – Sockeye (O. nerka) – Westslope cuttroat trout (O. clacki lewisi) – Coho Salmon (O. kisutch) – Mountain Whitefish (Prosopium williamsoni) – Bull Trout (Salvelinus confluentus) – Eastern Brook Trout (S. fontinalis)
 – Steelhead/Rainbow Trout (O. mykiss) – Sockeye (O. nerka) – Westslope cuttroat trout (O. clacki lewisi) – Coho Salmon (O. kisutch) – Mountain Whitefish (Prosopium williamsoni) – Bull Trout (Salvelinus confluentus) – Eastern Brook Trout (S. fontinalis).")
4
Goals/Objectives Investigate juvenile Chinook salmon usage of 5 off- channel habitats in the Entiat River utilizing Passive Integrated Transponders (PIT) tag technology and mark-recapture methods Size Density Survival Movement/Occupation of side channels
 tag technology and mark-recapture methods Size Density Survival Movement/Occupation of side channels")
5
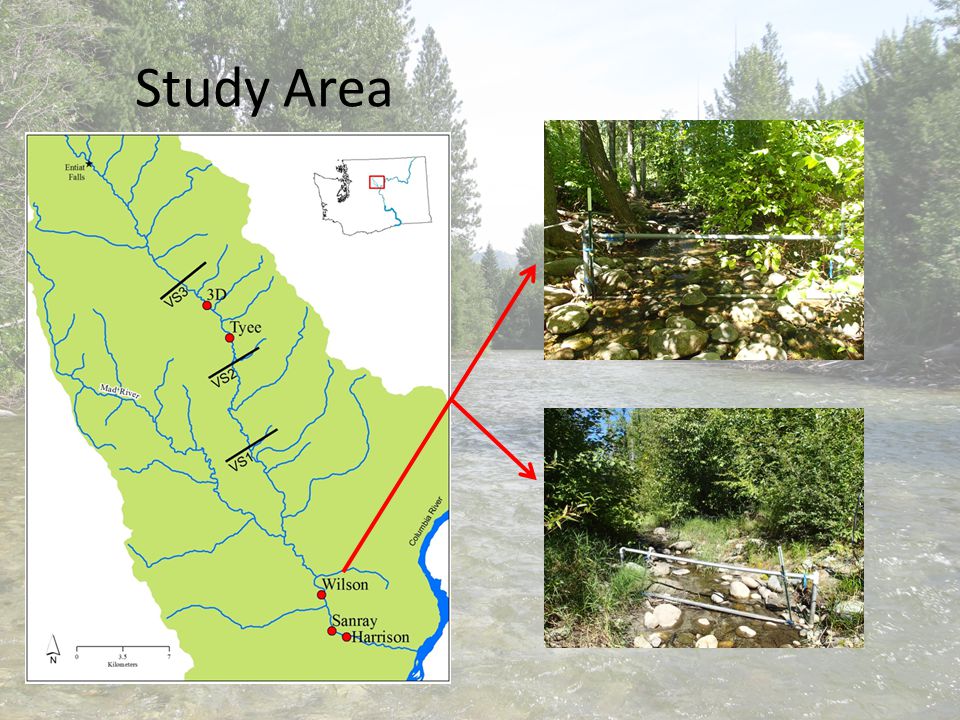
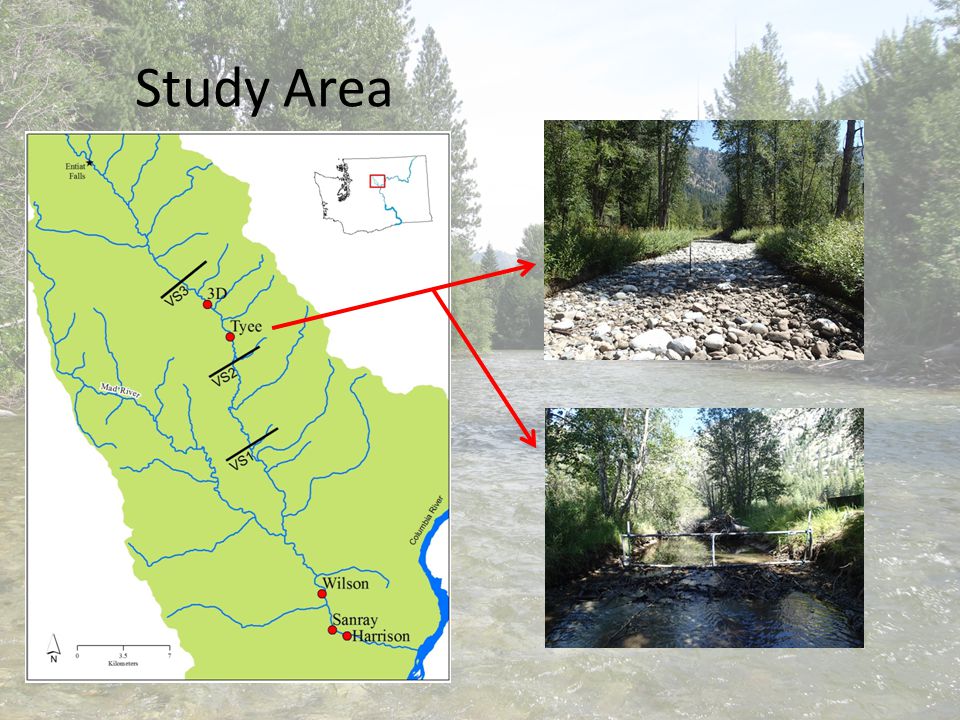
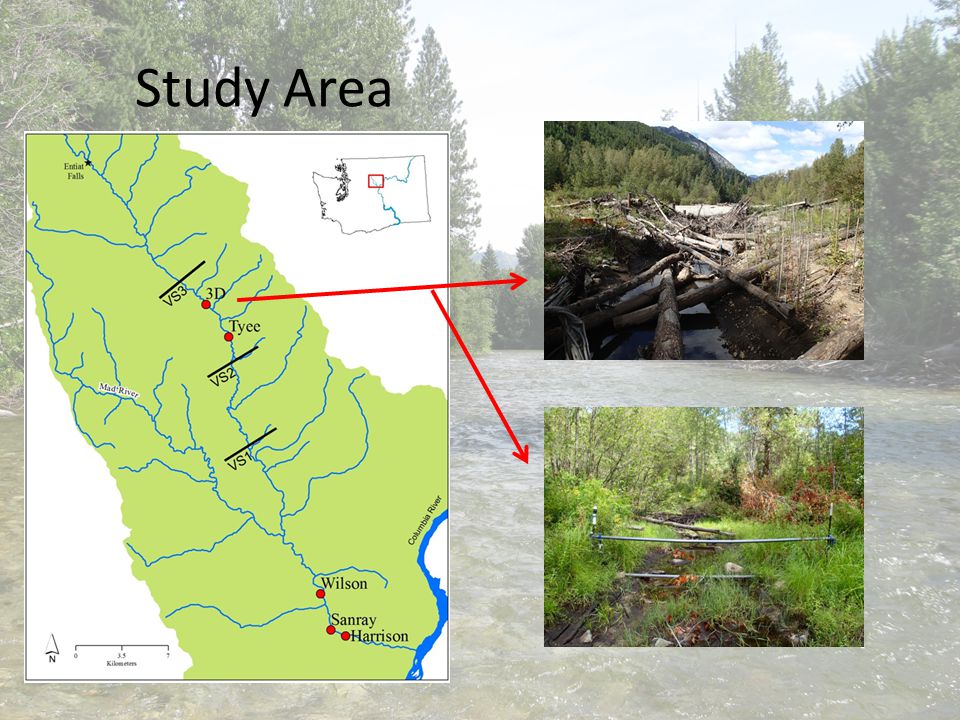
Study Area

10
Methods Sampling was done for 1 cohort of age-0 Chinook salmon from August 2013-April 2014 – Mainstem – Summer/Winter – Off-channel – Summer/Fall/Winter Population abundance was determined using mark-recapture methodoloy and estimated using Chapman-Petersen Method N = ((n 1 +1)(n 2 +1)/(m 2 +1 2 ))-1 Lengths and weights were taking on all fish All fish >50mm were PIT tagged
(n 2 +1)/(m ))-1 Lengths and weights were taking on all fish All fish >50mm were PIT tagged")
11
Methods Barker Model 1 model with 5 groups (side channels) Model Selection Selection using evidence (weight) ratio that was derived from Quasi-likelihood Akaike Information Criterion adjusted for over-dispersion (QAIC) Goodness of fit was measured using bootstrapping Model was adjusted using c-hat
 Model Selection Selection using evidence (weight) ratio that was derived from Quasi-likelihood Akaike Information Criterion adjusted for over-dispersion (QAIC) Goodness of fit was measured using bootstrapping Model was adjusted using c-hat")
12
Results Summer – 3D>SanRay>Wilson’s>Tyee=Harrison’s Fall – 3D=SanRay>Wilson’s=Harrison’s>Tyee Winter – Tyee=Wilson’s

13
Summer – ANOVA: F-value=153.110 p=<.001 – VS3 was significantly different from 3D (p<0.001) and Tyee (p<0.001) in the summer – 3D>VS3>Tyee Winter – ANOVA: F-value=26.338 p=<.001 – Fork Length in VS3 was significant greater than Tyee (p<0.001)
 and Tyee (p<0.001) in the summer – 3D>VS3>Tyee Winter – ANOVA: F-value= p=<.001 – Fork Length in VS3 was significant greater than Tyee (p<0.001)")
14
Summer – ANOVA: F-value=153.110 p=<.001 – VS1 was significantly different from Wilson’s (p=0.009), San Ray (p=0.003), and Harrison’s (p<0.001) – San Ray>VS1>Wilson’s>Harrison’s Winter – ANOVA: F-value=26.338 p=<.001 – Fork Length in VS1 was significant great than Wilson’s (p<0.001)
, San Ray (p=0.003), and Harrison’s (p<0.001) – San Ray>VS1>Wilson’s>Harrison’s Winter – ANOVA: F-value= p=<.001 – Fork Length in VS1 was significant great than Wilson’s (p<0.001)")
15
Summer – 3D>SanRay>Wilson’s>Tyee=Harrison’s Fall – 3D>SanRay=Harrison’s=Wilson’s>Tyee Winter – Tyee=Wilson’s

16
Summer – ANOVA: F-value=119.660 p=<.001 – VS3 was significantly different from 3D (p<0.001) and Tyee(p<0.001) – 3D>VS3>Tyee Winter – ANOVA: F-value=16.1978 p=<.001 – Weight in VS3 was significant greater than Tyee (p<0.001)
 and Tyee(p<0.001) – 3D>VS3>Tyee Winter – ANOVA: F-value= p=<.001 – Weight in VS3 was significant greater than Tyee (p<0.001)")
17
Summer – ANOVA: F-value=119.660 p=<.001 – VS1 was significantly different from Wilson’s (p<0.001), and Harrison’s (p<0.001), but not San Ray (p=1.000) – San Ray=VS1>Wilson’s>Harrison’s Winter – ANOVA:F-value=16.197.338 p=<.001 – Weight in VS1 was significant greater than Wilson’s (p<0.001)
, and Harrison’s (p<0.001), but not San Ray (p=1.000) – San Ray=VS1>Wilson’s>Harrison’s Winter – ANOVA:F-value= p=<.001 – Weight in VS1 was significant greater than Wilson’s (p<0.001)")
18
SiteSlopeInterceptR2R2 Weight of 50mm Weight of 100mm 3D3.21-5.33.941.312.3 Tyee3.34-5.59.941.212.2 Wilson’s3.13-5.22.971.311.3 SanRay3.10-5.14.881.311.4 Harrison’s3.22-5.38.861.211.6

19
SiteSlopeInterceptR2R2 Weight of 50mm Weight of 100mm 3D2.68-4.33.851.6910.82 Tyee3.11-5.18.951.2811.10 Wilson’s3.09-5.17.941.2410.67 SanRay3.28-5.51.921.1711.37 Harrison’s3.01-5.00.981.3511.00

20
Density

21
Survival

22
Movement/Occupation 3D SummerFall

23
Movement/Occupation Tyee SummerFall

24
Movement/Occupation Wilson’s SummerFall

25
Movement/Occupation San Ray SummerFall

26
Movement/Occupation Harrison’s SummerFall

27
Conclusions Length/Weight differences between side channels Difference in overwinter survival between side channels in VS3 and VS1 Fish densities varying by site and season Movement/Occupation of side channels varies between side channels in VS3 and VS1

28
Future Directions Continue monitoring the current side channels Add additional side channels Conduct genetic analysis to determine the run-type of juvenile chinook utilizing the off- channel habitats Examine the effects of habitat

29
Questions?

Similar presentations
 Casey Baldwin RTT Chairperson WDFW Research Scientist.>")


 Jim Geiselman - BPA.>")


