Download presentation
Presentation is loading. Please wait.

1
Graphing Linear Functions in Standard and Slope Intercept Form

2
Break Into Groups Group Leaders: – Elaina – Kaeori – Kyle – Megan – Alex N – Kevin S – Riley – Kali You will need an expo marker for today. Group leaders: Locate and move to a table. Everyone else: choose a group leader. 4 to a group maximum

3
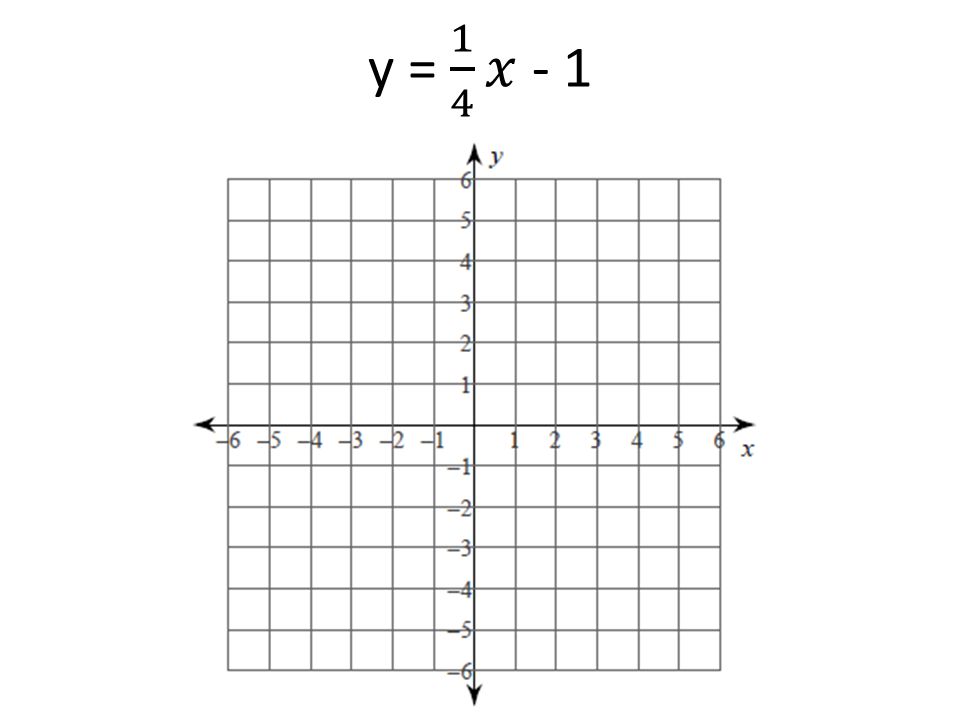
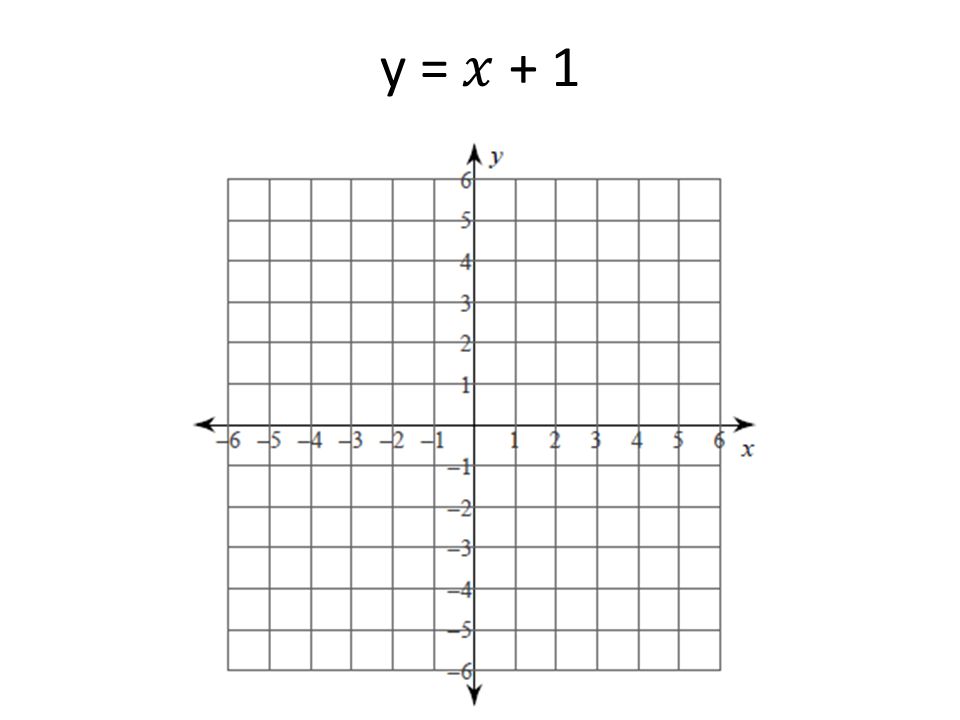
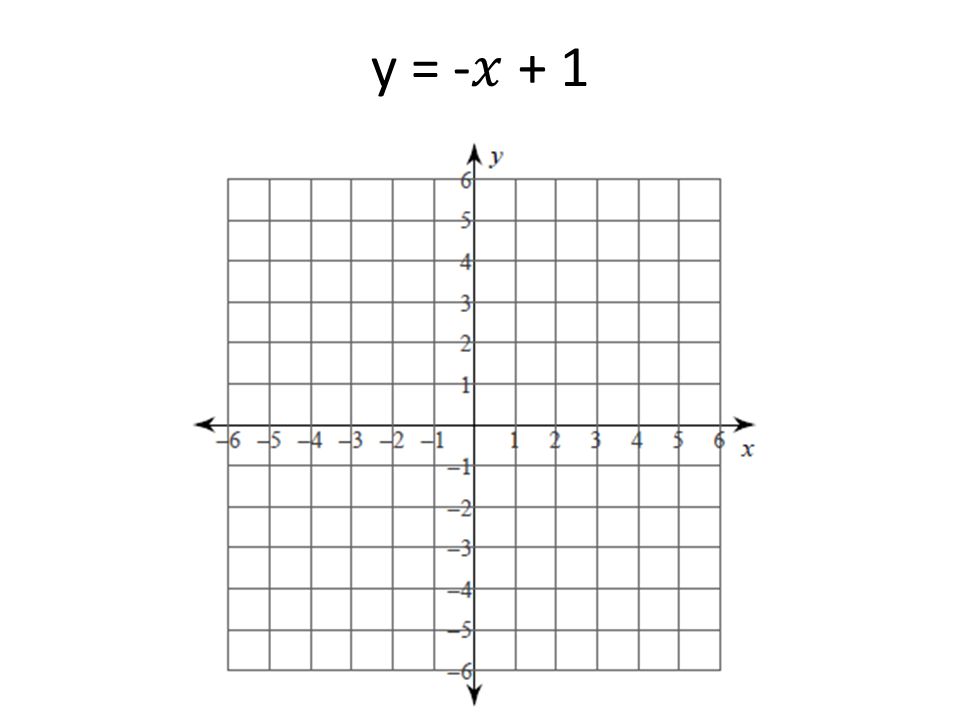
Graphing in Slope Intercept The way the equation is written tells you all you need to know to graph the relationship y = mx + b slope y intercept

10
y = 2x

11
y = -2x

12
Graphing in Standard Form This form does not tell us much about its graph. We need to use x and y intercepts to produce a graph. Substitute x = 0 to find the y intercept (0, y) Substitute y = 0 to find the x intercept (x, 0)
 Substitute y = 0 to find the x intercept (x, 0).")
13
x + y = -3

20
2x + y = 4

21
3x + 6y = 12

22
-2x + -3y = -6

23
-5x + 3y = -15

Similar presentations


 (x₁, y₁) An ordered pair on the line m slope.>")
 (x₁, y₁) An ordered pair on the line m slope.>")

