Download presentation
Presentation is loading. Please wait.

2
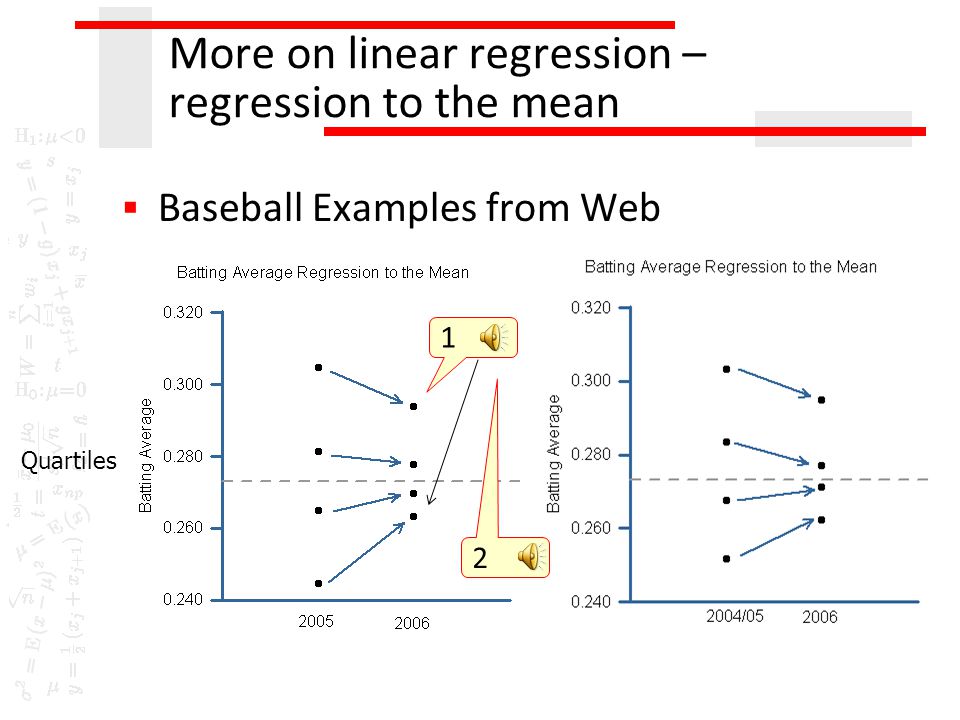
More on linear regression – regression to the mean Baseball Examples from Web Quartiles 1 2

3
More on linear regression – regression to the mean What causes regression to the mean? What causes the extreme score? Random variation (chance)? True score? A bit of each…the more random variation there is, the more regression to the mean will occur Example: Think of 2 exams…in each of 2 cases Case 1: Exam 1 and exam 2 scores totally determined by ability Case 2: Exam 1 and exam 2 scores determined 50% by ability, 50% by chance variation (feeling good , knew that question , misunderstood a word , etc) KNR 445 Regression: slide 2 1 2
. True score. A bit of each…the more random variation there is, the more regression to the mean will occur Example: Think of 2 exams…in each of 2 cases Case 1: Exam 1 and exam 2 scores totally determined by ability Case 2: Exam 1 and exam 2 scores determined 50% by ability, 50% by chance variation (feeling good , knew that question , misunderstood a word , etc) KNR 445 Regression: slide")
4
Exam 1 Exam 2 2 More on linear regression – regression to the mean Correlate exam 1 with exam 2 in each case: Case 1:Case 2: KNR 445 Regression: slide 3 1

5
What if we take z-scores of each variable? More on linear regression – regression to the mean KNR 445 Regression: slide 4 1 2 4 Intercept now = 0 Slope now = r 5 6 3

6
More on linear regression – regression to the mean So, regression to the mean is proportional to r…useful to know in situations when post-test scores and pre-test scores are not perfectly correlated (all the time!) Means outliers on the pre-test will generally drift towards the mean on the post-test Originally demonstrated by Galton with offspring (taller parents had kids that were in general closer to mean height) This is actually where the term regression came from in the procedure See “the sophomore sink” and “but I regress” (web site) Used in all good fantasy sport estimators 1
 Means outliers on the pre-test will generally drift towards the mean on the post-test Originally demonstrated by Galton with offspring (taller parents had kids that were in general closer to mean height) This is actually where the term regression came from in the procedure See the sophomore sink and but I regress (web site) Used in all good fantasy sport estimators 1")
7
E.G. – Tattoos & workout time The thing we are trying to predict – workout time The predictor - # tattoos 1 2

8
E.G. - Output First box is just telling you what you analyzed - 2 nd box is quite informative – let’s look at that 1 2

9
E.G. - Output 4. 68% of people’s predicted # hours workout time will fall +/- 3.35 of the value predicted using regression equation 3. Adjusts the R2 value based on sample size…small samples tend to overestimate the ability to predict the DV with the IV 1. Pearson’s r correlation between the two variables 2. Coefficient of Determination - % of variance in workout hours accounted for by # tattoos

10
E.G. – Output (continued) 1. ANOVA stuff – that’s after the midterm. For now, note that the two procedures give you the same answer 2. Still significant... 3. Intercept, slope 4. a) Intercept different from 0? b) Is this relationship reliable (significant, greater than chance, etc...)?
 Intercept different from 0. b) Is this relationship reliable (significant, greater than chance, etc...) .")
11
3 E.G. – Output (continued) How effectively can we predict a (male) person’s workout hours per week from the number of tattoos he has? Answer/interpretation: A simple linear regression was calculated predicting males’ workout hours per week from their number of tattoos. A significant regression equation was found (F(1,53) = 7.27, p<.05), explaining 12.1% of the variance in workout hours. People’s workout hours are equal to 5.21 +.90 times the number of tattoos they have. Males’ workout hours increase by.90 hours for each additional tattoo they possess. Weird! Next time… 1 2
 How effectively can we predict a (male) person’s workout hours per week from the number of tattoos he has. Answer/interpretation: A simple linear regression was calculated predicting males’ workout hours per week from their number of tattoos. A significant regression equation was found (F(1,53) = 7.27, p<.05), explaining 12.1% of the variance in workout hours. People’s workout hours are equal to times the number of tattoos they have. Males’ workout hours increase by.90 hours for each additional tattoo they possess. Weird. Next time… 1 2.")
Similar presentations


 correlation coefficient r.>")


