Download presentation
Presentation is loading. Please wait.

1
Comparison of Five Different Methods for Determining Pile Bearing Capacity by Jim Long, Univ. of Illinois Wisconsin DOT February 6, 2009 Madison, WI

2
Agenda Discuss Objectives/Tasks of Project General Approach Specifics –Prediction Methods Investigated –Databases used for Assessment –Interpretation of Data Assessment of Predictive methods Improved Method Implementation into LRFD

3
Objective To quantify the ability of the five methods (Wisc- EN, FHWA-Gates, PDA, corrected Gates, WS- DOT) for predicting pile bearing capacity in a way that allows Wisconsin DOT to assess when or if it is appropriate to use each of the methods and to confidently estimate the reliability/safety and economy associated with each method.
 for predicting pile bearing capacity in a way that allows Wisconsin DOT to assess when or if it is appropriate to use each of the methods and to confidently estimate the reliability/safety and economy associated with each method.")
4
Tasks Task 1 - Literature Review Task 2 - Data Collection –Collect pile information from the Marquette Interchange –Collect pile information from other past projects of WisDOT –Collect pile information from the PI’s on Collection of pile load tests –Catalog the character of the load test information Task 3 – Analysis –Quantify the ability of EN, Gates, and PDA to agree with capacity from static load tests –Quantify the ability of EN, Gates, to agree with capacity from PDA, and quantify agreement between EN and Gates –Identify limitations to the Gates method –Develop an improved modified Gates –Assess Washington State DOT method developed by Allen –Identify efficiency and impact of using promising methods compared to EN formula Task 4 - Report Submission

5
Studies Collected for DB#1 Flaate (1964) Olson and Flaate (1967) Fragaszy (1988, 1989) Paikowsky (1994) Davidson (1996) FHWA/Long (2001) NCHRP 507 and Allen(2005/2007)
 Olson and Flaate (1967) Fragaszy (1988, 1989) Paikowsky (1994) Davidson (1996) FHWA/Long (2001) NCHRP 507 and Allen(2005/2007)")
6
Database 1 (all cases SLTs)
")
7
Results for 5 predictive methods based on DB#1 EN-Wisc FHWA-Gates FHWA-Gates (corr) PDA Washington DOT (Allen)
 PDA Washington DOT (Allen)")
8
Wisconsin - EN formula c = 0.2 for Wisconsin Most states use built-in division by 6 to get allowable bearing by specifying H in ft, and s in inches. Study shows that the estimate ends up to be about a FS = 3.1 wrt ultimate capacity.

10
Methods – Gates formula Gates modified by FHWA Gates modified in this Study

13
Effect of Corrected Gates

14
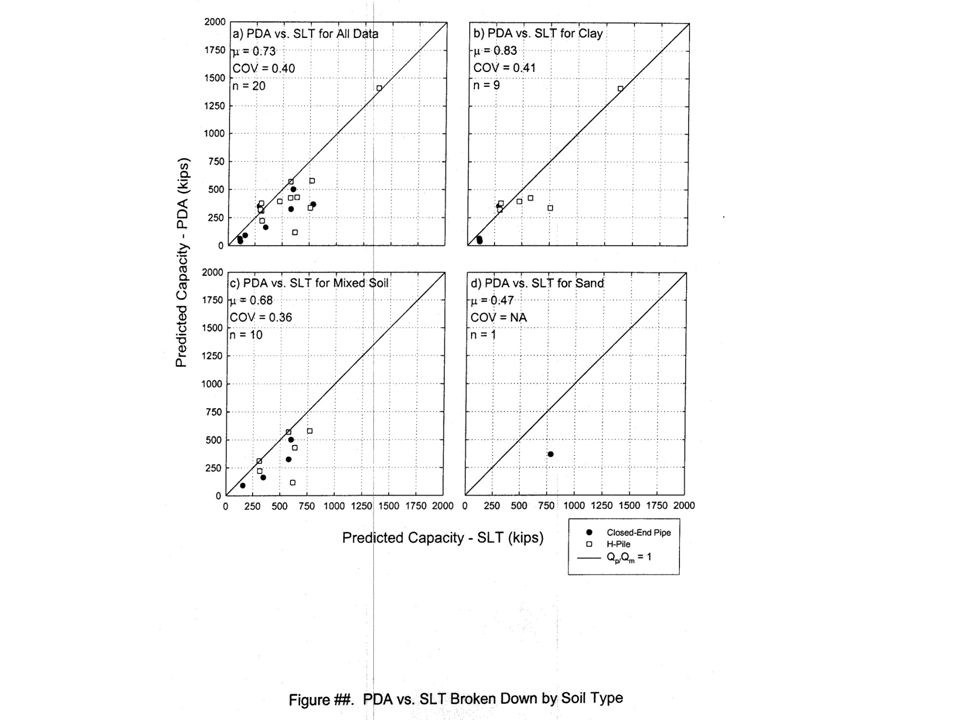
PDA Based on measurement of strain and velocity in the pile during driving Case method is applied – details in Report There are different interpretation methods available and different damping values that can be applied – makes the method more adaptable to local conditions, but also makes the method non-standard. Advantages – can determine energy going into pile Disadvantage – does not account for setup – determines capacity at the time of driving

16
Methods – Wash DOT (Allen) where F eff = Hammer efficiency factor 0.55 for Air/Steam – all piles 0.47 for OED with steel piles 0.35 for CED with all piles 0.37 for OED with concrete or timber piles N b = Number of blows/in E = hammer energy in ft-kips Q ult = Ultimate pile capacity (kips)
 where F eff = Hammer efficiency factor 0.55 for Air/Steam – all piles 0.47 for OED with steel piles 0.35 for CED with all piles 0.37 for OED with concrete or timber piles N b = Number of blows/in E = hammer energy in ft-kips Q ult = Ultimate pile capacity (kips)")
20
Statistical Results Q P /Q M Mean COV Method 0.43 0.47 Wisc-EN 1.11 0.39 WSDOT 1.13 0.42 FHWA-Gates 0.73 0.40 PDA 1.20 0.40 FHWA-Gates for all piles <750 kips 1.02 0.36 corrected FHWA-Gates <750 kips

21
Observations In terms of scatter –corrected Gates (least scatter, limited to <750k) –WSDOT –FHWA-Gates (<750k), PDA –EN (greatest scatter) Trend for Gates is to underpredict at higher capacity and overpredict at lower capacity – address issue by restricting capacity < 750k
 –WSDOT –FHWA-Gates (<750k), PDA –EN (greatest scatter) Trend for Gates is to underpredict at higher capacity and overpredict at lower capacity – address issue by restricting capacity < 750k")
22
Database 2 – DB2 Two sets of Data Collected –Wisc(JHL) 220 piles in which there are estimates of capacity from dynamic pile behavior –Wisc (MI) Marquette Interchange – collection of 96 piles. Estimates can be made with all dynamic methods. PDA and CAPWAP results for BOR. –few static load tests

23
DB2

30
PDA EOD results with PDA determine the capacity of pile at the time of driving BOR results determine capacity at beginning of restrike BOR better accommodates effects of setup CAPWAP for BOR provides even better estimate of pile capacity

32
DB2 - Emphasis will be on data in which there are estimates of capacity based on CAPWAP (BOR)
")
37
Summary Tables

39
LRFD – Resistance Factors two approaches (FOSM, FORM) Determines the resistance factor necessary for a target reliability (index) unknowns accounted for in both loads and resistance variables –pred method (bias and cov) –loads (bias and cov) –target reliability (beta = 2.0, 2.5, 3.0) based on NCHRP 507
 Determines the resistance factor necessary for a target reliability (index) unknowns accounted for in both loads and resistance variables –pred method (bias and cov) –loads (bias and cov) –target reliability (beta = 2.0, 2.5, 3.0) based on NCHRP 507")
40
Resistance Factors - FOSM R = bias factor (which is the mean value of QM/QP ) for resistance COV QD = coefficient of variation for the dead load COV QL = coefficient of variation for the live load COV R = coefficient of variation for the resistance T = target reliability index D = load factor for dead loads L = load factor for live loads Q D /Q L = ratio of dead load to live load QD, QL = bias factors for dead load and live load
 for resistance COV QD = coefficient of variation for the dead load COV QL = coefficient of variation for the live load COV R = coefficient of variation for the resistance T = target reliability index D = load factor for dead loads L = load factor for live loads Q D /Q L = ratio of dead load to live load QD, QL = bias factors for dead load and live load")
42
LRFD – Resistance Factors

43
LRFD – Efficiency

44
Since Report Submission We submitted report in June, 2008 We have been continuing to work with IDOT reanalyzing and reviewing more data and methods If we look at the same data as we have for WSDOT, and “Fit the tail of the distribution”, we can justify higher resistance factors

46
Effect of Fit to Tail For = 2.33 FORM Original Fit to Value Tail FHWA-Gates 0.42 0.46-0.50 Corrected Gates 0.54 0.54-0.63 WSDOT 0.46 0.56-0.59

Similar presentations


 and functional.>")


 foundations Square>")