Download presentation
Presentation is loading. Please wait.

1
Owens & Minor

2
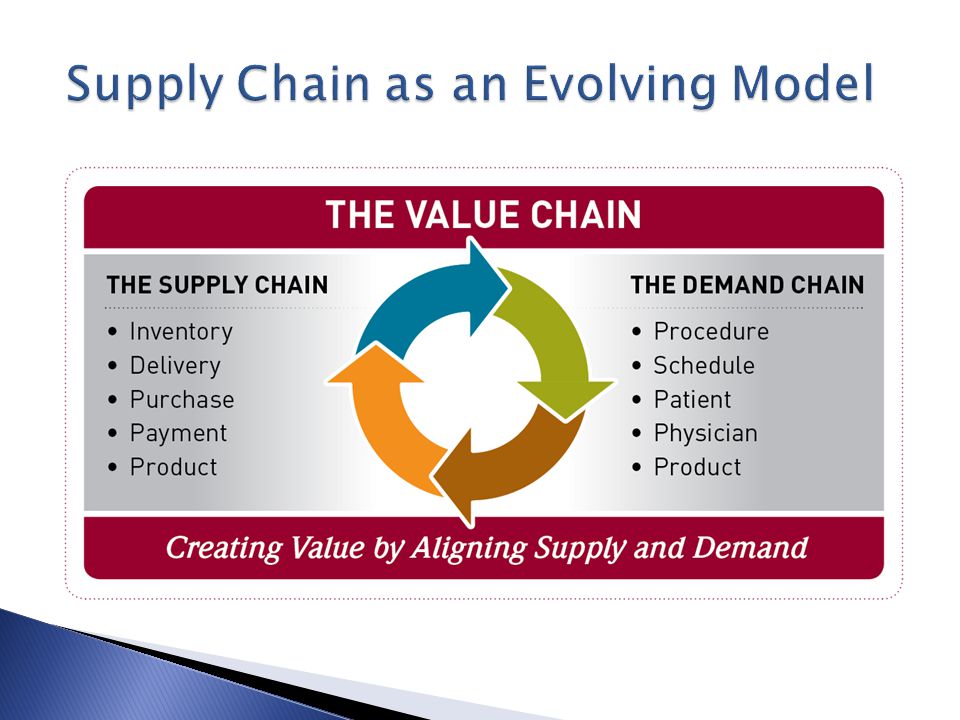
Market dynamics and the developing trends. What is the Supply Chain continuum? How to baseline & the benefits of moving towards best practice. Supply Chain as an Evolving Model.

3
2 Health reform impact on Supply Chain? Future of Supply Chain? External ways to increase efficiencies in our organizations? How to improve quality and reduce costs? Optimize the different distribution channels? Model of the Future Proactive Supply Chains Aggregation

4
Market forces are accelerating industry-wide change: ◦ Future driven by Payors and payment structure ◦ Margin pressures increasing significantly across all trading partners ◦ Competitive lines are blurring 3

5
Pharm Linen Office Med/Surg Devices MRO/Jan- San

6
- Bulk - Pallet Architecture - Cross Docking - JIT / Totes - Par Optimization - 3PL model - Clinical Inventory - JIT to the OR Joint/Self Contracting Labor Activity Savings Labor Activity Savings Labor Activity Savings Supply Savings -Bill-Only (Implant) Management Labor Activity Savings Labor Activity Savings -Transportation -Physician Clinics/ Non-Acute
 Management Labor Activity Savings Labor Activity Savings -Transportation -Physician Clinics/ Non-Acute")
7
6 ISC Integrated Service Center

8
How to Baseline

9
Executive Scorecard - Summary Descriptions Base Proposed Impact FTEs33.00Expense20.80Expense(12.20)Expense Wages & Benefits $1,639,145 $1,032,850 ($606,295) Overtime & Benefits $5,150 1,725 (3,426) Wages, OT & Benefits $1,644,295 $1,034,574 ($609,721) Inventory Investment$7,166,972 $5,842,462 ($1,324,510) Cost of Capital $430,018 $350,548 ($79,471) Inventory Shrinkage $179,174 $87,637 (91,537) Inventory Carrying Cost $609,193 $438,185 (171,008) Freight Expense $420,000 $200,000 (220,000) Additional Expense (AOP Par Ex) $0 $71,400 71,400 Facility Expense $1,363,250 0 Other Facility, equipment $337,000 0 Total Expense $4,373,738 $3,444,409 ($929,329) Distribution Cost Plus $475,000 $660,000 $185,000 Activity Fee $0 $110,000 110,000 Other Distribu.- Cost Plus $128,250 $228,250 100,000 Other Distributors' - Fees $0 0 Distribution Expense 603,250 998,250 395,000 Fully loaded customer & distributor costs $4,976,988 $4,442,659 ($534,329) One-Time Inventory Savings $7,166,972 $5,842,462 ($1,324,510 ) Ongoing process savings $4,976,988 $4,442,659 ($534,329) How to Baseline
Expense Wages & Benefits $1,639,145 $1,032,850 ($606,295) Overtime & Benefits $5,150 1,725 (3,426) Wages, OT & Benefits $1,644,295 $1,034,574 ($609,721) Inventory Investment$7,166,972 $5,842,462 ($1,324,510) Cost of Capital $430,018 $350,548 ($79,471) Inventory Shrinkage $179,174 $87,637 (91,537) Inventory Carrying Cost $609,193 $438,185 (171,008) Freight Expense $420,000 $200,000 (220,000) Additional Expense (AOP Par Ex) $0 $71,400 71,400 Facility Expense $1,363,250 0 Other Facility, equipment $337,000 0 Total Expense $4,373,738 $3,444,409 ($929,329) Distribution Cost Plus $475,000 $660,000 $185,000 Activity Fee $0 $110, ,000 Other Distribu.- Cost Plus $128,250 $228, ,000 Other Distributors - Fees $0 0 Distribution Expense 603, , ,000 Fully loaded customer & distributor costs $4,976,988 $4,442,659 ($534,329) One-Time Inventory Savings $7,166,972 $5,842,462 ($1,324,510 ) Ongoing process savings $4,976,988 $4,442,659 ($534,329) How to Baseline")
11
Why Reduced supply spend Optimized labor Elimination of inventory Improved profitability per procedure Example: Perioperative Locations Goal Transform from a reactive supply chain to a proactive demand chain

12
11 Distributor Model High volume <$800/unit Low complexity Nearly 100% - GPO contracting Uncomplicated use Private label Minimal direct sales Manufacturer Direct Low to moderate volume >$800/unit High to very high complexity Direct sales force High prevalence of local contracting Complicated use Mostly sold direct 2012 O&M research, estimates AHA, Gartner Research, 2011 35%65% By volume: 75% Distribution / 25% Direct

13
12 2012 O&M research, estimates 40% Distributor Model + Fee for Service Manufacturers increased reliance on more effective supply chains to service providers Increase Flexibility Lower Cost Improve Visibility 60% Manufacturer Direct Downward pressure on revenues /margins forces re-evaluation of SG&A inventory & DSO elements Address changing customer needs AHA, Gartner Research, 2011

14
13 Health reform impact on distribution? Future of distribution? External ways to increase efficiencies in our organizations? How to improve quality and reduce costs? Optimize the different distribution channels? Identify logistics service partners; separate out manufacturers/wholesalers Invest in technology & interfaces to connect schedule, care & replenishment Eliminate ownership as a condition of management; consider novel investments

Similar presentations


>")


>")
 Other Sources of Revenue (34%)>")
