Download presentation
Presentation is loading. Please wait.

1
‘Reinsurance Bad Debt’ By Peter Matthews & Paul Murray CAS Reserving Seminar September 18th 2000 September 18th 2000

2
Reinsurance Bad Debt Reserve for the risk of non-realisation of the full value of current and projected reinsurance recoveries

3
Security Risks Slow payments Disputes Liquidations Run-offs Inadequate commutation receipts Non-payment by intermediaries

4
USA Insolvencies v Combined Loss Ratios Source: A.M.Best-Insolvencies / Swiss Re - Loss Ratios

5
Source: A.M.Best Historical USA Insolvency Rate

6
Broad Brush Approach 1 Bad Debt = % of Future R/I Recoveries + Ledger Unpaid Balance Write-Off

7
Broad Brush Approach 2 Assume X% future annual default rate (say 1%) Discount future R/I recoveries at X% p.a. (PV1) Bad Debt =Undiscounted Future R/I Recoveries - PV1 + Ledger Unpaid Balance Write-Off
 Bad Debt =Undiscounted Future R/I Recoveries - PV1 + Ledger Unpaid Balance Write-Off.")
8
Broad Brush Approach Advantages Disadvantages Easy to calculate and explain No need to understand R/I program Not reinsurer specific Difficult to justify No use of R/I structure No use of agency security ratings (AM Best, S&P, Moody’s) Cannot measure or change influence of any one individual reinsurer Cannot react to individual large loss scenarios Cannot be used for commutation purposes
 Cannot measure or change influence of any one individual reinsurer Cannot react to individual large loss scenarios Cannot be used for commutation purposes")
9
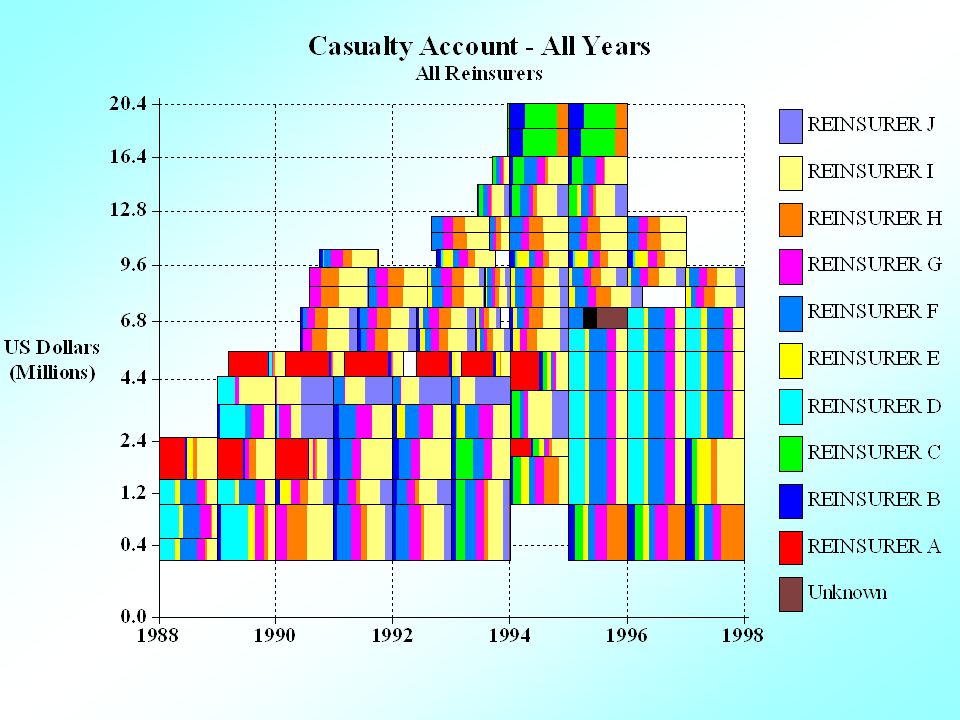
A More Detailed Approach Understand outwards programs Estimate ultimate outwards claims recoveries Identify the reinsurers behind each outwards contract Allocate security risk factor to each reinsurer Sum over all reinsurers and contracts

10
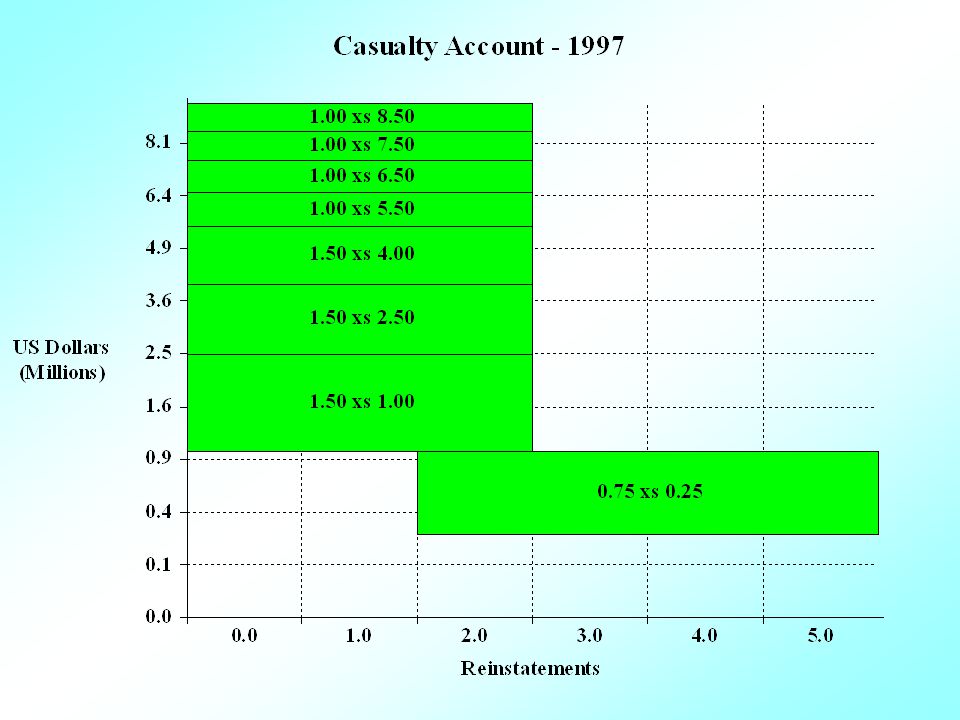
Structure of Outwards Reinsurance Program Property XL Property Property QS General XL Whole Account XL Casualty XL Casualty Casualty QS Aviation Marine

12
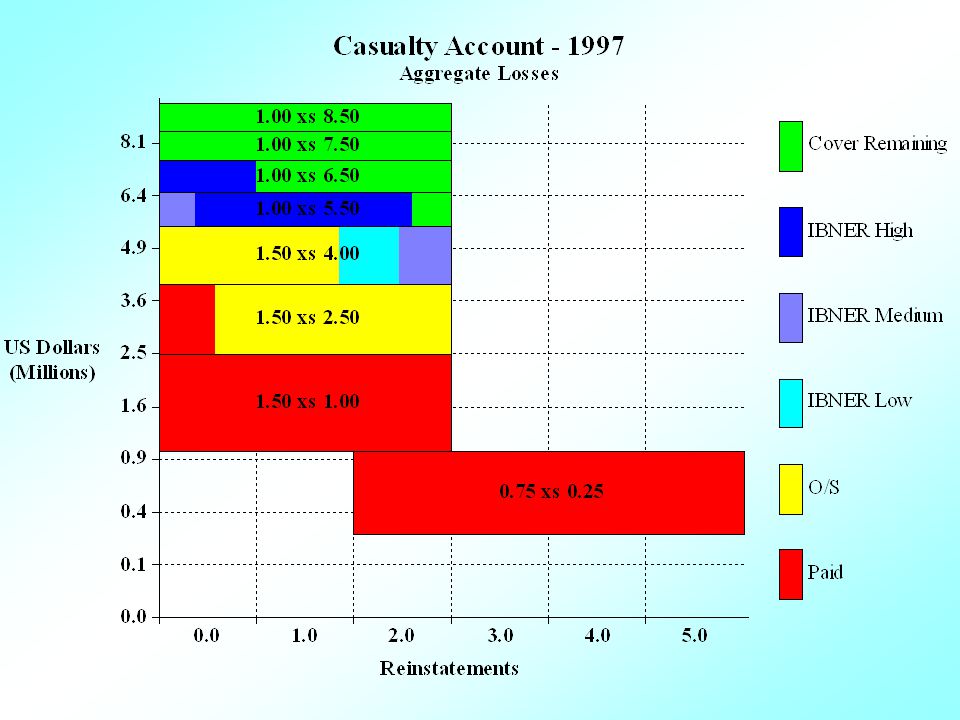
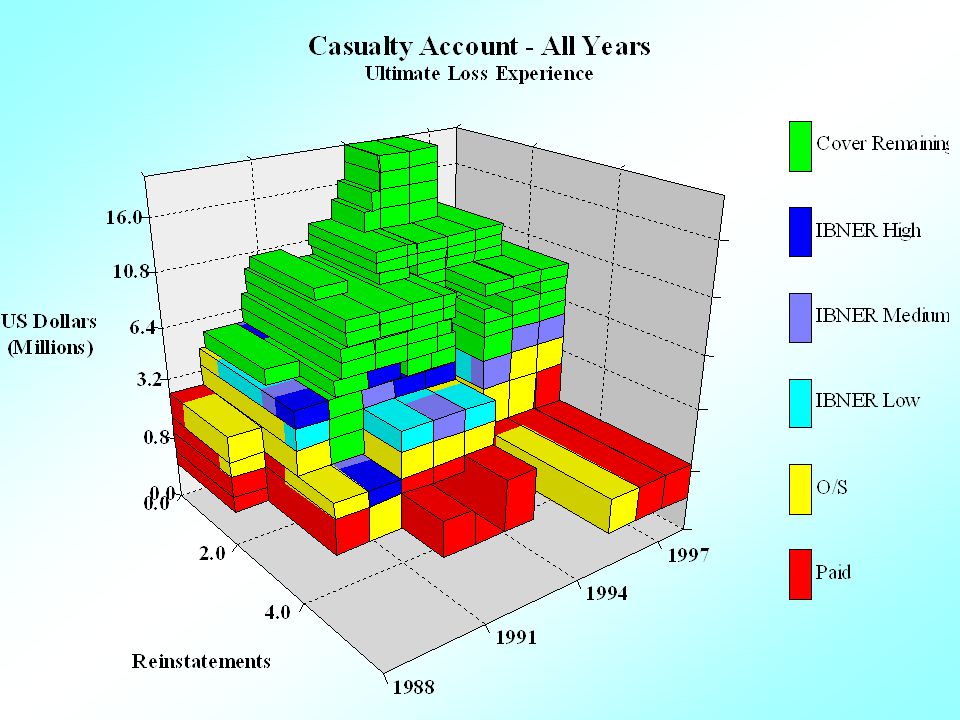
0.0 0.1 0.4 0.9 1.6 2.5 3.6 4.9 6.4 8.1 US Dollars (Millions) 0.01.02.03.04.05.0 Reinstatements Casualty Account - 1997 Evented Losses 1.50 xs 1.00 1.50 xs 2.50 1.50 xs 4.00 1.00 xs 5.50 1.00 xs 6.50 1.00 xs 7.50 1.00 xs 8.50 0.75 xs 0.25 Cover Remaining Loss 1 Loss 2 Loss 3 Loss 4 Loss 5 Loss 6 Loss 7
 Reinstatements Casualty Account Evented Losses 1.50 xs xs xs xs xs xs xs xs 0.25 Cover Remaining Loss 1 Loss 2 Loss 3 Loss 4 Loss 5 Loss 6 Loss 7")
14
Loss Types Projected Events – Hurricanes, Earthquakes, Air Disasters Aggregate Losses – Asbestos by Insured Evented Losses not individually projected Attritional Losses – Quota Share

15
Estimate R/I Recoveries Projected events Aggregate losses Other evented losses Attritional losses Review results - Apply Class Incurred to Ultimate Factors and present to R/I Program - Apply Class Incurred to Ultimate Factors and present to Proportional R/I Program } Present to R/I Program

16
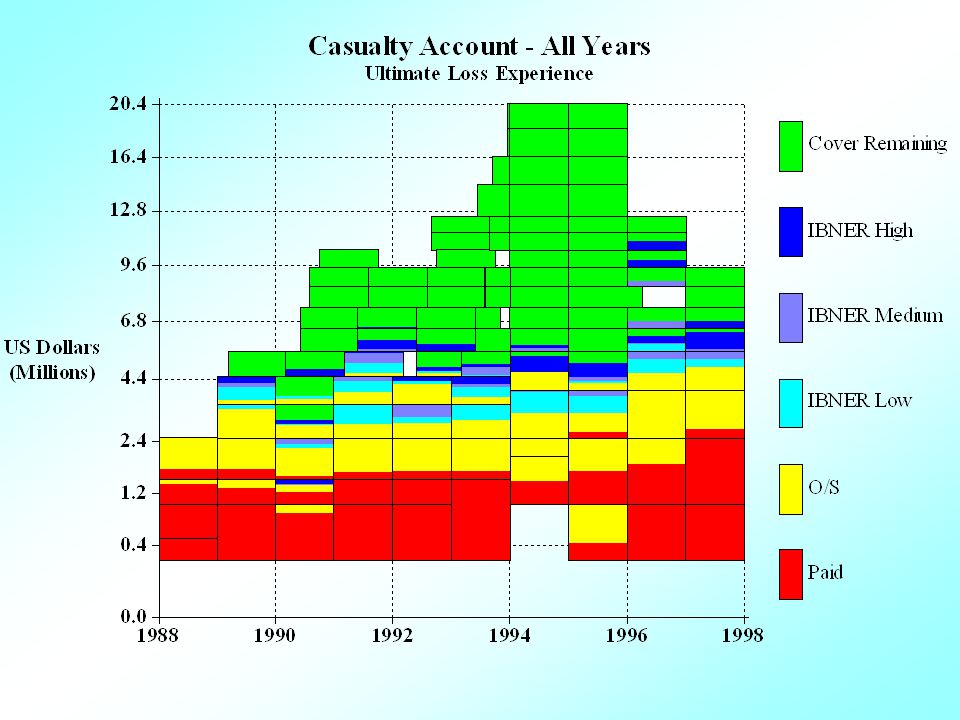
Most Recent R/I Years Review earlier years experience Apply expected recovery loss ratios Discuss and review results with underwriters

17
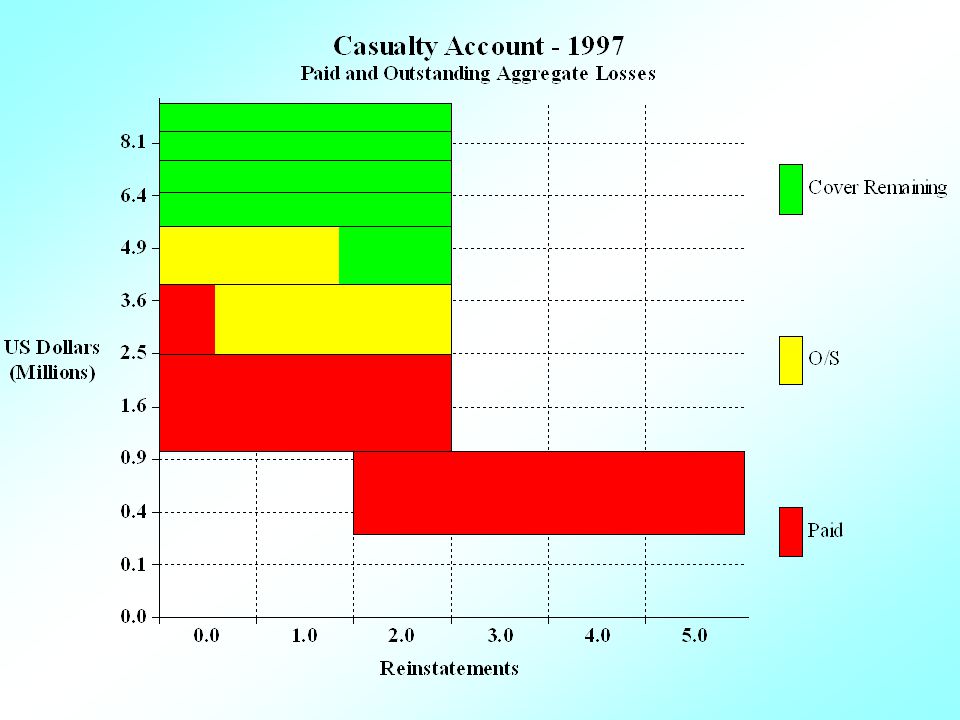
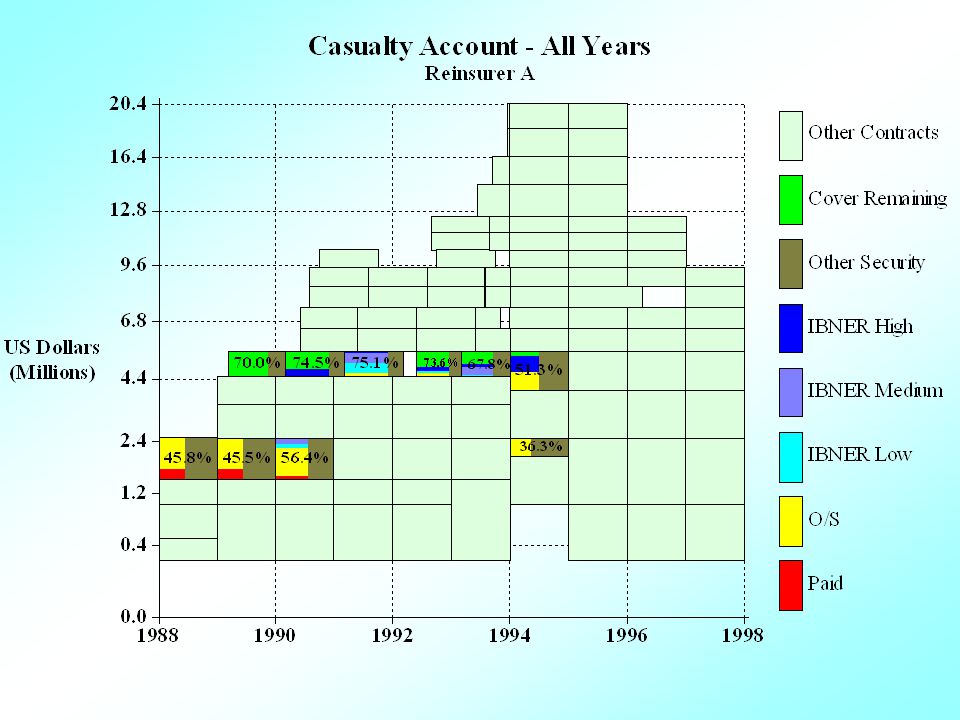
Calculate R/I Reserve For each R/I contract calculate: Reserve = (O/S + IBNR) less Future Reinstatement Premiums equals R/I Reserve
 less Future Reinstatement Premiums equals R/I Reserve")
25
Basic Summary of Agency Rating Categories

26
Allocate Security Levels ReinsurerSecurity LevelS & P Description A3Strong B1Extremely Strong C2Very Strong D6Weak E4Good F5Marginal

27
Disasterous Very Weak Weak Marginal Good Strong Very Strong Extremely Strong Unknown

28
Source: Standard & Poor's Sample Default Rates (%) Mean Term Years Security Level 1234561015+ 1.0.1.2.41.01.1 2.0.1.2.4.51.01.1 3.1.2.4.6.81.82.3 4.2.4.71.21.72.23.74.2 5.93.05.27.39.311.215.116.8 64.79.914.317.419.721.325.626.4 718.926.031.035.139.039.942.7
 Mean Term Years Security Level")
29
Sample Class Bad Debt Default %s PropertyAviationMarineCasualty Security Level Mean Term2 yrs3 yrs4 yrs10yrs 1Extremely Strong.0.1 1.0 2Very Strong.0.1.21.0 3Strong.1.2.41.8 4Good.4.71.23.7 5Marginal3.05.27.315.1 6Weak9.914.317.425.6

30
Calculate Bad Debt Select the bad debt factor for each reinsurer appropriate to each class of business. Apply the bad debt factor for each respective reinsurer to the reinsurance reserves within each contract. Sum over all contracts, all programs and all years.

31
Bad Debt

32
Sensitivity of Bad Debt to Rating Selection

33
Detailed Approach Advantages Disadvantages Closer to reality Better understanding of R/I program Auditable Allocation by reinsurer Principal to principal set-off Better feedback to Underwriters and Management Better actuarial advice w.r.t. processing and purchasing of reinsurance Observe aging of bad debt Time and effort

34
Future Developments Use in DFA models Test a wide variety of scenarios and stochastic parameters Interact with underwriting cycle and catastrophe expectations Optimisation and pricing of future reinsurance programs

35
Conclusion “Winning is not about doing one thing 100% better, but doing 100 things 1% better” Dennis Conner

Similar presentations


INSURANCE 2 Examples from Caribbean Region: Monoline Property Insurer Multi-line Non-life insurer.>")


 2006 Standard.>")

