Download presentation
Presentation is loading. Please wait.

1
3.3. Allometric scaling laws 3.3.1 Phenomenology

2
More general: how are shape and size connected? Fox (5 kg) Elephant (6000 kg)
 Elephant (6000 kg)")
3
Simple scaling argument (Gallilei) Load is proportional to weight Weight is proportional to Volume ~ L 3 Load is limited by yield stress and leg area; I.e. L 3 ~ d 2 Y This implies d ~ L 3/2 Or d/L ~ L 1/2 ~ M 1/6

4
Similar for the size of the stem in trees – the bigger the tree the bigger its stem

5
This is also connected to the development of the individual

6
Look at the heart rate of different animals

7
...or the lifespan as a function of weight i.e. There’s only a constant number of heart beats

8
However,

9
This can also be looked at in the same individual

10
But also for populations of different people to basically determine the ideal weight in terms of size...

11
Plot this on a double logarithmic scale and it becomes simpler – and you can see where the BMI comes from…

12
Metabolic rate is conveniently measured by oxygen consumption.

13
Plot the metabolic rate for many different animals

14
Works over many decades...

15
Kleiber’s Law:

16
3.3.2. Fractals and scaling An example of a scaling argument – Flight speeds vs.mass

17
Cruise speeds at sea level Mass (grams) Cruising speed (m/s) Boeing 747 crane fly goose house wren Beech Baron 10 0 1 2 3 damsel fly starling -5-3 1 3 5 7 10 9 F-16 hummingbird fruit fly bee sailplane eagle dragonfly
 Cruising speed (m/s) Boeing 747 crane fly goose house wren Beech Baron damsel fly starling F-16 hummingbird fruit fly bee sailplane eagle dragonfly")
18
Cruise speeds at sea level Mass (grams) Cruising speed (m/s) Boeing 747 crane fly goose house wren Beech Baron 10 0 1 2 3 damsel fly starling -5-3 1 3 5 7 10 9 F-16 hummingbird fruit fly bee sailplane eagle dragonfly
 Cruising speed (m/s) Boeing 747 crane fly goose house wren Beech Baron damsel fly starling F-16 hummingbird fruit fly bee sailplane eagle dragonfly")
19
W A=Area L Consider a simple explanation

20
Mass (grams) Cruising speed (m/s) Boeing 747 crane fly goose house wren Beech Baron 10 0 1 2 3 damsel fly starling -5-3 1 3 5 7 10 9 F-16 hummingbird fruit fly bee sailplane eagle dragonfly Fits pretty well!
 Cruising speed (m/s) Boeing 747 crane fly goose house wren Beech Baron damsel fly starling F-16 hummingbird fruit fly bee sailplane eagle dragonfly Fits pretty well!")
21
Mass (grams) Cruising speed (m/s) Boeing 747 crane fly goose house wren Beech Baron 10 0 1 2 3 damsel fly starling -5-3 1 3 5 7 10 9 F-16 hummingbird fruit fly bee sailplane eagle dragonfly Short wings, maneuverable Long wings, soaring and gliding What do variations from nominal imply?
 Cruising speed (m/s) Boeing 747 crane fly goose house wren Beech Baron damsel fly starling F-16 hummingbird fruit fly bee sailplane eagle dragonfly Short wings, maneuverable Long wings, soaring and gliding What do variations from nominal imply")
22
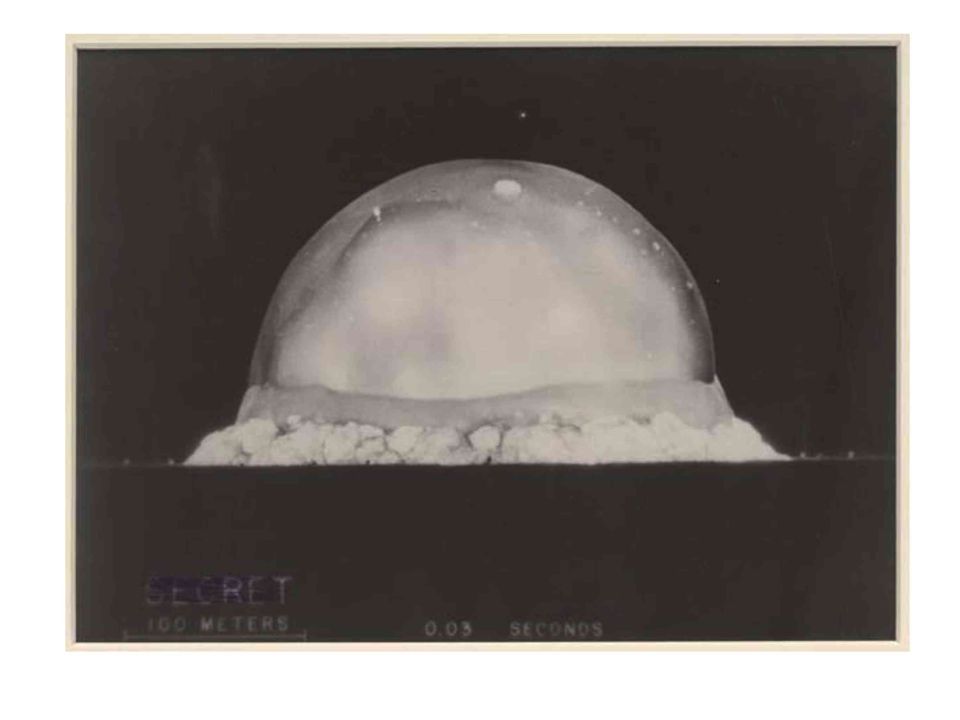
A famous example: The energy of a nuclear explosion US government wanted to keep energy yield of nuclear blasts a secret. Pictures of nuclear blast were released in Life magazine Using Dimensional Analysis, G.I. Taylor determined energy of blast and government was upset because they thought there had been a leak of information

24
Radius, R, of blast depends on time since explosion, t, energy of explosion, E, and density of medium, , that explosion expands into [R]=m, [t]=s,[E]=kg*m 2 /s 2, =kg/m 3 R=t p E q k q=1/5, k=-1/5, p=2/5
![Radius, R, of blast depends on time since explosion, t, energy of explosion, E, and density of medium, , that explosion expands into [R]=m, [t]=s,[E]=kg*m 2 /s 2, =kg/m 3 R=t p E q k q=1/5, k=-1/5, p=2/5](http://images.slideplayer.com/15/4655418/slides/slide_24.jpg "Radius, R, of blast depends on time since explosion, t, energy of explosion, E, and density of medium, , that explosion expands into [R]=m, [t]=s,[E]=kg*m 2 /s 2, =kg/m 3 R=t p E q k q=1/5, k=-1/5, p=2/5")
25
We’re looking for a similar argument to explain the scaling of metabolic rate Metabolism works by nutrients, which are transported through pipes in a network. This forms a fractal structure, so what are fractals?

26
A fractal looks the same on different magnifications...

27
This is not particularly special, so does a cube...

28
What’s special about fractals is that the “dimension” is not necessarily a whole number

29
Consider the Koch curve

30
Or the Sierpinski carpet

31
How long is the coast of Britain?

32
Vessels in nutrient transport (veins, xyla, trachaea) actually have a brached fractal structure, so consider this for explaining metabolic rate
 actually have a brached fractal structure, so consider this for explaining metabolic rate")
33
3.3.3. Physical model Branching, hierarchical network that is space filling to feed all cells Capillaries are invariant of animal size Minimization of energy to send vital resources to the terminal units (pump blood from the heart to the capillaries) three basic assumptions
 three basic assumptions.")
34
Modelling the network of tubes

35
All vessels of the same level can be considered identical. Define scale-free ratios and The network is space-filling to reach the whole body Allows us to relate one level to the next. n is branching ratio r k is radius of vessel at kth level l k is length of vessel at kth level

36
I T T R Minimize Energy Loss through Natural Selection Dissipation (Important for small vessels, Poiseuille flow) Area Preserving Reflection at junctions (Important for larger vessels, pulsatile flow)
 Area Preserving Reflection at junctions (Important for larger vessels, pulsatile flow)")
37
Metabolic Rate, B, and Body Mass, M Follows from Energy Min. Use scale factors to relate each level to terminal units. Invariance of terminal units B=N T B T Blood volume Number of Terminal units Volume of Terminal units Mass Met Rate

38
Other predictions from the model Speed of flow through capillaries is invariant Invariant blood pressure

39
Remember tree stems from beginning

40
One slightly couterintuitive conclusion: Each capillary feeds more cells in larger organisms capillary tissue

41
But in fact this is the case, cells in vivo have less consumption the bigger the animal (but constant in vitro…)
")
42
Transport happens through fractal networks even in subcellular instances – the law can be extended…

43
This implies that the ¾ rule is true over 25- 30 decades!!

44
Can this help in understanding how an organism grows? growth Resting metabolism Energy input

45
Kleiber's rule tells us: With the stationary Solution:

46
Solving this gives a sigmiod curve:

47
Compare to experimental data for M and

48
Scaling collapse:

49
This does not cover the growth spurt during puberty

50
But remember that proportions do change as well during life

51
In fact the weight curve shows less of a puberty anomaly

52
The model also implies how much energy is used by an individual (tree)
")
53
This implies that population densities can be predicted via the usage of land for each tree as a function of tree size

54
This works pretty well

55
Recap Sec 3.3 Small animals live faster than large ones – and have very different structures This follows a very general law, which is summarised by the dependence of metabolic rate on mass The fractal structure of the nutrient transport is instrumental in explaining the exponent of this law Given the dependence of metabolic rate on size, population densities and also growth of organisms can be treated This gives predictions that have been tested experimentally

Similar presentations


 Viscous Fluid Flow A. Prof. Hamid NEBDI Faculty of Applied Science. Department of Physics. Room: 315 second.>")


 Is it 2/3 or 3/4? (empirical controversy) How.>")


>")
