Download presentation
Presentation is loading. Please wait.

1
Global Warming--Are We on Thin Ice? Convergence of evidence for anthropogenic global warming Climate forcing, feedback, response, committed warming Evidence of global warming Projections of global warming Compton Tucker NASA/Goddard Space Flight Center and Climate Change Science Program Office Washington, D.C. USA

2
Climate Feedback Given a climate forcing (e.g. CO 2 increase) initial warming Amplifying loops (positive feedback) magnify the warmingAmplifying loops (positive feedback) magnify the warming Diminishing loops (negative feedback)Diminishing loops (negative feedback)
 initial warming Amplifying loops (positive feedback) magnify the warmingAmplifying loops (positive feedback) magnify the warming Diminishing loops (negative feedback)Diminishing loops (negative feedback).")
3
Climate Feedbacks Warming Evaporation from ocean, Increase water vapor in atm Enhance greenhouse effect Increase cloud cover; Decrease absorption of solar energy Decrease snow cover; Decrease reflectivity of surface Increase absorption of solar energy

4
Measured Surface Temperature the past 150 years 6 warmest years: 1998, 2002, 2003, 2004, 2005, 2006.

5
Warming greatest at high latitudes Amplification of warming due to decrease of albedo (melting of snow and ice)
")
6
Bore Hole Locations different physics ( thermal diffusivity) & 10s of years time steps
 & 10s of years time steps")
7
Bore Hole Temp. Reconstructions ~500 years

8
Sub-surface Annual Temperature 12.8 m depth @ Wisconsin USA

9
Bore Hole Temperature Reconstructions

10
Proxy surface Temperature data density circa 1500 AD

11
Proxy surface Temperature data density circa 1000 AD

12
National Research Council USA June 2006 Report

13
Mann, Bradley, & Hughes (1998): The “hockey stick” surface temperature
: The hockey stick surface temperature")
14
Proxy data used by Mann et al. 1998

15
McIntyre and McKitrick 2003 a reanalysis with a subset of Mann et al. 1998’s data 15th century the warmest time in the past 1000 to 2000 years? Same result as Mann et al. 1998 when 5 PCs are used for 15th century Same result as Mann et al. 1998

16
Tree Ring Dendrochronology

17
Some ring-width series Cook, 1989 Four red spruce ring-width series from the same stand – different trends related to competition and disturbance. ~40-50% of tree ring data from trees selected from temperature- limited areas are related to surface air temperature

18
Coral 18 O/ 16 O Temperature Reconstruction

19
Proxy Surface Temperatures from corals, sediments, and ice cores using 18 O/ 16 O 18 O = ( 18 O/ 16 O)sample - ( 18 O/ 16 O)SMOW x 10 3 ‰ ( 18 O/ 16 O)SMOW SMOW = Standard Mean Ocean Water 18 O: 0.20% 17 O: 0.04% 16 O: 99.76% H 2 16 O is > than that of H 2 18 O; converselyH 2 18 O 18 O concentration in H 2 O will be. Isotope concentration can thus be considered a function of temperature. The vapor pressure of H 2 16 O is > than that of H 2 18 O; conversely H 2 18 O passes into the liquid state more readily. Because condensation is the result of cooling, the greater the fall in temperature the lower the 18 O concentration in H 2 O will be. Isotope concentration can thus be considered a function of temperature.

20
Greenland ice core: high resolution/distinct layers

21
Bore Hole - Hockey Stick Comparison ‘Adjusted’ by Mann et al.

22
Bore Hole - Hockey Stick Comparison

23
Bore Hole Data for Eastern & Western North America ( Huang & Pollack)
")
24
Bore Hole - Briffa et al Comparison

25
Bore Hole - Overpeck et al Comparison

26
Satellite Era 1970s ---> now

27
Total Solar Irradiance ~1 watt/m 2 variation out of ~1400 w/m 2 over 30 years

28
Tropospheric Temperature Trends Christy and Spencer were wrong

29
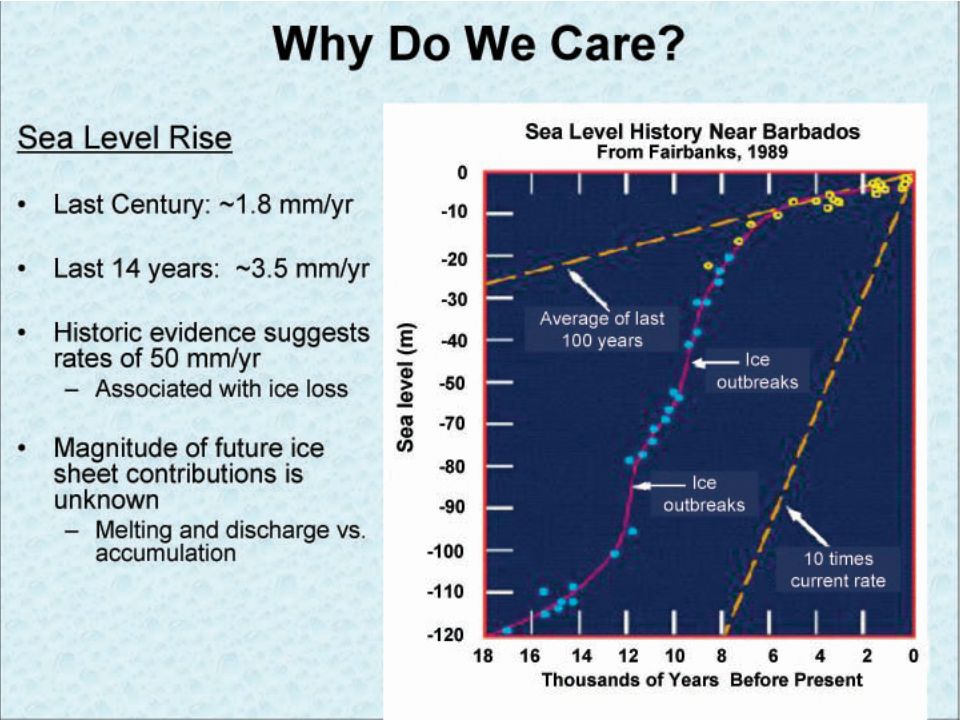
Sea Level Rise from thermal expansion & input of water from melting glaciers 20 cm (7 inches) in a century
 in a century")
30
Arctic Sea Ice Trends 2005 summer minima 1979 summer minima

31
Satellite Detection of Sea Ice Higher rate of microwave emission from sea ice than from open water. Emissivities indicated are for wavelength of 1.55 cm (19 GHz)
.")
32
Warmer Earth Greener North Arctic Sea Ice Extent 1979 to 1999 Claire Parkinson et al. 2002

33
Atmospheric CO 2 measurements

34
Outstanding Questions Only half of the CO 2 produced by human activities is remaining in the atmosphereOnly half of the CO 2 produced by human activities is remaining in the atmosphere Where are the sinks that are absorbing over 40% of the CO 2 that we emit?Where are the sinks that are absorbing over 40% of the CO 2 that we emit? –Land or ocean? –Eurasia/North America? Why does CO 2 buildup vary dramatically with nearly uniform emissions?Why does CO 2 buildup vary dramatically with nearly uniform emissions? How will CO 2 sinks respond to climate change?How will CO 2 sinks respond to climate change?

35
Observed Halting of the Greening Trend (NDVI) / t : Summer 1982-1991 (NDVI) / t : Summer 1994-2002 Summer drying reduced photosynthesis Recent slowing of the land C sink Angert et al. “Drier summers cancel out the CO 2 uptake enhancement induced by warmer springs” PNAS 2005

36
Equilibrium Climate from Ice Core Data J. Hansen Estimate climate forcing (W/m 2 ) from atmospheric composition changesEstimate climate forcing (W/m 2 ) from atmospheric composition changes Regress Temperature anomalies against climate forcingRegress Temperature anomalies against climate forcing
 from atmospheric composition changesEstimate climate forcing (W/m 2 ) from atmospheric composition changes Regress Temperature anomalies against climate forcingRegress Temperature anomalies against climate forcing.")
37
Atmospheric CO 2 since 1740 Different CO 2 slopes reflect time techno-economic conditions

38
Climate Forcing: expressed as a change in radiative heating (W/m2) at surface for a given change in trace gas composition or other change external to the climate system
 at surface for a given change in trace gas composition or other change external to the climate system")
39
Colder temperatures -> more snow and ice -> colder temperatures… More snow and ice ---> higher albedo

40
J. Hansen

41
What? Me worry?

44
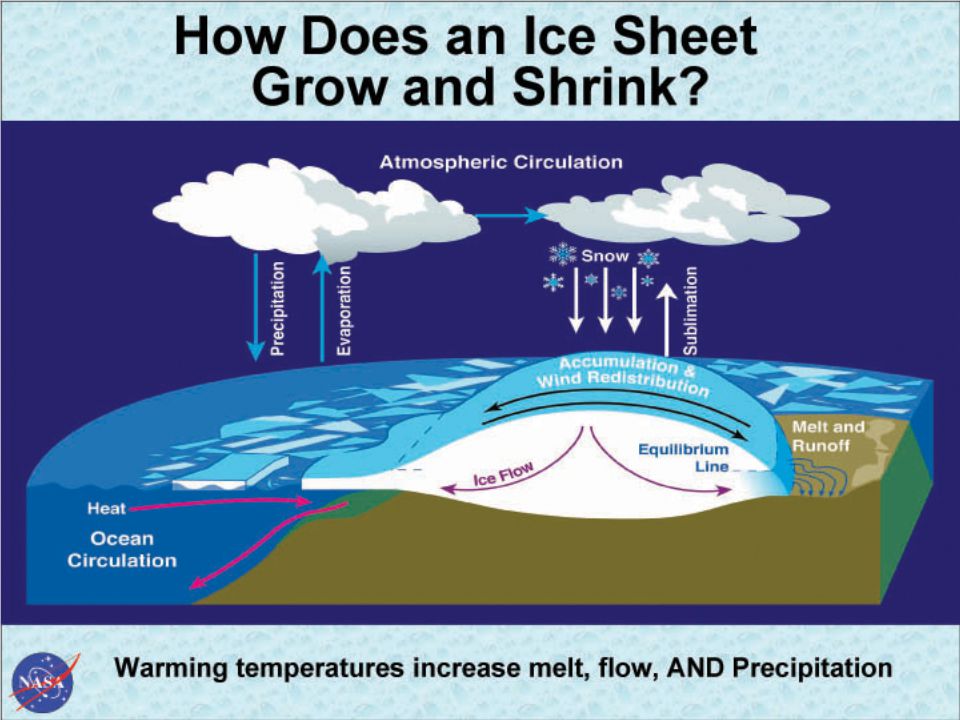
Majority of Glaciers are receding

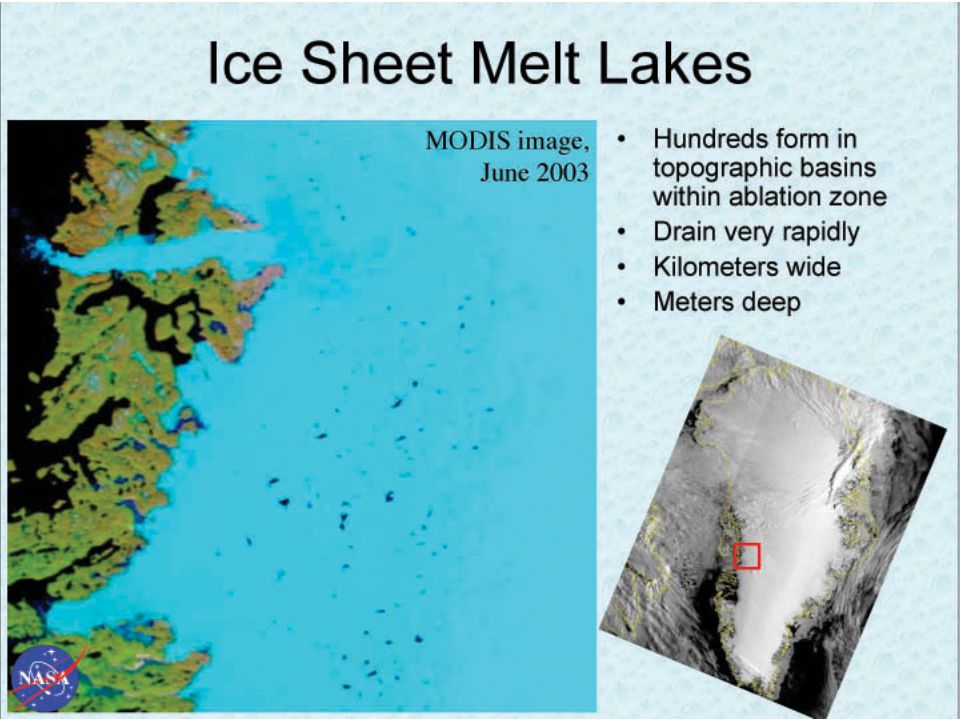
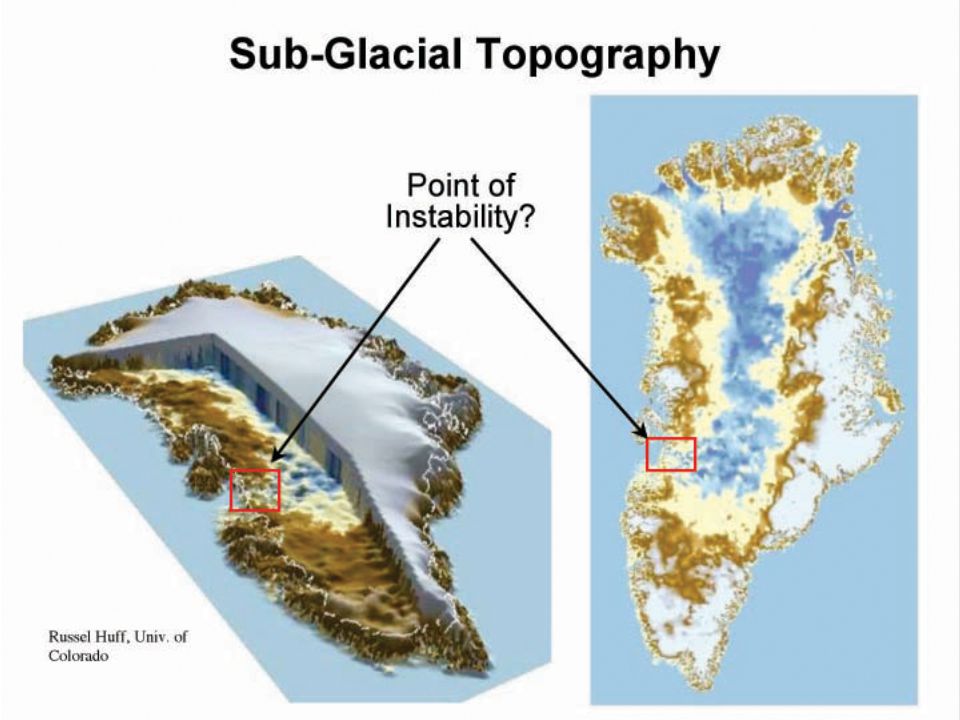
45
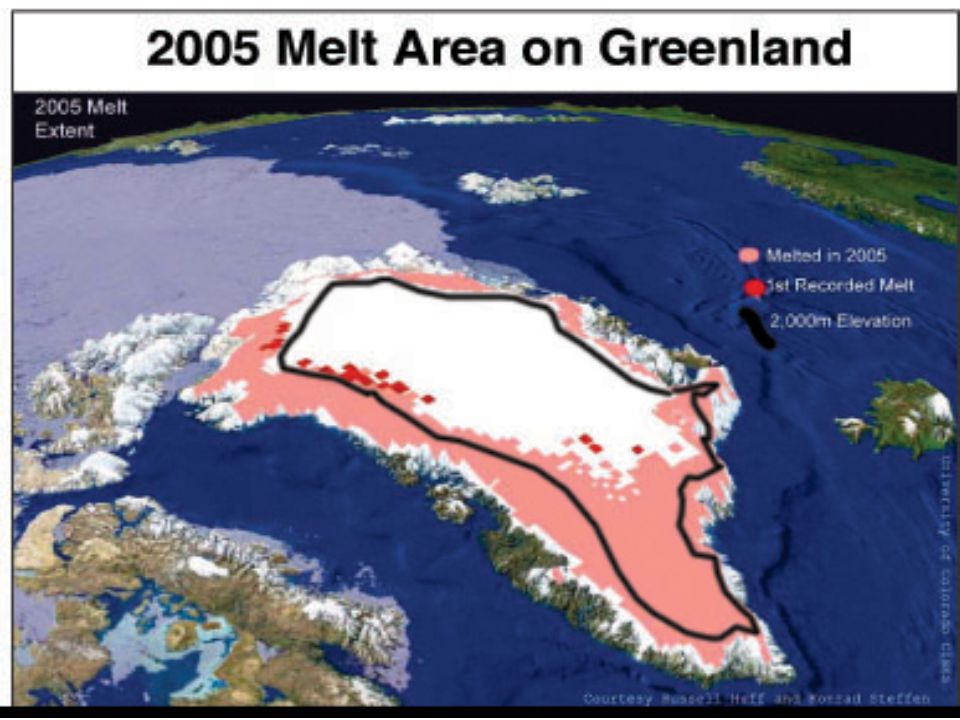
Greenland--where the rubber hits the climate road

46
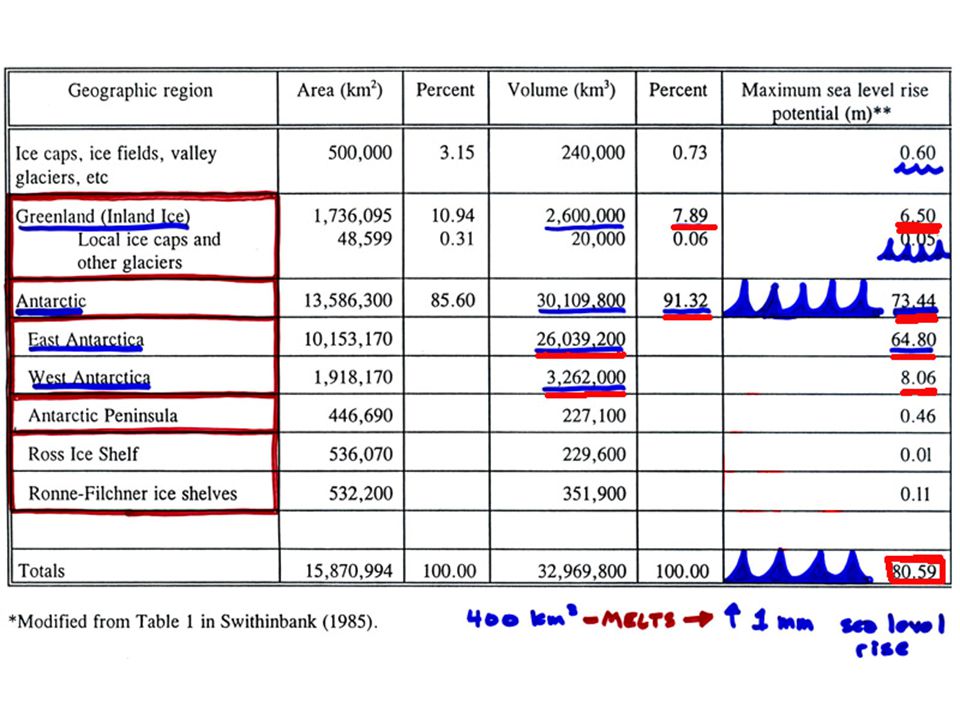
It’s only a matter of time… 400 km 3 ice = 1 mm sea level

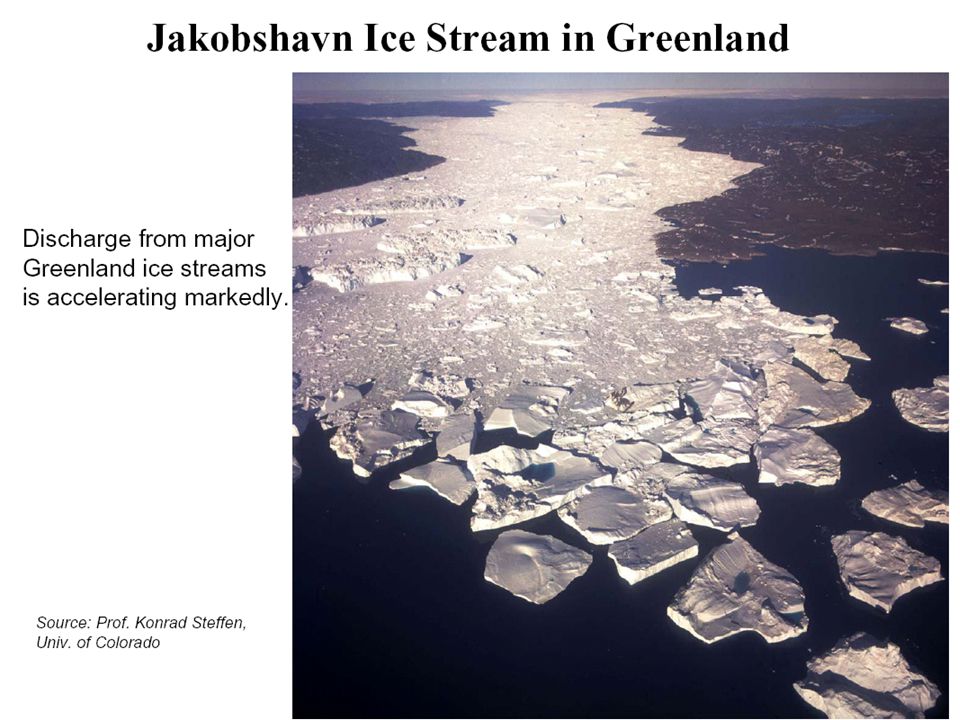
49
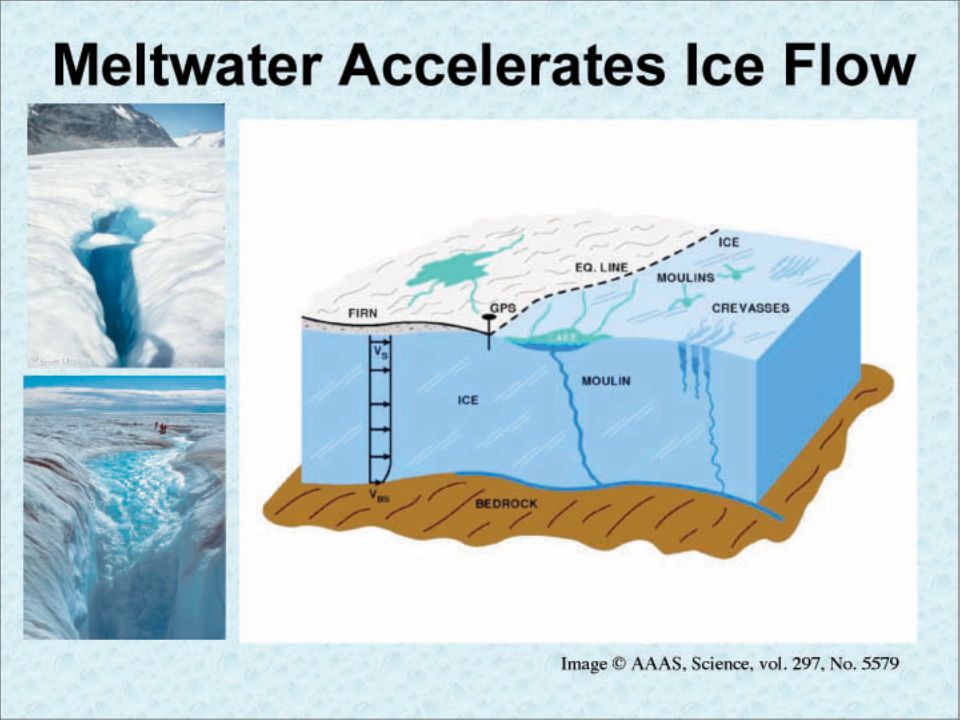
> Streaming, >Earthquakes

50
Satellite record melt of 2002 was exceeded in 2005 Surging glaciers & melting Greenland Ice: 70 m thinning in 5 years

51
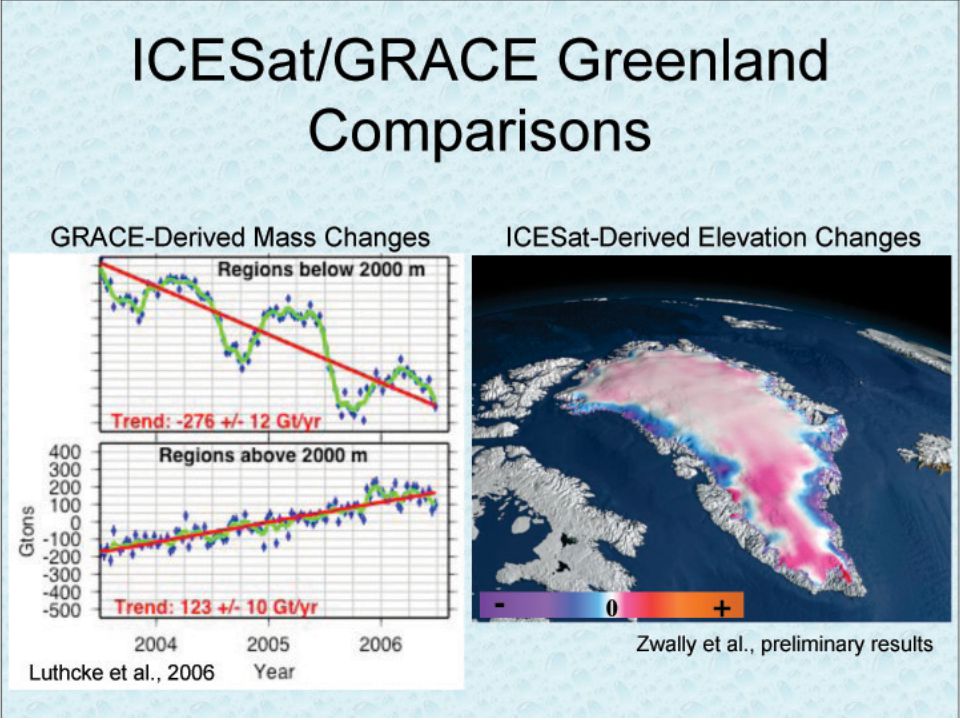
Greenland Mass Loss from GRACE

52
Gravity Recovery & Climate Experiment 500 km orbit 220 km separation Distance accuracy 0.001 mm

54
Summary Global warming is real and happeningGlobal warming is real and happening 21 st C: drying of tropics reduce C uptake accelerate global warming21 st C: drying of tropics reduce C uptake accelerate global warming 21 st C: stable stratification in ocean, reduce thermohaline circulation reduce C uptake accelerate global warming21 st C: stable stratification in ocean, reduce thermohaline circulation reduce C uptake accelerate global warming Fossil Fuel emission faster than land & ocean uptake bottlenecks accelerate global warmingFossil Fuel emission faster than land & ocean uptake bottlenecks accelerate global warming Rapid destablization of glaciers ice-albedo feedback accelerate global warming raise sea levelRapid destablization of glaciers ice-albedo feedback accelerate global warming raise sea level Uncertainty: how much faster? Uncertainty: how much faster?

55
Global Warming Skeptics Dr. S. Fred Singer “Ozone, Skin Cancer, and the SST” S. Fred Singer Aerospace America July 1994 “The hole truth about CFCs” S. Fred Singer in Chemistry and Industry March 21, 1994 “The EPA and the Science of Environmental Tobacco Smoke” S. Fred Singer and Kent Scholar Alexis de Tocqueville Institution Dr. Singer has a sordid history of opposition to second-hand tobacco smoke and health, the role of chloro-floro-carbons and ozone depletion, and most recently global warming.

58
Pollack & Huang Bore Hole Data

59
Holgate Glacier July 24, 1909 Holgate Glacier August 13, 2004

60
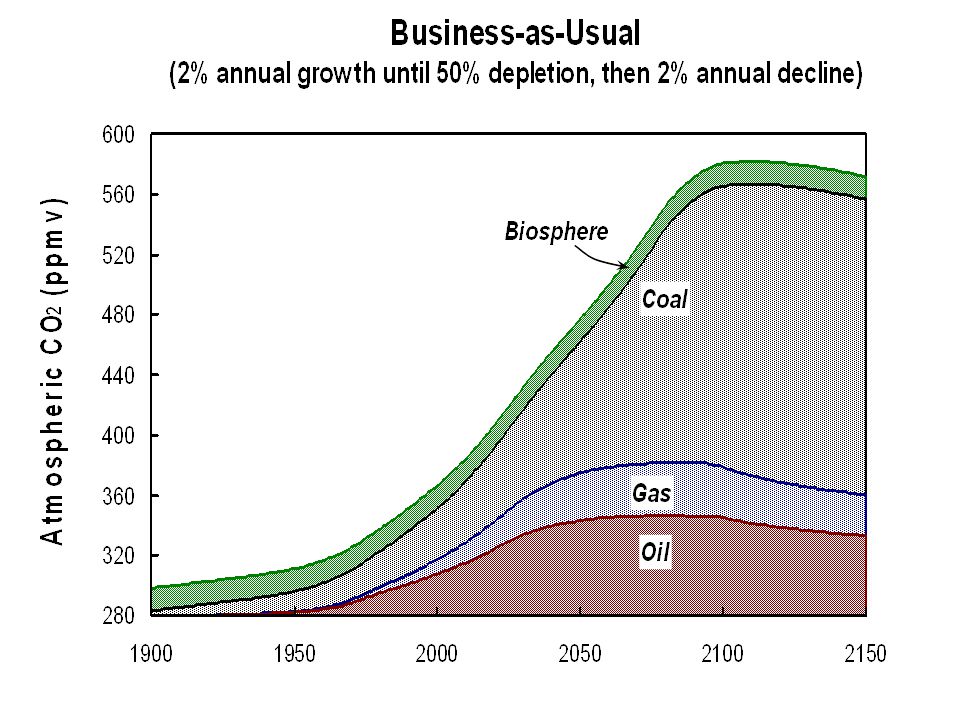
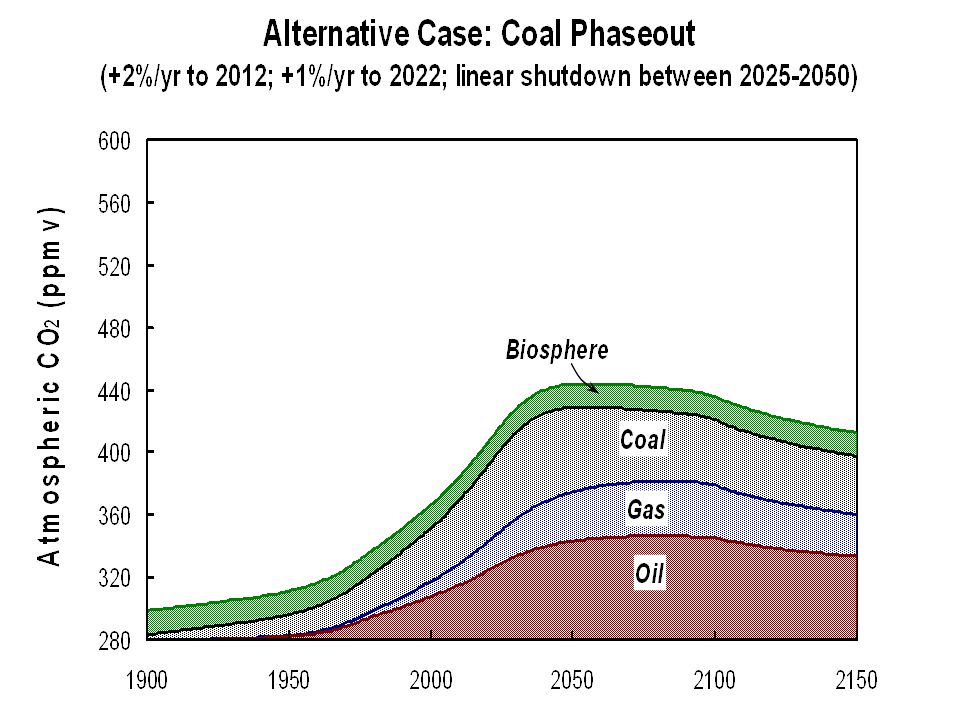
21 st C warming depends on CO 2 increase 20 th C stabilizn: CO 2 constant at 380 ppmv for the 21 st C 21 th C “Business as usual”: CO 2 increasing 380 to 680 ppmv Meehl et al. (Science 2005)
.")
Similar presentations


 1. Is it warming? --climate proxy info (recap) -- info from historical & instrumental records 2. What.>")


 Earth radiation – infrared (7-15 m) Major infrared absorbers:>")


