Download presentation
Presentation is loading. Please wait.

1
HIV Across Houston/Harris Co., Texas: Time, Space and Race Presenter: Katherine Ngo, MPH Authors: Katherine Ngo MPH, Biru Yang MPH PhD, Monica Slentz BS, Lu-Yu Hwang MD, M. Aaron Sayegh PhD MPH Presented to: 2011 Annual CSTE Conference June 12 -16, 2011

2
The Landscape of HIV in Houston/Harris County, TX Houston has the highest rate of infection in the entire state of Texas. 1 In 2008, Houston was ranked 14 th in the nation for diagnosis of HIV infection. 2 In 2008, Houston’s estimated rate of diagnosis of HIV infection was 28.9 per 100,000 population. 2 http://searchsalf.blogspot.com/2009/09/hiv-cartoon-3-search-id-pwen42.html

3
HIV Cases by Diagnosis Year in Houston/Harris Co., TX 1999-2007

4
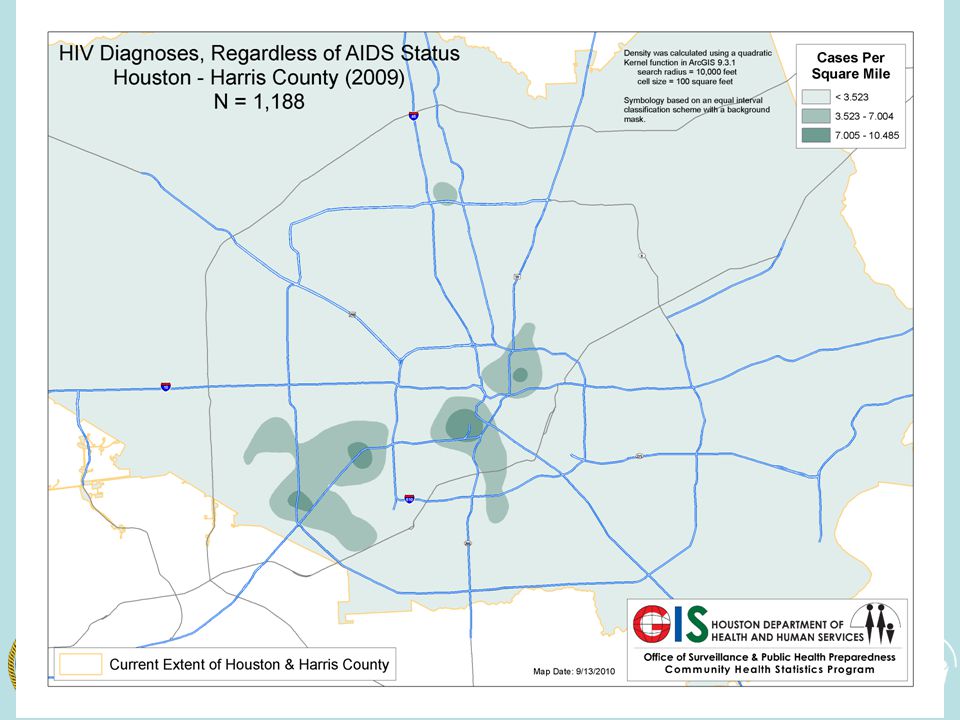
Thematic Map Results HIV Rate by Census Tract Houston-Sugarland-Baytown MSA (2009) HIV Rate by Census Tract Houston-Sugarland-Baytown MSA (2009) HIV Rate by Census Tract Houston-Sugarland-Baytown MSA (2009) HIV Rate by Census Tract Houston-Sugarland-Baytown MSA (2009) HIV Rate by Census Tract Houston-Sugarland-Baytown MSA (2009) HIV Rate by Census Tract Houston-Sugarland-Baytown MSA (2009)
 HIV Rate by Census Tract Houston-Sugarland-Baytown MSA (2009) HIV Rate by Census Tract Houston-Sugarland-Baytown MSA (2009) HIV Rate by Census Tract Houston-Sugarland-Baytown MSA (2009) HIV Rate by Census Tract Houston-Sugarland-Baytown MSA (2009) HIV Rate by Census Tract Houston-Sugarland-Baytown MSA (2009)")
8
Map of Results (Per Capita Income) Source: the ESRI 2009 Sourcebook America dataset
 Source: the ESRI 2009 Sourcebook America dataset")
9
Map of Results (Percent Black in Houston) Source: the ESRI 2009 Sourcebook America dataset
 Source: the ESRI 2009 Sourcebook America dataset")
10
A Note About Zip codes Why were zip codes not used? –Zip code boundaries do not define social differences –Census tracts created as a proxy for neighborhoods 3

11
Social Determinants of Health What are social determinants of health? –World Health Organization Definition: The social determinants of health are the conditions in which people are born, grow, live, work and age, including the health system. These circumstances are shaped by the distribution of money, power and resources at global, national and local levels, which are themselves influenced by policy choices. The social determinants of health are mostly responsible for health inequities - the unfair and avoidable differences in health status seen within and between countries.

12
The HIV-GIS Project In 2010, the Houston Department of Health and Human Services (HDHHS) initiated a project to enhance HIV surveillance data collected across its jurisdiction. The project involves the geocoding and linking of HIV diagnoses information to social determinants of health (SDH) data.
 data..")
13
Project Objectives Increased use of geocoding in HIV surveillance programs will provide a better understanding of local disease distribution and epidemiology and can provide more cost effective HIV surveillance, delivery of services, and better evaluation of current prevention activities. Once the HIV surveillance data are geocoded, the data can be linked with other data. GIS analyses will allow the user(s) to assess current activities to prevent HIV infection, to identify new venues or activities for engaging hard to reach high-risk populations, and to target the allocation of local resources.
 to assess current activities to prevent HIV infection, to identify new venues or activities for engaging hard to reach high-risk populations, and to target the allocation of local resources..")
14
Study Objective To determine the social determinants of health associated with HIV diagnosis in Houston/Harris County.

15
Methods Data Sources: ehanced HIV/AIDS Reporting System (eHARS), 2000 US Census Time frame: 2008 and 2009 525/754 census tracts Unit of Analysis: Census Tracts Geocoded Addresses of HIV cases newly diagnosed in 2008 and 2009 to the census tract level. Six social determinants of health (SDH) variables selected for study through literature review and focus group discussions SDH variables linked to census tracts
 variables selected for study through literature review and focus group discussions SDH variables linked to census tracts.")
16
SDH Variables Outcome: Number of HIV cases per census tract Geographic level: census tract % of population in extreme poverty % African American (Institutional segregation) % of linguistically isolated households % without high school education % residential stability (% of population living in the same house over a 5-year period) % unemployed or not participating in workforce
 % of linguistically isolated households % without high school education % residential stability (% of population living in the same house over a 5-year period) % unemployed or not participating in workforce")
17
Analysis –Correlation analysis detected significant associations between the SDH variables and the number of new HIV diagnoses in a census tract. –Logistic and Linear Regression http://www.cadalyst.com/management/cad-cartoon-5379

18
Pearson’s Correlation Matrix

19
Logistic Regression Results Social Determinants of Health VariablesaOR95% CI Percent below extreme poverty 0.892(0.832-0.957)* Percent of persons over 25 years old without HS 1.016(0.994-1.038) Percent of persons over 16 years old who are in the labor force and unemployed 1.021(0.983-1.061) Percent of linguistically isolated households 0.914(0.874-0.956)* Length of stay-percent of persons 5 years or older resided in the same house for the past 5 years 1.013(1.000-1.027) Percent of African American in the 2000 Census 0.972(0.960-0.983)*
* Percent of persons over 25 years old without HS 1.016( ) Percent of persons over 16 years old who are in the labor force and unemployed 1.021( ) Percent of linguistically isolated households 0.914( )* Length of stay-percent of persons 5 years or older resided in the same house for the past 5 years 1.013( ) Percent of African American in the 2000 Census 0.972( )*")
20
Linear Regression Results Social Determinants of Health Variables Parameter Estimate P-Value Intercept 6.01<.0001 Percent below extreme poverty0.120.0084 Percent of persons over 25 years old without HS-0.020.4546 Percent of persons over 16 years old who are in the labor force and unemployed -0.100.0159 Percent of linguistically isolated households0.050.1087 Length of stay-percent of persons 5 years or older resided in the same house for the past 5 years -0.07<.0001 Percent of African American in the 2000 Census0.07<.0000

21
Limitations Preliminary Data Analysis Small sample size –Data for only 2 years Limited to 2000 Census

22
Strengths First study of its kind Collaboration between bureaus Hypothesis generating

23
Conclusions These results indicate a significant linear relationship between the number of people newly diagnosed with HIV, poverty and the racial ethnic composition of a census tract. The results of this study are consistent with the findings of previous studies on health disparities. Future analysis will determine if these associations represent successful outreach or service gaps.

24
Acknowledgements Houston Department of Health and Human Services Biru Yang MPH PhD, Monica Slentz BS, M. Aaron Sayegh PhD MPH –Bureau of Epidemiology –Bureau of Community Health Statistics –Bureau of HIV/STD Prevention The University of Texas School of Public Health –Lu-Yu Hwang MD

25
References 1.http://www.dshs.state.tx.us/hivstd/reports/default.shtm 2.http://www.cdc.gov/hiv/surveillance/resources/reports/2008report/pdf/2008SurveillanceReport.pdf 3.Krieger N, Waterman PD, Chen JT, Soobader MJ, Subramanian SV, Carson R: Zip code caveat: Bias due to spati-temporal mismatches between zip codes and U.S. census-defined geographic areas -- The Public Health Disparities Geocoding Project. Am J Public Health 2002, 92:1100- 1102. 4.Krieger N, Chen JT, Waterman PD, Rehkopf DH, Subramanian SV (2005) Painting a truer picture of US socioeconomic and racial/ethnic health inequalities: The Public Health Disparities Geocoding Project. Am J Public Health 95: 312–323. 5.http://www.who.int/social_determinants/en/http://www.who.int/social_determinants/en/ 6.http://www.cdc.gov/mmwr/pdf/other/su6001.pdfhttp://www.cdc.gov/mmwr/pdf/other/su6001.pdf 7.www.cdc.gov/mmwr/PDF/wk/mm6021.pdf
 Painting a truer picture of US socioeconomic and racial/ethnic health inequalities: The Public Health Disparities Geocoding Project. Am J Public Health 95: 312–")
26
Questions???

27
Thank you!! Katherine Ngo, MPH Epidemiologist Bureau of Epidemiology Houston Department of Health and Human Services Tel: 832-393-5080 E-mail: Katherine.ngo@houstontx.gov

28
Katherine Ngo –Recent graduate of the University of Texas School of Public Health. Graduating with an MPH –Received Bachelor’s degree from the University of Texas at Austin –Began interning at the Houston Department of Health and Human Services in 2008 doing foodborne surveillance

Similar presentations