Download presentation
Presentation is loading. Please wait.

1
ELEC 303 – Random Signals Lecture 18 – Statistics, Confidence Intervals Dr. Farinaz Koushanfar ECE Dept., Rice University Nov 10, 2009

2
Statistics

3
Example

4
Reduction of Cholesterol Level

5
Example (Cont’d)
")
6
Sample Mean

7
Sample Median

8
Sample Median (Cont’d)
")
9
Sample Mean vs. Sample Median

10
Percentile

11
Location of Data

12
Variability

13
Averages

14
Sample Variance

15
Statistics

16
Standard Deviation

17
Sample Range

18
Interquartile Range

19
Averaging?

20
Data Handling

21
Dot Plots

22
Histogram

23
Example

24
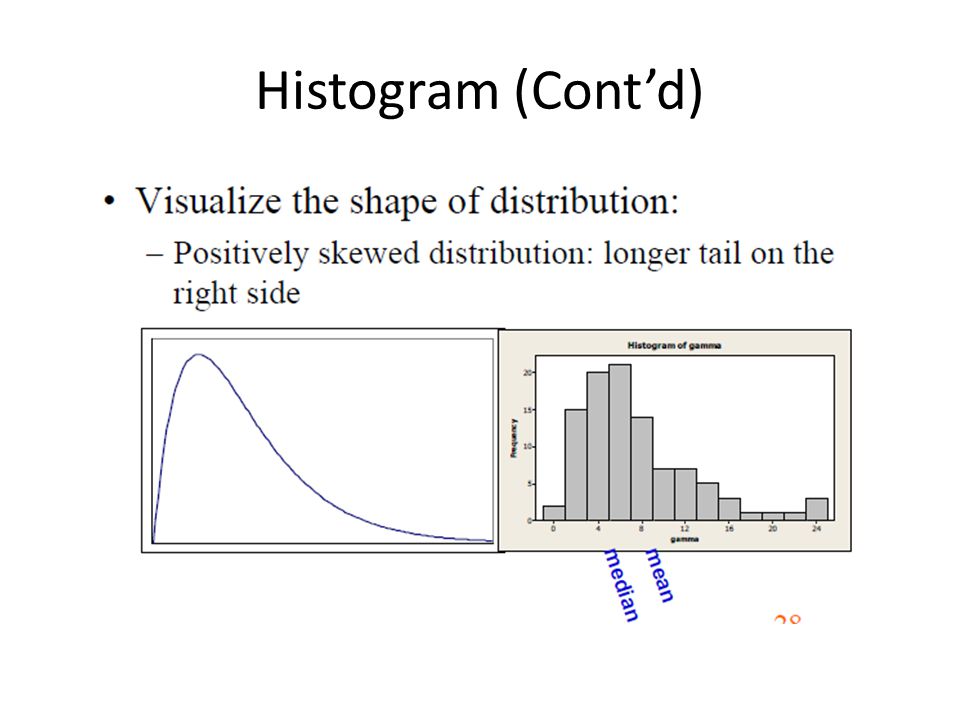
Histogram (Cont’d)
")
26
Confidence interval Consider an estimator for unknown We fix a confidence level, 1- For every replace the single point estimator with a lower estimate and upper one s.t. We call, a 1- confidence interval

27
Confidence interval - example Observations Xi’s are i.i.d normal with unknown mean and known variance /n Let =0.05 Find the 95% confidence interval

28
Confidence interval (CI) Wrong: the true parameter lies in the CI with 95% probability…. Correct: Suppose that is fixed We construct the CI many times, using the same statistical procedure Obtain a collection of n observations and construct the corresponding CI for each About 95% of these CIs will include

29
A note on Central Limit Theorem (CLT) Let X 1, X 2, X 3,... X n be a sequence of n independent and identically distributed RVs with finite expectation µ and variance σ 2 > 0 CLT: as the sample size n increases, PDF of the sample average of the RVs approaches N(µ,σ 2 /n) irrespective of the shape of the original distribution
 irrespective of the shape of the original distribution.")
30
CLT A probability density functionDensity of a sum of two variables Density of a sum of three variablesDensity of a sum of four variables

31
CLT Let the sum of n random variables be S n, given by S n = X 1 +... + X n. Then, defining a new RV The distribution of Z n converges towards the N(0,1) as n approaches (this is convergence in distribution),written as In terms of the CDFs
 as n approaches (this is convergence in distribution),written as In terms of the CDFs.")
32
Confidence interval approximation Suppose that the observations X i are i.i.d with mean and variance that are unknown Estimate the mean and (unbiased) variance We may estimate the variance /n of the sample mean by the above estimate For any given , we may use the CLT to approximate the confidence interval in this case From the normal table:
 variance We may estimate the variance /n of the sample mean by the above estimate For any given , we may use the CLT to approximate the confidence interval in this case From the normal table:")
33
Confidence interval approximation Two different approximations in effect: – Treating the sum as if it is a normal RV – The true variance is replaces by the estimated variance from the sample Even in the special case where the X i ’s are i.i.d normal, the variance is an estimate and the RV T n (below) is not normally distributed
 is not normally distributed")
Similar presentations


>")


 2004 Brooks/Cole, a division of Thomson Learning, Inc. Chapter 7 Statistical Intervals Based on a Single Sample.>")