Download presentation
Presentation is loading. Please wait.

1
PERKINS FUNDING BASED ON ENROLLMENTS AND IMPROVEMENT: Indiana’s Model Welcome

2
INDIANA Perkins Funding Indiana Department of Workforce Development Indiana Department of Education

3
INDIANA INDIANA (As of April 1, 2011) Perkins Funding Indiana Department of Workforce Development Indiana Department of Education
 Perkins Funding Indiana Department of Workforce Development Indiana Department of Education")
4
Two Major Issues

5
ISSUE 1 New state Superintendent of Public Instruction

6
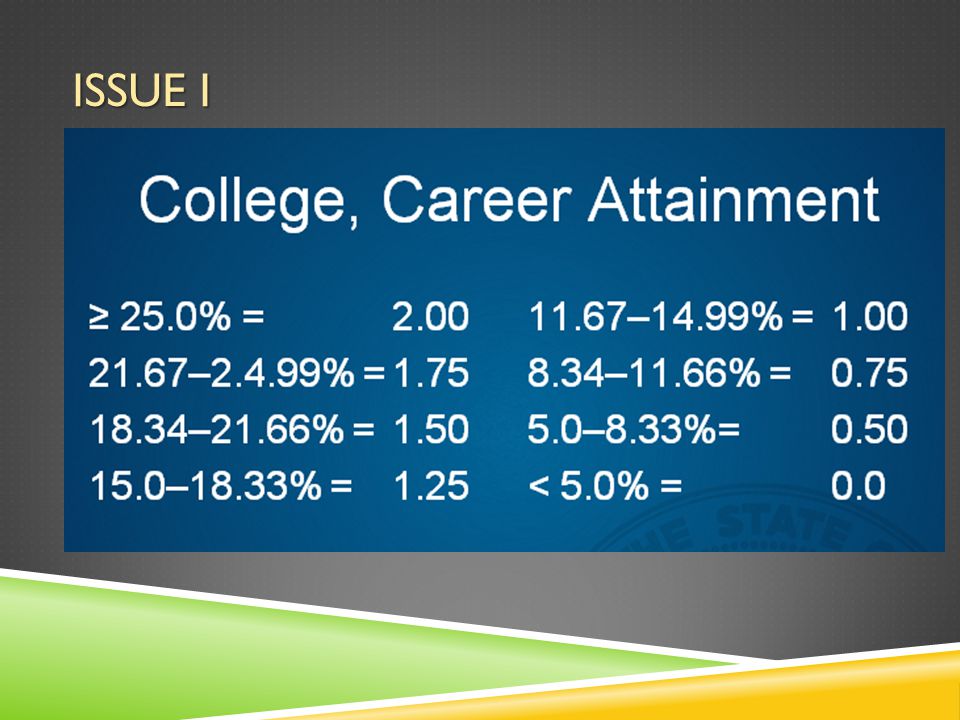
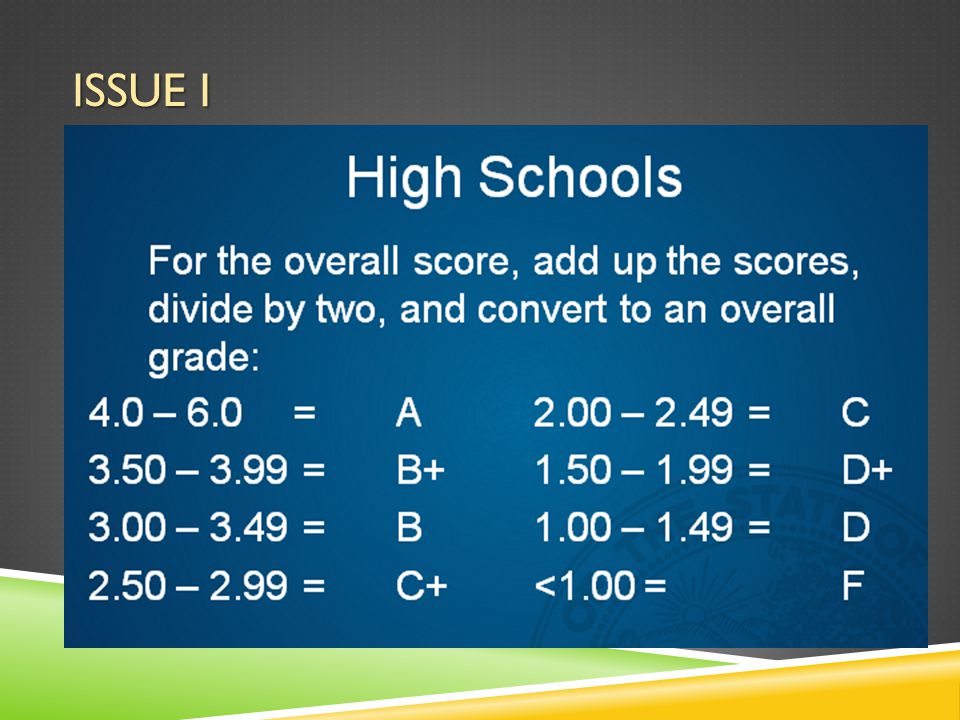
ISSUE 1 New state Superintendent of Public Instruction Focused on High School Accountability Giving schools letter grades A-F Basing letter grades on: o Growth o Performance Can CTE measure growth & performance?

7
ISSUE I

10
ISSUE 1I CTE Districts Concerned About Enrollment

11
ISSUE 1I CTE Districts Concerned About Enrollment Perkins formula favored CTE Districts with high census #’s and high poverty o 70% on census data of 5-19 year olds o 30% on census data of 5-19 year olds in poverty Does NOT account for CTE enrollments

12
ISSUE 1I CTE Districts Concerned About Enrollment State data showed: o Perkins formula favors urban populations o Some CTE districts with highest Perkins $$’s have very low CTE enrollments o Formula creates a disincentive for increasing CTE enrollments

13
Our Solution

14
OUR SOLUTION Ask USDOE/OVAE for change to funding formula Long discussions on how to change formula 83% of CTE Directors supported this: o 50% based on CTE enrollments o 25% on 5-19 year olds in poverty o 25% on Core Indicator performance and/or improvement

15
Option 1 Option 2 Option 3 Biggest Gains $326,165Rural $138,056 Rural $274,001Rural $271,333Rural $116,647Rural $214,145Rural $253,977Rural $111,997Urban $207,429Rural Biggest Losses ($1,102,079)Urban ($489,804)Urban ($1,120,801)Urban ($499,377) ($210,859)Urban ($486,958)Urban ($370,220) ($195,691)Urban ($372,023)Urban Option 1 50% of Perkins dollars allocated based on CTE enrollment number/25% of Perkins dollars allocated based on CTE concentrators number and 25% of Perkins dollars allocated based on CTE free/reduced number. Option 2 50% of Perkins dollars allocated based on CTE enrollment number/50% of Perkins dollars allocated based on poverty number from Census Bureau (not CTE only). Option 3 50% of Perkins dollars allocated based on CTE enrollment number/25% of Perkins dollars allocated based on CTE concentrators number /25% of Perkins dollars allocated based on number of CTE performance indicators met.
. Option 3 50% of Perkins dollars allocated based on CTE enrollment number/25% of Perkins dollars allocated based on CTE concentrators number /25% of Perkins dollars allocated based on number of CTE performance indicators met..")
16
OUR SOLUTION USDOE/OVAE said “no” Federal funding formula changes can’t dis- advantage low-income youth Illinois, Missouri and Kansas already tried CAN advocate for change in Perkins V

17
Our Next Solution

18
NEXT SOLUTION Use 10% Reserve for Incentive 50% on CTE enrollments 50% on Growth and/or Performance

19
NEXT SOLUTION Use 10% Reserve for Incentive 50% on CTE enrollments 50% on Growth and/or Performance May do in 2012-13 – Depending on Federal Funding

20
BASIC GRANT & TECH PREP GRANT Tech Prep Grant appears to be gone Basic Grant Considerations: Do we take money from CTE programs for third year of failed student indicators? What are YOUR state plans? Limit Funding, Floors/Ceilings and Incentives

21
LIMIT FUNDING & INCENTIVES Limit Funding If Target core indicator is not met: o Must allocate X% toward improvement o Must allocate X% to state-required program(s) Floors and Ceilings Only so much can be spent on certain areas (ceiling) or can’t spend less than X (floor) Provide Incentives Use 10% reserve or SL dollars to reward growth
 Floors and Ceilings Only so much can be spent on certain areas (ceiling) or can’t spend less than X (floor) Provide Incentives Use 10% reserve or SL dollars to reward growth")
22
Your Ideas

23
QUESTIONS

24
THANK YOU Melissa Rekeweg mrekeweg@doe.in.gov 317-232-9168 Matt Fleck mfleck@doe.in.gov 317-232-9172

Similar presentations


 and Rural and Low-Income Schools Grant(RLIS)>")


