Download presentation
Presentation is loading. Please wait.

1
Moderator: Thomas Nakagawa, MD, Wake Forest Baptist Health Presenters: Darren Malinoski, MD, Cedars-Sinai Medical Center Breakout Session A: Optimizing Donation Outcomes within the Context of End-of-Life Care

2
Optimizing Donation Outcomes within the Context of End-of-Life Care 2011 OneLegacy Organ Donation and Transplantation Symposium Darren Malinoski, MD Director of Surgical Critical Care Cedars-Sinai Medical Center

3
Questions to Run On? “What PI initiatives can I employ at my hospital to better support donation best practices?” “What clinical practices can I implement to improve donation outcomes at my hospital?”

4
Goals for this Presentation Emphasize the importance of organ donation for both recipients and donors Identify the role of critical care providers in organ donation and discuss how their involvement improves outcomes Discuss the role of Catastrophic Brain Injury Guidelines (CBIGs) and how to implement them Discuss the dilemma between DNR and organ donation
 and how to implement them Discuss the dilemma between DNR and organ donation")
5
Hospital Requirements Centers for Medicare/Medicaid Services & American College of Surgeons Notification process Declaration of brain death Organ procurement organization (OPO) relationship Performance Improvement (PI) program Patient/family opportunity to donate
 relationship Performance Improvement (PI) program Patient/family opportunity to donate")
6
Impact of Timely Referral on Conversion Rates Timely Referral* Eligible Deaths Eligible Donors Conversion Rate YES20,10914,16770.5% NO3,6192,08057.5% TOTAL23,72816,24768.5% * Based on OPO’s definition of timely referral OPTN data January 2008 – June 2010

7
Impact of Effective Request on Conversion Rates Effective Request* Eligible Deaths Eligible Donors Conversion Rate YES18,94714,33275.7% NO3,9981,87046.8% TOTAL23,72816,24768.5% * Based on OPO’s definition of effective request OPTN data January 2008 – June 2010

9
DIDIC Arrhythmias Pulmonary Edema Acidosis Hypothermia Hypotension

11
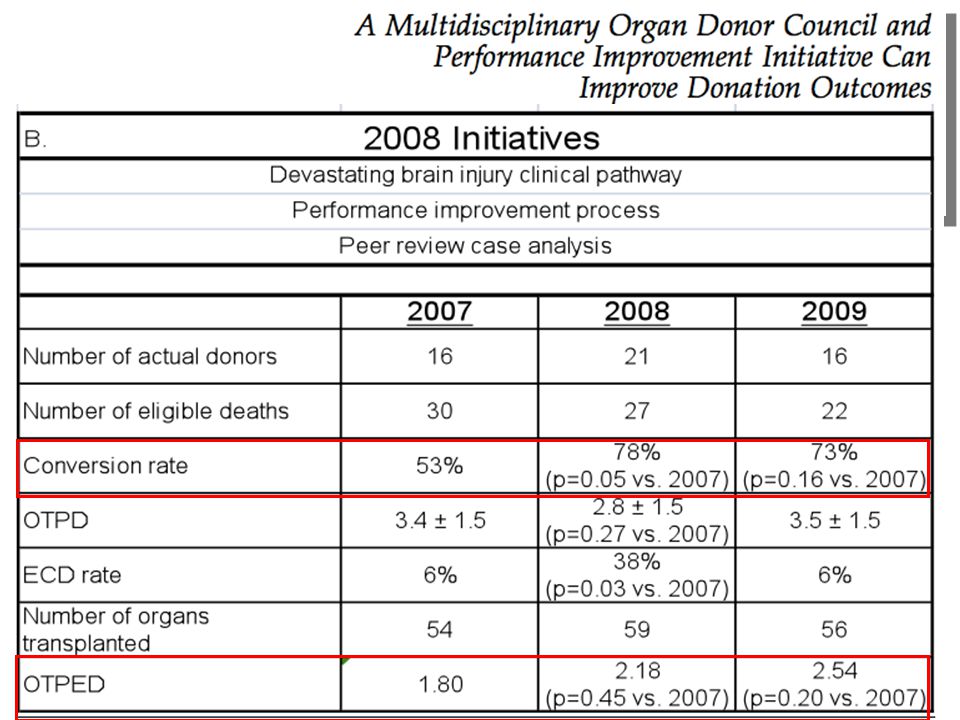
p=0.45 vs. 2007 p=0.20 vs. 2007 OTPED = effectiveness of an organ donation program Considers conversion rate & donor management

12
Pre-ADM (1995 – 1998) Post-ADM (1999 – 2002) Percent Change p-value* Referrals for donation 341537+ 57%< 0.001 Potential donors 214255+ 19%0.01 Actual donors 57104+ 82%< 0.001 Family decline (%) 109 (51%)106 (42%)- 9%< 0.05 Donors lost to CVS collapse 395- 87%< 0.001 Medically unsuitable 940+ 344%< 0.001 Organs recovered 217370+ 71%< 0.001
 Post-ADM (1999 – 2002) Percent Change p-value* Referrals for donation %< Potential donors %0.01 Actual donors %< Family decline (%) 109 (51%)106 (42%)- 9%< 0.05 Donors lost to CVS collapse %< Medically unsuitable %< Organs recovered %< 0.001")
13
How Can I Adopt this at My Institution? “Aggressive Donor Management” “Devastating Brain Injury Guidelines” or CBIGs: Catastrophic Brain Injury Guidelines

16
Devastating Brain Injury Pathway

17
Benefit to Patients/Families Hemodynamic Stability Apnea test/Confirmatory Test Locate family Time to grieve/decide on next steps Some patients clinically improve and survive Preserves option of donation if chosen *** Donors and their families want to donate 75% families consent, 42% adults registered Grieving data

19
98% would choose donation again 92% identified positive aspects to the donation process/experience Majority agreed that donation was comforting Associated with less depression

20
The Impact of Compliance with the American College of Surgeons Trauma Center Verification Requirements on Organ Donation-Related Outcomes – A Survey of the Level 1 and 2 Trauma Centers in Southern California Compliance with ACS – 67% 5.1 vs. 5.3 donors/1000 trauma admits (p=0.88) Trauma Surgeon on Donor Council – 67% 6.0 vs. 4.2 donors/1000 trauma admits (p=0.04) 21 vs. 11 donors/1000 ICU admits (p=0.03) Catastrophic Brain Injury Guidelines – 48% 6.3 vs. 4.2 donors/1000 trauma admits (p=0.04) 69 vs. 62% conversion rate (p=0.01) - D Malinoski, et al. 2011 PCSA
 Trauma Surgeon on Donor Council – 67% 6.0 vs. 4.2 donors/1000 trauma admits (p=0.04) 21 vs. 11 donors/1000 ICU admits (p=0.03) Catastrophic Brain Injury Guidelines – 48% 6.3 vs. 4.2 donors/1000 trauma admits (p=0.04) 69 vs. 62% conversion rate (p=0.01) - D Malinoski, et al PCSA.")
21
Background Checklists have demonstrated utility in several arenas Standardized critical care endpoints Donor Management Goals (DMGs)
")
22
Critical Care EndpointDMG 1. Mean Arterial Pressure (MAP) 60 – 110 mmHg 2. Central Venous Pressure (CVP) 4 – 12 mmHg 3. Ejection Fraction (EF) > 50% 4. Vasopressor use 1 and low dose 5. Arterial Blood Gas pH 7.3 – 7.5 6. PaO2:FiO2 (P:F) > 300 on PEEP = 5 7. Serum Na <155 mEq/L 8. Blood Glucose < 150 mg/dL 9. Urine Output (averaged over 4 hours) >0.5 cc/kg/hr Region 5 Donor Management Goals
 4 – 12 mmHg 3. Ejection Fraction (EF) > 50% 4. Vasopressor use 1 and low dose 5. Arterial Blood Gas pH 7.3 – PaO2:FiO2 (P:F) > 300 on PEEP = 5 7. Serum Na <155 mEq/L 8. Blood Glucose < 150 mg/dL 9. Urine Output (averaged over 4 hours) >0.5 cc/kg/hr Region 5 Donor Management Goals.")
23
Donor Management Goals met at consent improve outcomes 90% increase in the chance of achieving 4 organs transplanted per donor 50% decrease in the chance of developing recipient renal delayed graft function

24
Balancing DNR and Donation Timing – determine prognosis Timing – EOL care planning Timing – referral to OneLegacy Maintain standard critical care until the patient’s prognosis has truly been determined and the intent to donate has been elucidated

25
Summary Making donation a priority improves outcomes Aggressive donor management / CBIGs affect the number and quality of organs available for transplantation Donation benefits OUR patients/families

26
Questions to Run On? “What PI initiatives can I employ at my hospital to better support donation best practices?” “What clinical practices can I implement to improve donation outcomes at my hospital?”

27
THANK YOU Darren Malinoski, MD malinoskid@cshs.org

Similar presentations


? Federally designated, not-for-profit organ, tissue, and eye procurement.>")


