Download presentation
Presentation is loading. Please wait.

1
College and Career Readiness
Lake County Schools Investing In Excellence! College and Career Readiness Academic Services C² Collaborative Cohort November 15, 2012

2
Common Board Configuration
Shifting Gears Common Board Configuration Circle Map: Why does an Achievement Gap exist in Lake County Schools? Learning Goal: Participants will understand what, why, and how of subgroup performance relates to AMO targets and subgroup achievement gaps. I DO Define AMO state requirements and the achievement gap WE DO Review data, identify trends and resources to disaggregate data by subgroup for utilization in PLCs YOU DO Participate in a PLC using guiding questions and data to inform practice and identify strategies to close achievement gaps among subgroups Benchmarks: District Goals *Student Achievement *Highly Developed and High Performing Staff November 15, 2012 Participates will connect AMO data to school achievement gap by engaging in courageous conversation and reflection based on PLC guiding questions. Objectives Sum-It-Up Identify two ways you will facilitate PLCs that engage in courageous conversations about subgroup performance? Essential Question: How do we revolutionize the way we teach, lead, and learn for 21st century success? Common Language: NEXT STEPS: Return to school site as a Change Agent and share your capacity builder plan with your principal and determine next steps. Utilize AMO Technical Assistance PowerPoint Elementary and Secondary Act (ESEA Waiver) Annual Measurable Objectives (AMO) No Child Left Behind (NCLB) Adequate Yearly Progress (AYP)
 Annual Measurable Objectives (AMO) No Child Left Behind (NCLB) Adequate Yearly Progress (AYP)")
3
Lake County Schools Vision Statement
A dynamic, progressive and collaborative learning community embracing change and diversity where every student will graduate with the skills needed to succeed in postsecondary education and the workplace. Mission Statement The mission of the Lake County Schools is to provide every student with individual opportunities to excel. Lake County Schools is committed to excellence in all curricular opportunities and instructional best practices. This focus area addresses closing the achievement gap, increased graduation rate, decreased dropout rate, increase in Level 3 and above scores on the FCAT, achieving an increase in the number of students enrolled in advanced placement and dual enrollment opportunities and implementing the best practices in instructional methodology. Academic Services

4
Academic Services Curriculum & Instruction ~ Professional Development ~ Teaching & Learning The Office of Academic Services encompasses the core business of Lake County Schools. We provide guidance and support to develop instructional leaders through the coordination of district curriculum initiatives, professional learning, along with teaching and learning programs that result in improved learning for ALL. Our goal is to work collaboratively with schools to continuously and significantly improve student achievement, align curriculum and instructional practice to Florida’s standards, assist schools to develop their capacity to implement data-driven planning and review processes that foster continuous school improvement. Assurances We will ensure that we work with district staff and school administrators to design and collaborate on systems that address professional learning needs related to improving student outcomes. We will ensure that curriculum is current and at a high level (rigorous) meeting local, state, and national standards. We will ensure that researched-based best practices (programs and processes) are utilized regarding student curricular needs and student learning patterns. We will ensure services are provided that target closing the achievement gap by improving the performance of all students while drastically accelerating the achievement of students of color, English Language Learners (ELL), Exceptional Student Education (ESE) and students living in poverty. Academic Services
 meeting local, state, and national standards. We will ensure that researched-based best practices (programs and processes) are utilized regarding student curricular needs and student learning patterns. We will ensure services are provided that target closing the achievement gap by improving the performance of all students while drastically accelerating the achievement of students of color, English Language Learners (ELL), Exceptional Student Education (ESE) and students living in poverty. Academic Services.")
5
Academic Services

6
21st Century Skills Tony Wagner, The Global Achievement Gap
Critical Thinking and Problem Solving Collaboration and Leadership Agility and Adaptability Initiative and Entrepreneurialism Effective Oral and Written Communication Accessing and Analyzing Information Curiosity and Imagination Academic Services

7
Bell Ringer: Circle Map
Why does an achievement gap exist between subgroups? Who are our subgroups?

8
Transformational Education
Understanding the Achievement Gap Transformational Education Ambitious Vision Extraordinary Teams Culture of Achievement Effective Management Results Orientation Continuous Improvement Doing Whatever it Takes (Extra Challenges = Extra Time & Extra Support)
")
9
Quick Facts Over fifty years after Brown vs. Board of Education, there are still great disparities between students of color and white students in academic achievement. Students of color are disproportionately represented in the nation's dropout statistics: of the more than 1.2 million students who fail to graduate from high school on time each year, more than half are students of color, despite the fact that these students make up less than 40 percent of the high school population. Only 57.8 percent of Latino students, 53.4 percent of African American students, and percent of American Indian and Alaska Native students entering ninth grade earn a high school diploma four years later. Though the graduation rate for Asian American students is percent-roughly four percentage points higher than the white student average-students from some ethnic subgroups, like Southeast Asians and Pacific Islanders, do not fare as well academically.

10
R U C2 Ready? What is Required? Why is it Important? How do we do it?
Focus on Subgroup Performance Existing Achievement Gaps Professional Learning Communities Proficiency for All Students College and Career Ready Students Ensure Equitable Outcomes Race, Class, and Ethnicity should not be a predictor of performance or potential Disaggregated Data Identify Trends Utilize PLC Guiding Questions Engage in Courageous Conversation Address Barriers Develop Solutions

11
Remember Today’s Objective: Participates will connect AMO data to school achievement gap by engaging in courageous conversation and reflection based on PLC guiding questions. You will use this form later to design an initial framework to facilitate PLCs focusing on subgroup data.

12
Why Annual Measurable Objectives (AMO’s)?
Florida’s waiver from reporting Adequate Yearly Progress (AYP) under the Elementary and Secondary Education Act (ESEA), requires the state to report performance on Annual Measurable Objectives (AMOs) in several areas of academic achievement. The Elementary and Secondary Education Act (ESEA) provides more information than ever before about the relative performance of students on state standardized tests and highlights the need to ensure that all students succeed even beyond what the tests require.
 under the Elementary and Secondary Education Act (ESEA), requires the state to report performance on Annual Measurable Objectives (AMOs) in several areas of academic achievement. The Elementary and Secondary Education Act (ESEA) provides more information than ever before about the relative performance of students on state standardized tests and highlights the need to ensure that all students succeed even beyond what. the tests require.")
13
What are the AMO Areas? # 1 #3 #4 Lowest 25% Performance Target
School Performance Grade Target School Grade # 2 Reading and Mathematics Performance Target % Meeting High Standards - FCAT Level 3 and Above #3 Lowest 25% Performance Target Adequate Progress of Lowest 25% #4 Comparison of Florida’s Student Performance to the Highest Performing States and Nations National comparison using NAEP International comparison using TIMSS, PIRLS, and PISA Benchmark Florida’s Students Performance to other states and nations

14
Characteristics of AMO’s
AMOs are determined separately for each school and subgroup (calculated individually), by subject area. The AMO shows whether the school/subgroup is on track to reduce its percent of non-proficient students by half by For each school and subgroup, a separate yearly target is set to reach the identified goal.
, by subject area. The AMO shows whether the school/subgroup is on track to reduce its percent of non-proficient students by half by For each school and subgroup, a separate yearly target is set to reach the identified goal.")
15
AMO Subgroup Status All Students American Indian Asian
Students are included in the following subgroups, which parallel subgroups reported in previous years for AYP All Students American Indian Asian Black or African American Hispanic White Economically Disadvantaged English Language Learners Students with Disabilities

16
Bell Ringer: Revisiting Circle Map
Why does an achievement gap exist between subgroups? Who are our subgroups?

17
Impact of New Achievement Levels and Scoring Scales on Baseline Year
In December 2011, the State Board of Education (SBOE) adopted new achievement level standards for the state’s FCAT 2.0 assessments in reading, mathematics and the (EOC) assessment in Algebra 1. As a required data-processing step for determining the “On Track” AMO targets in reading and mathematics, the FLDOE retrofitted the baseline FCAT 2.0 scores and Algebra 1 scores to the new FCAT 2.0 vertical scale and Algebra 1 scale with new achievement levels applied accordingly. (This is why AYP and AMO levels look different when comparing your data) The retrofitted scores will be used in determining the proficiency level of subgroups for the baseline year of the calculation
 adopted new achievement level standards for the state’s FCAT 2.0 assessments in reading, mathematics and the (EOC) assessment in Algebra 1. As a required data-processing step for determining the On Track AMO targets in reading and mathematics, the FLDOE retrofitted the baseline FCAT 2.0 scores and Algebra 1 scores to the new FCAT 2.0 vertical scale and Algebra 1 scale with new achievement levels applied accordingly. (This is why AYP and AMO levels look different when comparing your data) The retrofitted scores will be used in determining the proficiency level of subgroups for the baseline year of the calculation.")
18
Common Board Configuration
Shifting Gears Common Board Configuration Circle Map: Why does an Achievement Gap exist in Lake County Schools? Learning Goal: Participants will understand what, why, and how of subgroup performance relates to AMO targets and subgroup achievement gaps. I DO Define AMO state requirements and the achievement gap WE DO Review data, identify trends and resources to disaggregate data by subgroup for utilization in PLCs YOU DO Participate in a PLC using guiding questions and data to inform practice and identify strategies to close achievement gaps among subgroups Benchmarks: District Goals *Student Achievement *Highly Developed and High Performing Staff November 15, 2012 Participates will connect AMO data to school achievement gap by engaging in courageous conversation and reflection based on PLC guiding questions. Objectives Sum-It-Up Identify two ways you will facilitate PLCs that engage in courageous conversations about subgroup performance? Essential Question: How do we revolutionize the way we teach, lead, and learn for 21st century success? Common Language: NEXT STEPS: Return to school site as a Change Agent and share your capacity builder plan with your principal and determine next steps. Utilize AMO Technical Assistance PowerPoint Elementary and Secondary Act (ESEA Waiver) Annual Measurable Objectives (AMO) No Child Left Behind (NCLB) Adequate Yearly Progress (AYP)
 Annual Measurable Objectives (AMO) No Child Left Behind (NCLB) Adequate Yearly Progress (AYP)")
19
NAEP Findings National Assessment of Educational Progress
Scores for White and Asian students are higher, on average, than for Black, Hispanic, and American Indian students. Hispanic students scored higher, on average, than Black students. 17-year-old Black and Latino students, on average, read and complete math at the 13-year-old level.

20
Attainment and Achievement Gaps
The National Center for Education Statistics (NCES) reports the following high school completion rates: 73 percent of Hispanics will complete high school or the GED 89 percent of Blacks will complete high school or the GED 93 percent of Whites will complete high school or the GED There are notable gaps in who earns a bachelor's degree: 33 percent of Whites; 18 percent of Blacks; and 11 percent of Latinos The NCES also reports that in : 79 percent of adults over the age of 25 with a bachelor's degree had jobs. 64 percent of individuals who completed high school had jobs. Individuals who did not complete high school had a 34 percent employment rate.
 reports the following high school completion rates: 73 percent of Hispanics will complete high school or the GED. 89 percent of Blacks will complete high school or the GED. 93 percent of Whites will complete high school or the GED. There are notable gaps in who earns a bachelor s degree: 33 percent of Whites; 18 percent of Blacks; and 11 percent of Latinos. The NCES also reports that in : 79 percent of adults over the age of 25 with a bachelor s degree had jobs. 64 percent of individuals who completed high school had jobs. Individuals who did not complete high school had a 34 percent employment rate.")
25
Data Sources Florida DOE Student Performance Results: Demographic Report Florida DOE AMO Reports District Edusoft Demographic Reports

26
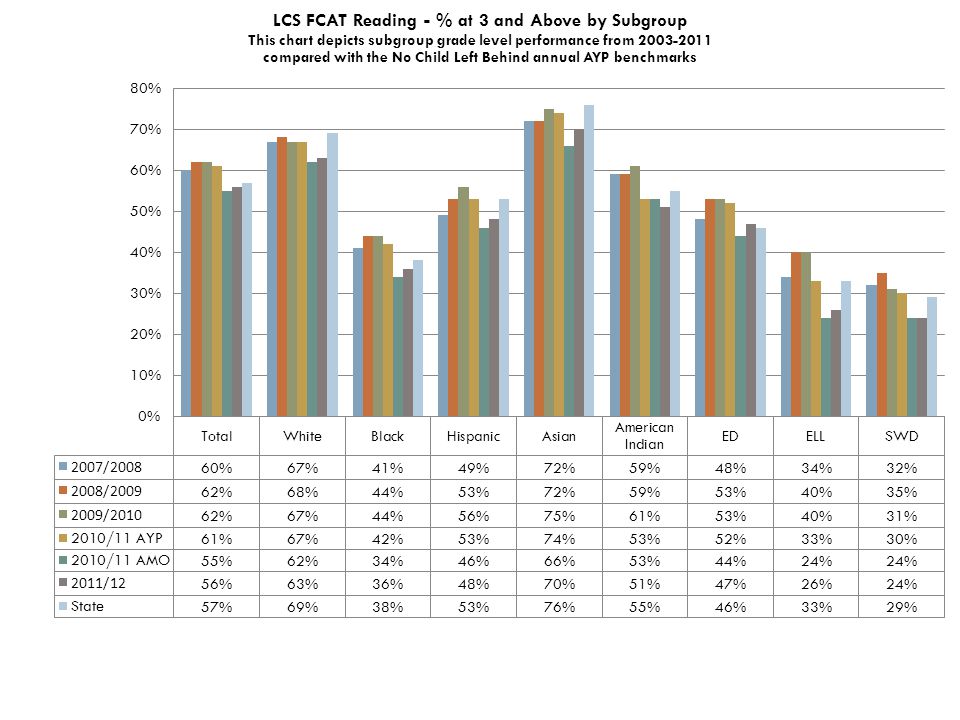
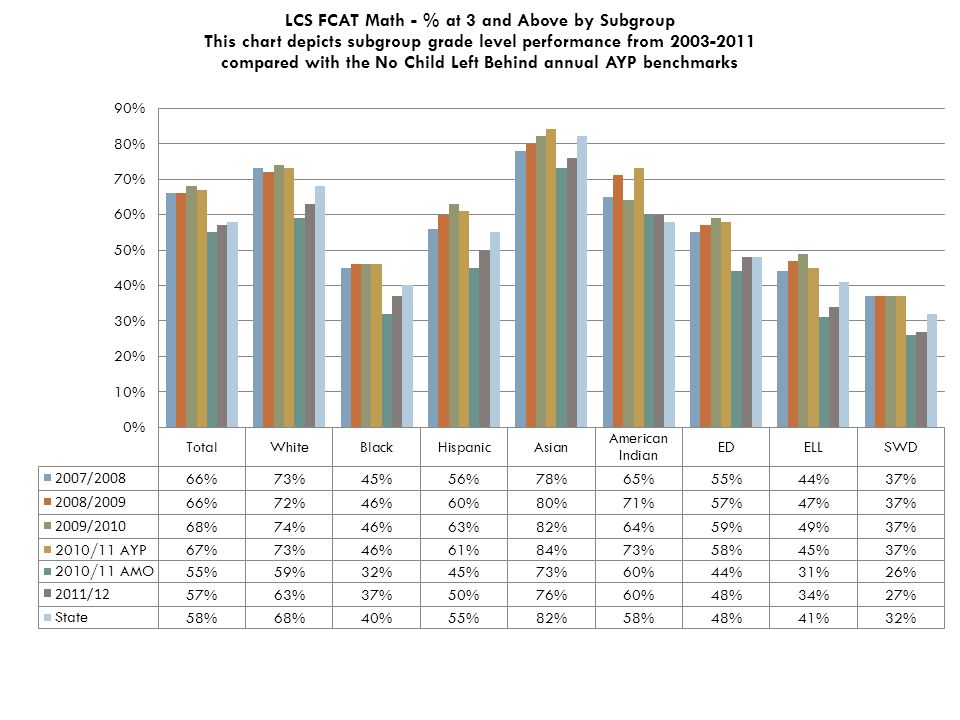
2012 FCAT 2.0 Reading District Trends by Subgroup (Demographic Report)
")
27
2012 FCAT 2.0 Reading District Trends by Subgroups (Demographic Report)
")
28
Florida DOE AMO Reports

30
Common Board Configuration
Shifting Gears Common Board Configuration Circle Map: Why does an Achievement Gap exist in Lake County Schools? Learning Goal: Participants will understand what, why, and how of subgroup performance relates to AMO targets and subgroup achievement gaps. I DO Define AMO state requirements and the achievement gap WE DO Review data, identify trends and resources to disaggregate data by subgroup for utilization in PLCs YOU DO Participate in a PLC using guiding questions and data to inform practice and identify strategies to close achievement gaps among subgroups Benchmarks: District Goals *Student Achievement *Highly Developed and High Performing Staff November 15, 2012 Participates will connect AMO data to school achievement gap by engaging in courageous conversation and reflection based on PLC guiding questions. Objectives Sum-It-Up Identify two ways you will facilitate PLCs that engage in courageous conversations about subgroup performance? Essential Question: How do we revolutionize the way we teach, lead, and learn for 21st century success? Common Language: NEXT STEPS: Return to school site as a Change Agent and share your capacity builder plan with your principal and determine next steps. Utilize AMO Technical Assistance PowerPoint Elementary and Secondary Act (ESEA Waiver) Annual Measurable Objectives (AMO) No Child Left Behind (NCLB) Adequate Yearly Progress (AYP)
 Annual Measurable Objectives (AMO) No Child Left Behind (NCLB) Adequate Yearly Progress (AYP)")
31
Four-Year Institution
Quick Facts Each year, approximately 1.2 million students fail to graduate from high school, more than half of whom are from minority groups. Percent of freshmen that enroll in at least one remedial course Community College Four-Year Institution 42% 20% Alliance for Excellent Education, February 2009 edition.

32
Indicators of Achievement Gaps NCLB Revisited
Performance on tests (e.g., statewide tests, Scholastic Aptitude Test [SAT]) Access to key opportunities (e.g., advanced mathematics, physics, higher education) Attainments (e.g., high school diploma, college degree, employment) Mention ACT waiver for ED students.. Reflect back at your school determine strategies taking place that shows what this looks like at your campus??? E.g. AVID, Spring Board, AP courses, Dual enrollment, SAT waivers, certification CTE courses, STEM clubs
 Access to key opportunities (e.g., advanced mathematics, physics, higher education) Attainments (e.g., high school diploma, college degree, employment) Mention ACT waiver for ED students.. Reflect back at your school determine strategies taking place that shows what this looks like at your campus E.g. AVID, Spring Board, AP courses, Dual enrollment, SAT waivers, certification CTE courses, STEM clubs.")
33
The Three Achievement Gaps

34
Circle Map Defining and Metacognition
How can courageous conversations about specific factors assist with closing the achievement gap? Factors Contributing to the Achievement Gap

35
Factors That Contribute to Achievement Gaps
Within Schools' Control Outside Schools' Control Teacher- and Teaching-Related Factors Uncertified and inexperienced teachers Insensitivity to different cultures Poor teacher preparation Low expectations of students Inadequate materials, equipment, and resources, including technology-based resources. Families' Support of Students' Learning Families' participation in school activities Families' skills to support and reinforce learning Students' TV watching and at-home reading. Students' Background Families' income level Students' birth weight Students' diet and nutrition at home Students' mobility Students' primary language (if other than English) Time family members are able to devote to support and reinforce learning. Other Factors Societal bias (racial, ethnic, poverty and class) Participates will use circle map to brainstorm on factors. Give participates a copy… to highlight the factors they can control Or use talking chips to ensure each participate shares at least 2 factors they added to their circle map
 Time family members are able to devote to support and reinforce learning. Other Factors Societal bias (racial, ethnic, poverty and class) Participates will use circle map to brainstorm on factors. Give participates a copy… to highlight the factors they can control. Or use talking chips to ensure each participate shares at least 2 factors they added to their circle map.")
36
Factors That Contribute to Achievement Gaps
Within Schools' Control Outside Schools' Control School-wide Factors Low expectations for student achievement Lack of rigor in the curriculum Large class size Tracking groups of students in a less demanding curriculum Unsafe schools Culturally unfriendly environments Poor, or no, instructional leadership Ignoring cultural synchronization Student-Related Factors Students' interest in school Students' level of effort Students' feeling that they are, in part, responsible for their learning. Factors in the Local Community Economic opportunity for students' families Access to health and social services Community safety Access to libraries, museums, and other institutions that support students' development Access to child care and after-school programs and facilities. Education Funding Shortfalls State budget deficits Unfunded federal mandates Inequities in funding among school districts. Irvine (1990) termed mismatches between school and student cultures as a lack of cultural synchronization. Many researchers acknowledge that African Americans have a unique cultural orientation that stems from African traditions (Hilliard, 1992, 1995). Examples include beliefs about spirituality, displays of emotion, physical movement, and individuality. Results from empirical studies also indicate that African American students engage in distinctive language patterns, styles of dress, and forms of nonverbal communication. More important, such behaviors and orientations are often incongruent with European-influenced school norms
 termed mismatches between school and student cultures as a lack of cultural synchronization. Many researchers acknowledge that African Americans have a unique cultural orientation that stems from African traditions (Hilliard, 1992, 1995). Examples include beliefs about spirituality, displays of emotion, physical movement, and individuality. Results from. empirical studies also indicate that African American students engage in distinctive language patterns, styles of dress, and forms of. nonverbal communication. More important, such behaviors and orientations are often incongruent with European-influenced school. norms.")
37
Jigsaw Activity Number of 1-4
Each group will come together by identified number and be assigned a Courageous Conversation to engage in for 5 minutes Each group member will then return to their home group and provide a 2 minute summary of their courageous conversation Home groups will update their circle maps with new learning Each group will share out findings

38
Norms for Courageous Conversations
Listen first Stay present in the conversation Speak your truth without fearing what others say Remember that everyone dos not communicate in the same way Be willing to take risks Be comfortable with being uncomfortable Try to understand where others are coming from Understand that there may not be closure

39
Courageous Conversations
1. Do any of these factors contribute to achievement gaps in your school? Which factors contribute and how? 2. How would we engage families differently if we valued their cultural differences? 3. What would staff development be like if we wanted to increase the resilience of all students? 4. How would instruction change if we were focusing on what students know, rather than what they don’t know?

40
Addressing Barriers Barriers; the reasons (root causes) why certain subgroups are not meeting performance standards. Determine if any subgroup within the population has a disproportionately lower rate that negatively affects the overall rate. Develop targeted interventions to the identified subgroups, allowing the implementation of more precise, concentrated interventions. Identify changes that can be made in systems

41
Actions That Close Achievement Gaps
Use effective research based instructional strategies. Maintain high standards for all students by providing a rigorous curriculum. Understand and capitalize on students' diverse cultures. Examine expectations, beliefs, and practices through the equity lens. Serve as "first responders" in identifying students who need additional instructional support. Participate in professional development that provide them with strategies for working with students and their families who are not achieving success.

42
Practices That Close Achievement Gaps
Embrace an agenda to focus on ALL students and target research based strategies (TEAM: Instructional Review Look-For Sheet a.k.a “Green Sheet”) Revisit assumptions about how learning occurs and integrate a broad discipline view (Lesson Study, CCSS –Common Core State Standards) Reflect upon the ways you think about students and causes for low achievement (SIP: School Improvement Planning) Understanding Comprehension School Reform to embrace a range of theories, focusing on systems and engage in comprehensive planning (FCIM: Florida’s Continuous Improvement Model) Identify and reflect on types of learners in your classroom and redefine outcomes and results (PLC: Professional Learning Communities)
 Revisit assumptions about how learning occurs and integrate a broad discipline view (Lesson Study, CCSS –Common Core State Standards) Reflect upon the ways you think about students and causes for low achievement (SIP: School Improvement Planning) Understanding Comprehension School Reform to embrace a range of theories, focusing on systems and engage in comprehensive planning (FCIM: Florida’s Continuous Improvement Model) Identify and reflect on types of learners in your classroom and redefine outcomes and results (PLC: Professional Learning Communities)")
43
Strategies That Close Achievement Gaps
Embrace an agenda that focuses on all children and on targeting those strategies that have been shown to close the achievement gaps among groups of students. Revisit assumptions about how learning occurs, and integrate a broad range of disciplines, such as sociology, brain research, and cultural anthropology, including research on human development in different environments and contexts. Reflect upon the ways you think about your students and the causes of low student achievement. How can we focus more on factors within the system, rather than within children, that create barriers to effective schooling for poor and/or culturally and linguistically diverse students? What aspects of the system (e.g., class- room instruction, assessment, curriculum, school leadership) can educators influence? For example, what changes can you influence in your classroom, school, district, community, to promote equity in schooling? Educators can contribute to overall changes in the system to promote equity in schooling by targeting what is within their sphere of influence, and then working to expand that influence. Research innovative, truly comprehensive approaches to school reform. Most school improvement plans focus on issues like class size and special programs. By embracing an “all children” agenda, looking at integrating a range of theories, and focusing on the system, you can engage in comprehensive planning that includes, but goes beyond, these issues. Reflect on the types of learners in your classroom. How do they learn best? In what ways can educators redefine outcomes and results to enable all groups of individuals to contribute productively to society? How can educators enable all learners with the knowledge and interpersonal skills required to successfully participate in the workforce and in varying social, community, and family contexts?
 can educators influence For example, what changes can you influence in your classroom, school, district, community, to promote equity in schooling Educators can contribute to overall changes in the system to promote equity in schooling by targeting what is within their sphere of influence, and then working to expand that influence. Research innovative, truly comprehensive approaches to school reform. Most school improvement plans focus on issues like class size and special programs. By embracing an all children agenda, looking at integrating a range of theories, and focusing on the system, you can engage in comprehensive planning that includes, but goes beyond, these issues. Reflect on the types of learners in your classroom. How do they learn best In what ways can educators redefine outcomes and results to enable all groups of individuals to contribute productively to society How can educators enable all learners with the knowledge and interpersonal skills required to successfully participate in the workforce and in varying social, community, and family contexts")
44
Capacity Building Planning Guide
What is it that we want students/ teachers to learn? How will they learn it? How will we know they learned it? What will we do differently if they have not learned it? Based on our learning today, identification of data trends, and participation in courageous conversations complete the capacity building planning tool. Each group will share with the large group

45
Remember Today’s Objective: Participates will connect AMO data to school achievement gap by engaging in courageous conversation and reflection based on PLC guiding questions. You will use this form NOW to design an initial framework to facilitate PLCs focusing on subgroup data.

47
Aligning Collaboration and Professional Learning
How Will We Know When Teachers Learn It? What Will We Do When Teacher Don’t Learn It? Lesson alignment Instructional practices are based on data High student expectation for ALL Progress monitoring is culturally embedded Utilization of best instructional practices daily Intrinsic motivation for professional growth Examining instructional best practices Opportunities for professional development Establish teacher support system/ demonstration classrooms Opportunities to reflect on practices Utilize problem solving method

48
Focus on Strengths Among Student Groups
Current Term Revised Term Achievement Gap Subgroups Racial and Ethnic Minorities English Language Learners Students with Disabilities Economically Disadvantaged VERSUS In Need of Enrichment and Support Student Groups Students of Color Second Language Learners Variable Learners School Dependant or Students Put at a Disadvantage Summarizing Activity: Identify two ways you will facilitate PLCs that engage in courageous conversations about subgroup performance?

49
If we remove barriers and provide necessary support to maximize student learning,
then school leaders and teachers that are best qualified to provide solutions can improve outcomes.

50
Common Board Configuration
Shifting Gears Common Board Configuration Circle Map: Why does an Achievement Gap exist in Lake County Schools? Learning Goal: Participants will understand what, why, and how of subgroup performance relates to AMO targets and subgroup achievement gaps. I DO Define AMO state requirements and the achievement gap WE DO Review data, identify trends and resources to disaggregate data by subgroup for utilization in PLCs YOU DO Participate in a PLC using guiding questions and data to inform practice and identify strategies to close achievement gaps among subgroups Benchmarks: District Goals *Student Achievement *Highly Developed and High Performing Staff November 15, 2012 Participates will connect AMO data to school achievement gap by engaging in courageous conversation and reflection based on PLC guiding questions. Objectives Sum-It-Up Identify two ways you will facilitate PLCs that engage in courageous conversations about subgroup performance? Essential Question: How do we revolutionize the way we teach, lead, and learn for 21st century success? Common Language: NEXT STEPS: Return to school site as a Change Agent and share your capacity builder plan with your principal and determine next steps. Utilize AMO Technical Assistance PowerPoint Elementary and Secondary Act (ESEA Waiver) Annual Measurable Objectives (AMO) No Child Left Behind (NCLB) Adequate Yearly Progress (AYP)
 Annual Measurable Objectives (AMO) No Child Left Behind (NCLB) Adequate Yearly Progress (AYP)")
51
Learning Goal: Participants will understand what, how, and why subgroup performance relates to AMO targets and subgroup achievement gaps. 0-Not Using No understanding how the principles of an effective PLC contributes to the desired outcome of student proficiency 1-Beginning Little understanding how the principles of an effective PLC contributes to the desired outcome of student proficiency 2-Developing Moderate understanding how the principles of an effective PLC contributes to the desired outcome of student proficiency 3-Applying Consistent understanding how the principles of an effective PLC contributes to the desired outcome of student proficiency 4-Innovating In addition to criteria of Applying, enhanced understanding, how the principles of an effective PLC contributes to the desired outcome of student proficiency Academic Services

Similar presentations


 – Problem- based ◦ What makes an outstanding response? Referring.>")


![[Insert your presentation title here.]. ASCD: A Worldwide Community of Educators.](/15/4510065/big_thumb.jpg "[Insert your presentation title here.]. ASCD: A Worldwide Community of Educators.>")


