Download presentation
Presentation is loading. Please wait.

1
Ray Massey and Ryan Milhollin Agricultural Economist University of Missouri Extension

2
Missouri is a significant forage-production state 6.9 million acres in permanent pasture (USDA Census of Agriculture, 2007) 3.7 million acres of hay harvested annually (USDA, 2012)
 3.7 million acres of hay harvested annually (USDA, 2012)")
3
Developed by USDA Risk Management Agency Available in Missouri since 2009 Mitigates forage production risk for forage and livestock producers For Missouri, it is based on a rainfall index, which provides coverage when precipitation falls below an area’s long- term, historical norm Deadline for purchase: November 17, 2014

5
Based on data from the NOAA Climate Prediction Center Data is specific to grid locations 0.25 degrees in latitude by 0.25 degrees in longitude About 17 miles N-S x 13 miles E-W NOT BASED ON INDIVIDUAL FARM DATA

6
Source: USDA – Risk Management Agency

8
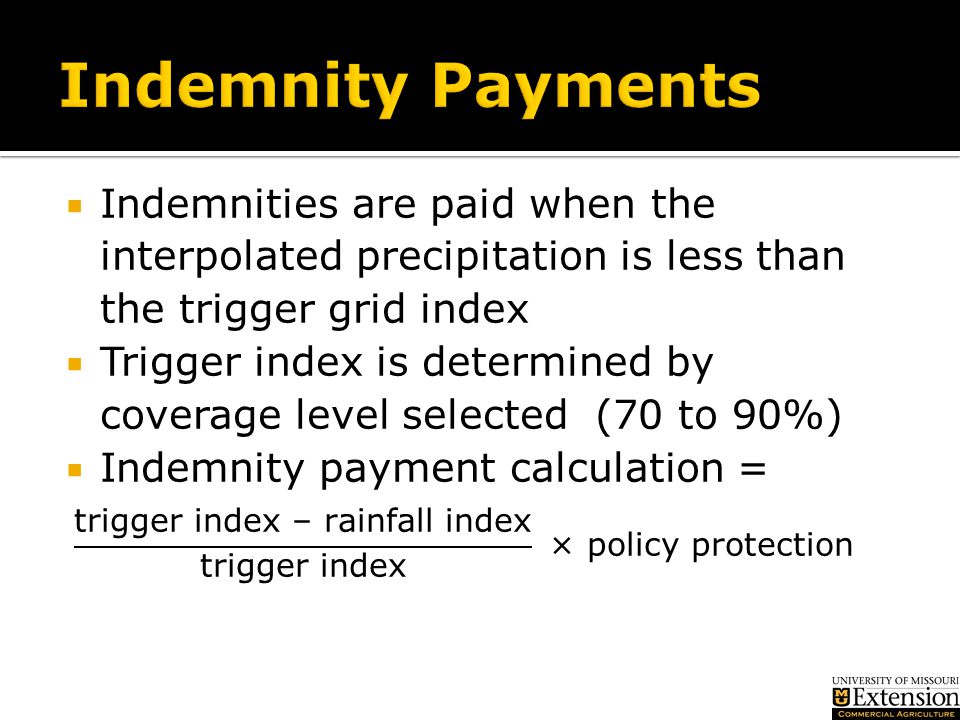
Government subsidizes the premiums An indemnity is paid when precipitation falls below a chosen coverage level

9
Different options include: Intended use Coverage level Productivity factor Index intervals Grid location

10
Producers select coverage for either grazing or haying purposes Only one purpose may be chosen per policy, but producers can have multiple policies on the same farm Example: 50 acres in one field for grazing and another field of 50 acres for haying RMA assigns a base county value for each grid and each purpose. In Missouri in 2014: Grazing = approximately $41 to $43 per acre Haying = approximately $142 per acre

11
Ranges from 70 to 90% in 5% increments Establishes the rainfall deviation from the index when insurance pays an indemnity Government subsidizes the program depending on the coverage level selected: Pays 51 percent of the premium at the 90 percent coverage level 55 percent for 80 and 85 coverage levels 59 percent for 70 and 75 coverage levels

12
Producers choose a productivity factor between 60 and 150 percent in 1% increments. Productivity factor adjusts the base county value (for haying or grazing) to reflect the productivity of the land Example: Original county base value = $142/acre Producer selects a 150% productivity factor New protection level = $213/acre ($142 x 150%)
 to reflect the productivity of the land Example: Original county base value = $142/acre Producer selects a 150% productivity factor New protection level = $213/acre ($142 x 150%).")
13
Coverage is based on two month intervals Consider type of forage, when precipitation is needed and intended use Percent of value must be allocated across intervals to equal 100 percent. Minimum of 10 percent per interval Maximum of 60 percent per interval PRF Index Intervals January and February February and March March and April April and May May and June June and July July and August August and September September and October October and November November and December

14
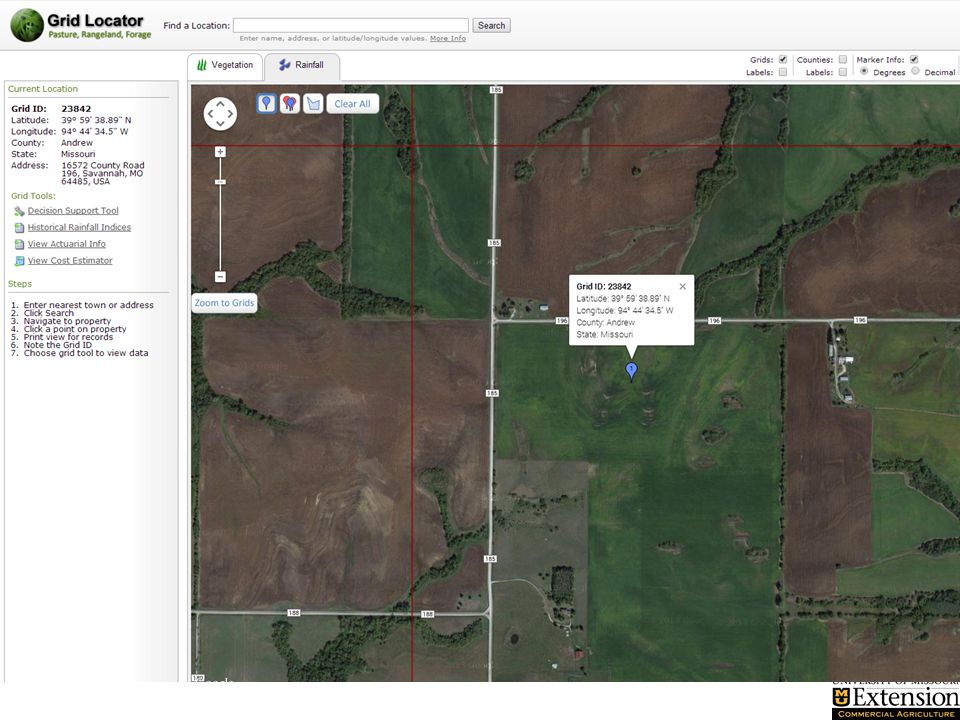
Grid identification is based on a point of reference selected by the producer Must be within the boundaries of the acreage to be insured Non-contiguous land areas and different intended uses may require the use of multiple points Grid Locator Tool: http://agforceusa.com/rma/ri/prf/maps

17
Index Interval Percent of value Producer premium per acre Actual index value Indemnity per acre May-June40$5.9755.6$29.43 July-Aug.40$5.1543.0$40.21 Sept.-Oct.20$3.4892.3$0.00 Total100$15.39N/A$69.64 A producer in Schuyler County, MO, insures a high-quality alfalfa crop in 2012 Grid location number: 24450 Intended use of land: haying Selected a 90% coverage level and 150% productivity factor Selected May-June, July-Aug. and Sept.-Oct. index intervals at 40 percent, 40 percent, and 20 percent respectively

18
Index interval Percent of value Producer premium per acre Actual index value Indemnity per acre May-June40$1.70134.8$0 July-Aug.40$1.6929.0$15.41 Sept.-Oct.20$0.9961.4$3.61 Total100$4.38N/A$19.02 Same producer as before in Schuyler County, MO, insured in 2011 Grid location number: 24450 Intended use of land: grazing Selected an 90% coverage level and 150% productivity factor Used May-June, July-Aug. and Sept.-Oct. index intervals at 40 percent, 40 percent, and 20 percent respectively

19
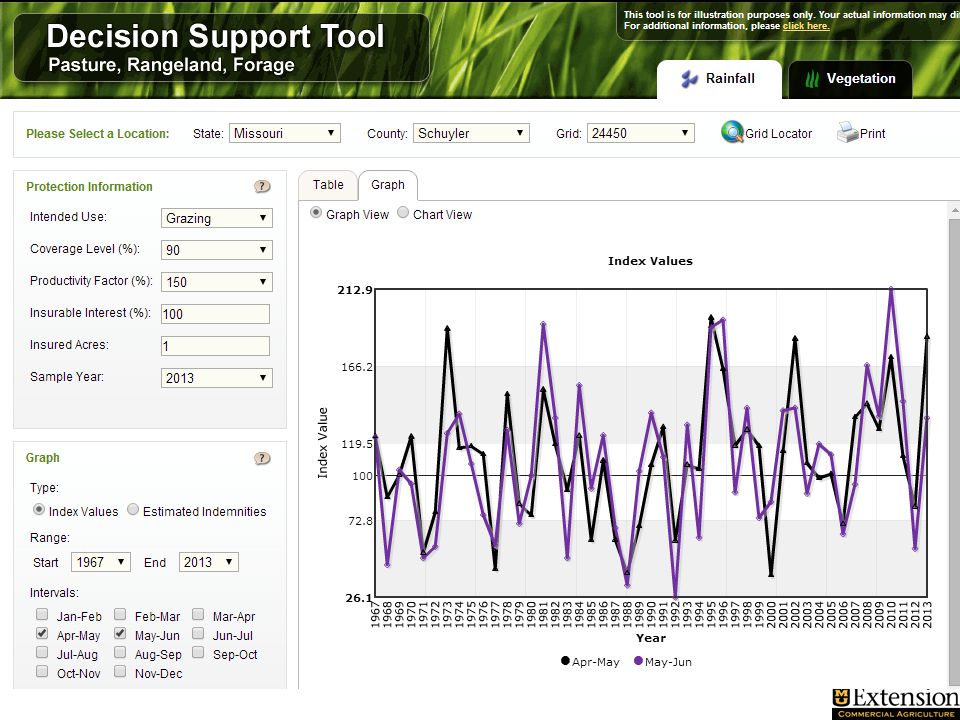
Tool developed by RMA to look at historical PRF policy information Allows users to select grid location and enter coverage options to view: Protection level Premiums Subsidies Index value Indemnities Decision Support Tool: http://agforceusa.com/rma/ri/prf/dst

22
An educational program designed to make precise weather information available to Missouri farmers in a way that assists them in managing their business Site-specific weather reports and advisories are sent to participating farmers via quickly downloaded emails

26
For more information on PRF insurance, contact a crop insurance agent. They are the best source to help you understand and customize a plan for your farm. USDA RMA Agent Directory: http://www3.rma.usda.gov/apps/agents http://www3.rma.usda.gov/apps/agents PRF Decision Support Tool http://agforceusa.com/rma/ri/prf/dst

27
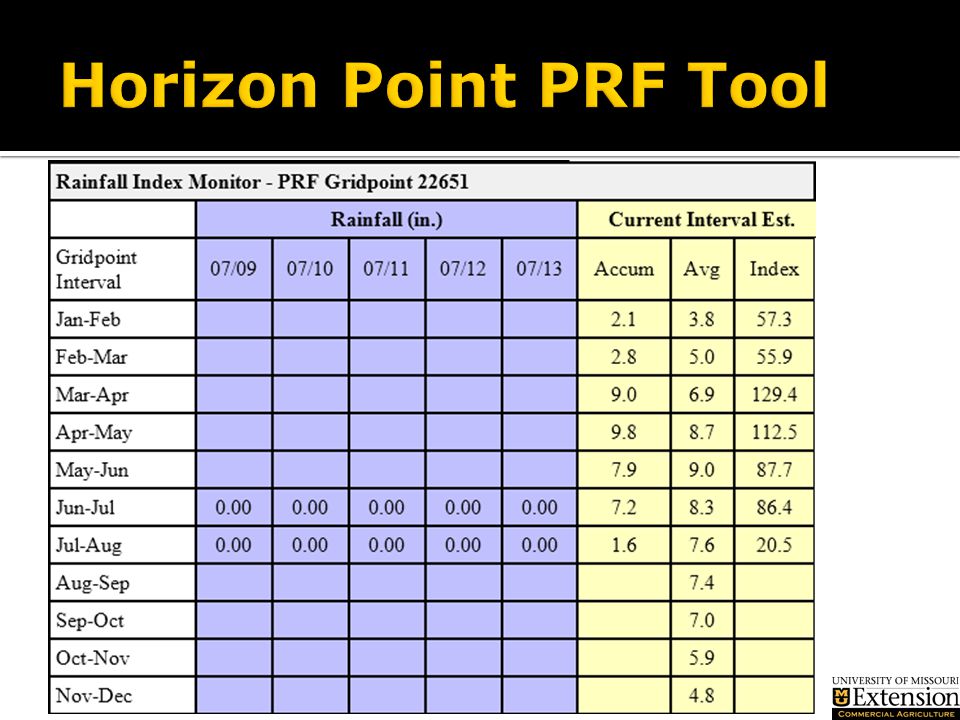
Determine your need. Contact your insurance salesperson. Sign up for the PRF tool of Horizon Point Go to University of Missouri PRF webpage for more information http://crops.missouri.edu/ insurance/prfinsurance.htm

Similar presentations


 Insurance Plan.>")


. Why should I insure my pasture & hayland? Good Risk Management Keep plans on track (maintain herd size)>")
>")