Download presentation
Presentation is loading. Please wait.

1
Kharif Review Rabi Prospects Strategies Dr. J. S. Sandhu Agriculture Commissioner Department of Agriculture & Cooperation, Ministry of Agriculture Dr. J. S. Sandhu Agriculture Commissioner Department of Agriculture & Cooperation, Ministry of Agriculture

2
C ROP PRODUCTION TARGETS:2014-15 Kharif weather: South West Monsoon highly erratic, delayed onset and initially progress was quite slow and June end with 43% deficient. Eleven per cent deficit rains at National level and 19 % deficit in North West India Deficient rains in Punjab, Haryana, Uttar Pradesh, Marathwada(Maharashtra), Telangana, Coastal Andhra Pradesh, East M P Incidence of flash floods in J&K, Assam, Bihar, Eastern UP and Odisha, Cloud burst (Uttarakhand & HP); Contingency plan for 565 districts implemented No serious disease/insect-pests observed (Million Tons/Bales) Crop KharifRabi-STotal Rice 92.0014.00106.00 Wheat -94.00 Barley -1.75 Maize 17.006.0023.00 Millets 14.252.5016.75 Pulses 7.0012.5019.50 Food grains 130.25130.75261.00 Oilseeds 22.0011.0033.00 Sugarcane -- 345.00 Cotton (170 Kg Bales) -35.00 Jute & Mesta (180 Kg Bales) - 11.20 Source: DAC, GOI
, Telangana, Coastal Andhra Pradesh, East M P Incidence of flash floods in J&K, Assam, Bihar, Eastern UP and Odisha, Cloud burst (Uttarakhand & HP); Contingency plan for 565 districts implemented No serious disease/insect-pests observed (Million Tons/Bales) Crop KharifRabi-STotal Rice Wheat Barley Maize Millets Pulses Food grains Oilseeds Sugarcane Cotton (170 Kg Bales) Jute & Mesta (180 Kg Bales) Source: DAC, GOI.")
3
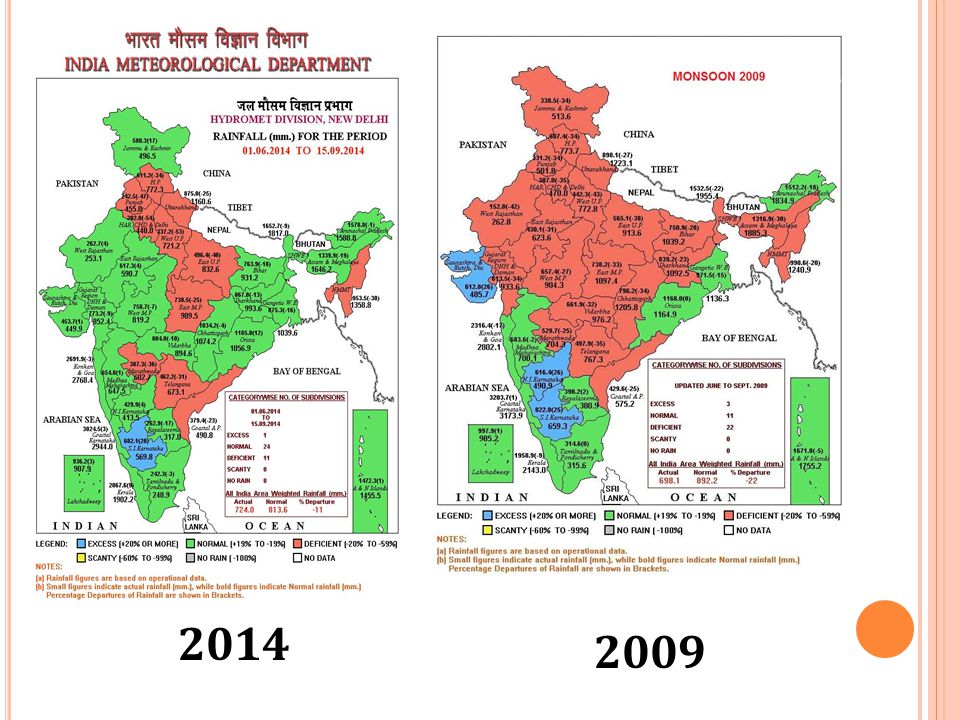
C UMULATIVE RAINFALL ( MM ): 2002-2014 South-West Monsoon Season Actual Normal Departure (%) 1 st June -30 th Sept-2002 737.3912.5-19 1 st June -09 th Sept-2009 622.5778.0-20 1 st June -12 th Sept-2012 732.1795.0 -8 1 st June – 11 th Sept-2013 834.1788.26 1 st June – 10 th Sept -2014 699.0781.5-11 Source: IMD. SW Monsoon recorded -11% Less rains. Monsoon coverage: Out of 36 sub-divisions, 25 sub-divisions constituting 72% of the total area have received excess/normal and 11 sub-divisions constituting 28% of total area received “Deficient” rains. Only one sub-division (South Interior Karnataka) received excess rainfall
 received excess rainfall.")
4
2014 2009
5
D ISTRIBUTION OF RAINFALL AT DISTRICT L EVEL ( IN PERCENTAGE ) - 2009, 2012, 2013, 2014 Deficient/Scanty rainfall districts – 68 (UP), 22 (MP),21 (Haryana), 18 (Bihar) total 280 out of 641.
 , 2012, 2013, 2014 Deficient/Scanty rainfall districts – 68 (UP), 22 (MP),21 (Haryana), 18 (Bihar) total 280 out of 641.")
6
Region 20142013 Northern Region 72 95 Eastern Region78 Western Region7877 Central Region9087 Southern Region7282 All India7783 10 Years Average72 Out of 85, 72 reservoirs more than 80% of normal storage & 13 reservoir below 80% of normal storage ( Tripura 39%, AP 50%, UP 51%) 2014 ( 120BCM), 2013 (129BCM) & 10 year average (111 BCM) Source: CWC, GOI. As on 11.09.2014 Region wise live storage (%) of water in major reservoirs in 2014 & 2013.
 of water in major reservoirs in 2014 &")
7
A REA COVERAGE OF KHARIF CROPS ( LAKH HA ) ------------- Progress of Sowing --------------- -----------------Lakh ( ha.)---------------
 Progress of Sowing Lakh ( ha.)")
8
Area in Million ha Crop 2014 2013 change Rice 36.66 36.78-0.12 Maize 7.77 8.19-0.42 Millets 9.82 11.30-1.48 Total Cereals 54.25 56.27- 2.02 Normal Area54.92 -0.67 Source: SDA Area coverage of Kharif Cereal -2014 & -2013 *As on 12.09.2014

9
Area in Million ha Crop20142013change Arhar 3.51 3.83-0.32 Black gram 2.45 2.370.08 Moong 2.04 2.39-0.35 Total pulses 9.92 10.62-0.70 Normal Area10.3 -0.38 Source: SDAs Area coverage of kharif Pulses-2014 & - 2013 *As on 12 09.2014

10
. Area in Million ha Crop20142013 Change Groundnut 3.64 4.25 -0.61 Soybean 11.01 12.22 -1.21 Total Kharif Oilseeds 17.52 19.16 -1.63 Normal Area17.53 -0.01 Source: SDAs Area coverage of Kharif Oilseeds 2014 & - 2013 *As on 12.09.2014

11
A REA COVERAGE OF K HARIF C ASH C ROPS 2014 & 2013 Unit: Area in Million ha Crop Normal 20142013change Cotton 11.0312.52 11.35+1.17 Jute & Mesta 0.850.81 0.83-0.02 Sugarcane 4.834.87 5.03-0.15 Source: SDA *As on 12.09.2014

12
Region specific Crop planning -Focus on the districts having higher area concentration of a crop; Pre-positioning Inputs: Seeds, bio-agents/ Agro- chemicals, Soil amendments- Lime, Gypsum, Fertilizers, Micro-nutrients Moisture Conservation & Timely sowing :Laser Land Leveller, Zero till Seed drill, Rotavator, Happy Seeder, Focus on Fallow Area: specifically fallow kharif (3.37 Million Ha) areas left unsown due to delayed monsoon Optimum & efficient use of conserved water: Micro- irrigation Promotion of Relay cropping / Intercropping: To enhance the production and profitability. Region specific Crop planning -Focus on the districts having higher area concentration of a crop; Pre-positioning Inputs: Seeds, bio-agents/ Agro- chemicals, Soil amendments- Lime, Gypsum, Fertilizers, Micro-nutrients Moisture Conservation & Timely sowing :Laser Land Leveller, Zero till Seed drill, Rotavator, Happy Seeder, Focus on Fallow Area: specifically fallow kharif (3.37 Million Ha) areas left unsown due to delayed monsoon Optimum & efficient use of conserved water: Micro- irrigation Promotion of Relay cropping / Intercropping: To enhance the production and profitability. Strategies for Rabi : 2014-15
 areas left unsown due to delayed monsoon Optimum & efficient use of conserved water: Micro- irrigation Promotion of Relay cropping / Intercropping: To enhance the production and profitability. Strategies for Rabi :")
13
REQUIREMENT & AVAILABILITY OF SEEDS FOR R A BI: 2014-15 CropREQUIREMENT (Lakh quintal) AVAILABILITY (Lakh quintal) DEFICIT/ SURPLUS SRR (2013-14) Wheat112.53116.85(+) 4.3234.2 Rabi Jowar1.061.13(+) 0.0725.7 Bengal gram 16.1115.72(-) 0.3922.8 Urd & Moong 1.351.62(+) 0.2744.8 Lentil1.781.38(-) 0.4027.0 Rape seed & Mustard 2.642.70(+) 0.0664.1 Source: Seed Division, DAC, GOI.
 AVAILABILITY (Lakh quintal) DEFICIT/ SURPLUS SRR ( ) Wheat (+) Rabi Jowar (+) Bengal gram (-) Urd & Moong (+) Lentil (-) Rape seed & Mustard (+) Source: Seed Division, DAC, GOI.")
14
REQUIREMENT & AVAILABILITY OF FERTILIZERS FOR R ABI : 2013-14 & RABI: 2014-15 Fertilizers Rabi: 2013-14 Rabi: 2014-15 Assessed requirement (Lakh tons) Total sales (Lakh Tons) Assessed requirement (Lakh Tons) Urea171.96153.55164.08 DAP45.2636.7347.87 MOP14.8710.9315.41 NPK52.5342.5550.21 SSP42.8520.9535.08 Use of Bio-fertilizers- 40324 MT (2011-12) Increases (62%) to 65528 MT (2013-14) Azosprillium, Azotobacter, Rhizobium, Phosphate Solubilizing bacteria, Potash mobilizing bacteria reduce dose of N,P,K, fertilizer by 25%. Use of micronutrients Deficiency- Sulphur 46%, Zinc 49% Boron 33%; Molybdenum 13%; magnesium 5% Copper 3 %. Source: INM & FMS, DAC, GOI

15
N EW I NITIATIVES FOR RABI: 2014-15 To enhance pulses production North Eastern states & Hilly States included under NFSM- Pulses Additional Allocation of Rs 300 crores Promotion of Coarse grain cereals, all states included under NFSM – Coarse grain cereals Higher level seed subsidy for replanting where crops damaged during kharif season To enhance pulses production North Eastern states & Hilly States included under NFSM- Pulses Additional Allocation of Rs 300 crores Promotion of Coarse grain cereals, all states included under NFSM – Coarse grain cereals Higher level seed subsidy for replanting where crops damaged during kharif season

16
S PECIFIC I SSUES Yellow Rust & Karnal Bunt: strategy to management of these diseases Enforcement of Seed Certification Standards: wheat karnal bunt Area specific application of Micronutrients – sulphur, Molybdenum, Zinc, Boron, etc Promotion seed production during off season to make up the deficiency Advance planning for Summer pulses.

17
WAY FORWARD Linkages & Coordination: SAU/ICAR Institutes/KVKs for technical backstopping & Other central ministries; Timely crop tracking & close monitoring of weather situation; and Timely implementation & monitoring of crop development programs.

18
THANK YOU Thanks

Similar presentations


 Commissionerate.>")
