Download presentation
Presentation is loading. Please wait.

1
What is the trend? #1) For the ecosystem shown below, calculate the % of energy in Kilocalories transferred from one level to the next. Level # of Kilocalories Available % of Kilocalories Reta ined Producers 20,810 -------------------- Primary Consumers 3,368 Secondary Consumers 383 Tertiary Consumers21
 For the ecosystem shown below, calculate the % of energy in Kilocalories transferred from one level to the next. Level # of Kilocalories Available % of Kilocalories Reta ined Producers 20, Primary Consumers 3,368 Secondary Consumers 383 Tertiary Consumers21.")
9
1970 Clean Air & Water Act

16
W ATER Q UALITY I NDEX 1970 National Sanitation Foundation devised a standard scale to rate or “grade” the quality of water The WQI is based on nine different biotic and abiotic factors We will test six of these factors in our investigation: temperature, dissolved oxygen, pH, total dissolved solids, benthic macroinvertebrate diversity and fecal coliform levels

19
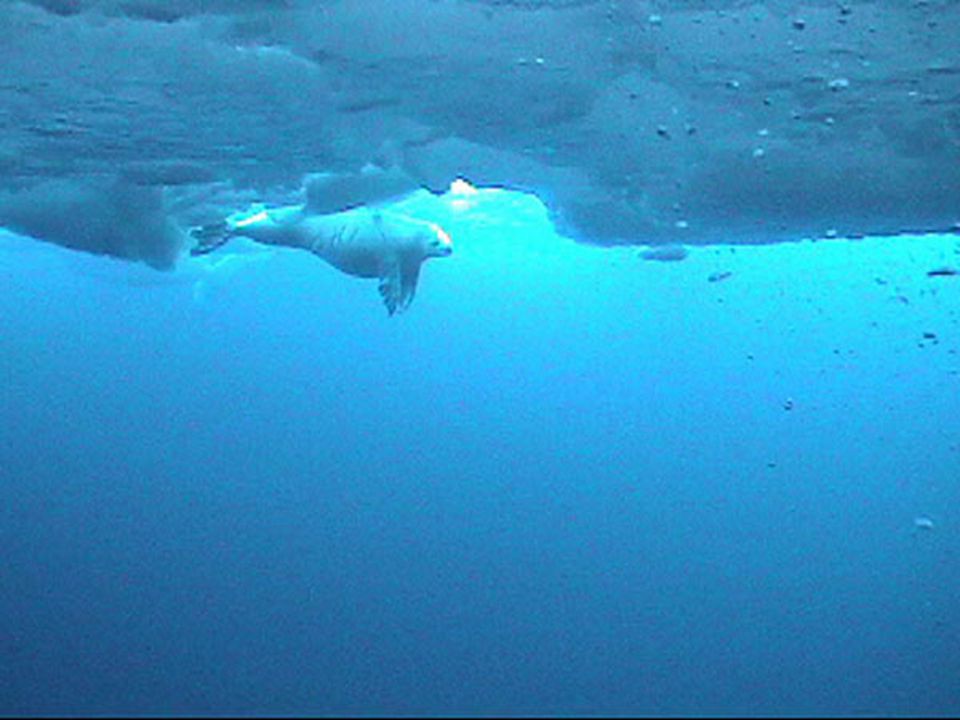
Physiology of Mammalian Diving Reflex In response to need to conserve oxygen, cold water causes reduction in heartbeat (bradycardia), constriction of bloodflow and a shift of blood to the thoracic cavity True only of homeotherms
, constriction of bloodflow and a shift of blood to the thoracic cavity True only of homeotherms")
20
Why is this response necessary in homeotherms?

21
Biological Oxygen Demand (B.O.D.) Fish, invertebrates, plants, and aerobic bacteria all require oxygen for respiration. The amount of oxygen required by an ecosystem is its Biological Oxygen Demand (B.O.D.)
.")
22
Dissolved Oxygen (D.O.) Amount of oxygen gas dissolved in 1million molecules of water Can range from 0-18ppm normally 5-6ppm needed to sustain most complex aquatic life
 Amount of oxygen gas dissolved in 1million molecules of water Can range from 0-18ppm normally 5-6ppm needed to sustain most complex aquatic life")
23
Sources of Dissolved Oxygen Much of the dissolved oxygen in water comes from the atmosphere. After dissolving at the surface, oxygen is distributed by current and turbulence. Algae and rooted aquatic plants also deliver oxygen to water through photosynthesis.

24
How Do Organisms Stay Underwater All Winter?

25
Temperature v. Dissolved Oxygen Purpose: To determine the nature of the relationship (if any) between dissolved oxygen concentration and temperature. Hypothesis: What do you think the relationship is between these variables? Direct, indirect, optimal or no relationship? What is your reasoning for this?
 between dissolved oxygen concentration and temperature. Hypothesis: What do you think the relationship is between these variables. Direct, indirect, optimal or no relationship. What is your reasoning for this .")
26
Getting Started 1) Plug in the Dissolved oxygen probe to Channel 1 of the LabQuest 2) Plug in the Stainless Steel Temperature Probe to Channel 2 of the LabQuest 3) Power up LabQuest 4) Set up sensors for channels 1 & 2 from sensors menu 5) D.O. probe must be “warmed up” for 10 minutes before data collection

27
Applying The Variable Fill one 250 mL beaker with ice & water Fill one 250 mL beaker with 40-50 water (use hotplate & thermometer) Place 100 mL of ice water in milk jug & shake for 2 minutes Pour “aerated water” from jug into paper cup and place both temp & D.O. probe into cup. Let the values stabilize for about 1 minute Record the temp & D.O. of the water in the cup in data table

28
Repeat Pour 75 mL of the ice water from the cup back into the milk jug Add 25 mL of the 40-50 °C water to the milk jug Re-aerate/shake for 2 minutes and repeat temp/D.O. sampling Repeat previous sampling steps until water temp in paper cup is appx. 35 ° C.

30
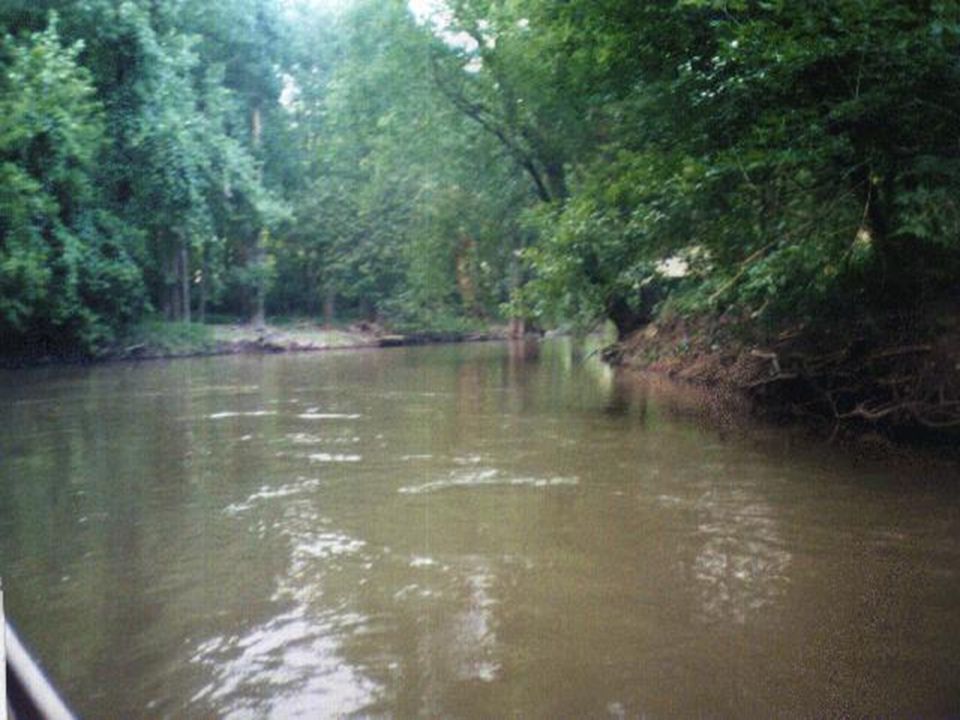
Why Did The Catfish Survive?

31
1) Temperature High temperatures may indicate thermal pollution and place organisms at risk Temperatures may also increase the rate of metabolism, raising the biological oxygen demand (B.O.D.) Temperatures negatively impact the amount of dissolved oxygen
 Temperature High temperatures may indicate thermal pollution and place organisms at risk Temperatures may also increase the rate of metabolism, raising the biological oxygen demand (B.O.D.) Temperatures negatively impact the amount of dissolved oxygen")
33
The change in temperature with depth is called a THERMOCLINE

34
2) DISSOLVED OXYGEN Measures the amount of oxygen dissolved in water Important for aquatic organisms regarding cellular respiration Can also indirectly measure the amount of autotrophs in an aquatic ecosystem
 DISSOLVED OXYGEN Measures the amount of oxygen dissolved in water Important for aquatic organisms regarding cellular respiration Can also indirectly measure the amount of autotrophs in an aquatic ecosystem")
37
pH Measurement of acidity or alkalinity in the water source Extremely acidic or basic pH may indicate industrial runoff (i.e. soaps, batteries, etc.) Moderately acidic pH may indicate higher rates of decomposition (due to CO2 output)
 Moderately acidic pH may indicate higher rates of decomposition (due to CO2 output).")
38
Different aquatic organisms have different ranges of pH tolerance

39
4) Total Dissolved Solids (TDS) Measurement of how much organic and inorganic matter is being carried in the water High TDS values indicate high amounts of erosion upstream Dissolved solids may also block sunlight and/or their decomposition may reduce the dissolved oxygen of the water source
 Total Dissolved Solids (TDS) Measurement of how much organic and inorganic matter is being carried in the water High TDS values indicate high amounts of erosion upstream Dissolved solids may also block sunlight and/or their decomposition may reduce the dissolved oxygen of the water source")
41
Q Values Each biotic or abiotic measurement should be compared with its unweighted Q value table The Q value is the “grade” for that aspect of the water quality For dissolved oxygen, the Q value is obtained by dividing the measured D.O. (from the probe) by the saturated O2 level This % is used to find Q
 by the saturated O2 level This % is used to find Q.")
42
FINAL ABIOTIC WQI SCORE Each of the four Q values is multiplied by its relative weight to determine the abiotic WQI D.O. Q Score x 0.38 pH Q Score x 0.24 Temp. Q Score x 0.22 TDS Q Score x 0.16 Sum of Weighted Q Scores = WQI

43
Biotic Measures of Water Quality

44
Fecal Coliform

45
Fecal v. General Coliform General Coliform = bacteria that has come in contact with plant or animal life Fecal Coliform = Bacteria from the digestive tract of mammals or birds

48
Benthic Macroinvertebrates Bottom-dwelling, spineless animals Some species are very pollution tolerant while others are not Depending upon the diversity of macroinvertebrates, one may indirectly assess the river’s health re: nitrogen and phosphorus

Similar presentations


>")


