Download presentation
Presentation is loading. Please wait.

1
降雨誘發淺層山崩模型土壤強 度參數逆分析之比較與驗證 Adviser: 董家鈞、劉家男 Student: 陳麒任

2
Introduction – Objective – Literature Review Methodology – Data base – Back analysis Result and Discussion Conclusions and Recommendation

3
Qualitative analysis Empirical method Quantitative analysis Statistic method Discriminant analysis Logistic regression Conditional Probability Approach Artificial intelligence Fuzzy Theory neural network Deterministic analysis Rainfall trigger landslide Earthquake trigger landslide

4
Observed landslide inventory Deterministic analysis Parameters Lab test DEM Slope Soil depth Rainfall intensity hydraulic conductivity In situ test or Empirical methods Remote sensing unit weight of soil Lab test Deterministic analysis Predicted landslide inventory DEM Slope Soil depth Rainfall intensity Godt et al. (2008) Cohesion Friction angle hydraulic conductivity In situ test or Empirical methods Remote sensing unit weight of soil 4
 Cohesion Friction angle hydraulic conductivity In situ test or Empirical methods Remote sensing unit weight of soil 4.")
5
Observed Predicted

6
1)Extensive work to get reliable data. [ 林衍丞, 2009] 2)Strength parameter and hydraulic parameter are difficult to obtain. [ 李錫堤, 2009] 3)There are scale issues involved in the translation of laboratory values to the field problem. [Guimaraes, 2003] 4) Back analysis of strength has advantages over lab testing in that the scale is much larger. [Gilbert,1998] 5)Back analysis is reliable only when the model and all assumptions are reasonable and accurate representations of the real system[Deschamps, 2006]
Strength parameter and hydraulic parameter are difficult to obtain. [ 李錫堤, 2009] 3)There are scale issues involved in the translation of laboratory values to the field problem. [Guimaraes, 2003] 4) Back analysis of strength has advantages over lab testing in that the scale is much larger. [Gilbert,1998] 5)Back analysis is reliable only when the model and all assumptions are reasonable and accurate representations of the real system[Deschamps, 2006].")
7
Exist many back analysis criterion. Efficiency: ( + )/( + + + )Sensitivity: /( + )Specificity: /( + ) Observed Predicted Observed Unstable Stable Predicted Unstable Stable True Positives (TP) False Positives (FP) False Negatives (FN) True Negatives (TN) 7
/( )Sensitivity: /( + )Specificity: /( + ) Observed Predicted Observed Unstable Stable Predicted Unstable Stable True Positives (TP) False Positives (FP) False Negatives (FN) True Negatives (TN) 7.")
8
However, the output of back analysis is usually uncertain because of the random factors existing in the problem. [Zheng, 2008] Methodologies used for back analysis can be classified into two groups, i.e., deterministic method and probabilistic method.[Zhang, 2010]

9
1)Compare the existing back analysis criterion. 2)Compare the result of deterministic method and probabilistic method.
Compare the result of deterministic method and probabilistic method..")
10
Rainfall-induced landslide model This research use TRIGRS, a Fortran program developed by USGS. The Transient Rainfall Infiltration and Grid-Based Regional Slope- Stability.

11
Theoretical Basis Infinite-slope stability – Landslide with planar failure surfaces. – Slide depth is much smaller than length and width. where c’ is soil cohesion for effective stress, Φ’ is the soil friction angle for effective stress, γ w is unit weight of groundwater, and γ s is soil unit weight, β is slope angle, ψ is pressure head. 11

12
Back analysis parameters 林衍丞, 2009

13
ROC 林衍承 (2009) Collect the back analysis criterion 1)Maximum Efficiency( 林衍丞, 2009) 。 2)Maximum AUC ( 林衍丞, 2009) 。 3)Efficiency greater than 80%, Sensitivity greater than 60% and Specificity greater than 90%( 中興工程顧問社 , 2004) 。 1)Maximum Efficiency( 林衍丞, 2009) 。 2)Maximum AUC ( 林衍丞, 2009) 。 3)Efficiency greater than 80%, Sensitivity greater than 60% and Specificity greater than 90%( 中興工程顧問社 , 2004) 。 4)Maximum Develop Sensitivity FS=1FS=1.5 Sensitivity Specificity FS=0.5
 Collect the back analysis criterion 1)Maximum Efficiency( 林衍丞, 2009) 。 2)Maximum AUC ( 林衍丞, 2009) 。 3)Efficiency greater than 80%, Sensitivity greater than 60% and Specificity greater than 90%( 中興工程顧問社 , 2004) 。 1)Maximum Efficiency( 林衍丞, 2009) 。 2)Maximum AUC ( 林衍丞, 2009) 。 3)Efficiency greater than 80%, Sensitivity greater than 60% and Specificity greater than 90%( 中興工程顧問社 , 2004) 。 4)Maximum Develop Sensitivity FS=1FS=1.5 Sensitivity Specificity FS=0.5")
14
Study Area 14

15
Input Data Soil depth 15

16
Slope Input Data

17
2001/7/29 ~ 2001/7/30 Storm event

18
parameter Unit weight of soil (kN/m 3 ) saturated vertical hydraulic conductivity (m/s) Initial infiltration rate (m/s) hydraulic diffusivity (m 2 /s) initial water-table depth (m) Value205E-51E-65E-5 Equal to soil depth Input parameters Consider Salciarini(2008), Godt(2008)
 saturated vertical hydraulic conductivity (m/s) Initial infiltration rate (m/s) hydraulic diffusivity (m 2 /s) initial water-table depth (m) Value205E-51E-65E-5 Equal to soil depth Input parameters Consider Salciarini(2008), Godt(2008)")
19
(A)Develop sensitivity (B)Efficiency (C)Efficiency greater than 80%, Sensitivity greater than 60% and Specificity greater than 90% (D)AUC Result and Discussion
Develop sensitivity (B)Efficiency (C)Efficiency greater than 80%, Sensitivity greater than 60% and Specificity greater than 90% (D)AUC Result and Discussion")
20
Criterion B :Efficiency 1.Low failure ratio 2.Overestimate parameters 3.Underestimate landslide 4.Select parameters hardly SensitivityEfficiencySpecificityDevelop sensitivity 0.0760.8900.9940.072

21
Criterion A,C SensitivityEfficiencySpecificityDevelop sensitivity 0.7170.8040.8160.293 1.Good constrain 2.Low friction angle 3.High cohesion 4.Assumption problem (depth, variable)
")
22
Tiwari (2000,2005) assumed factor of safety is equal to 0.98 for back analysis cohesion and friction angle. AuthorDate Sensitivity SpecificityEfficiency Godt20080.420.840.80 Sensitivity= 0.4~0.44 Specificity=0.80~0.88 Efficiency=0.75~0.85

23
SensitivityEfficiencySpecificityDevelop sensitivity 0.40500.82580.87940.2080

24
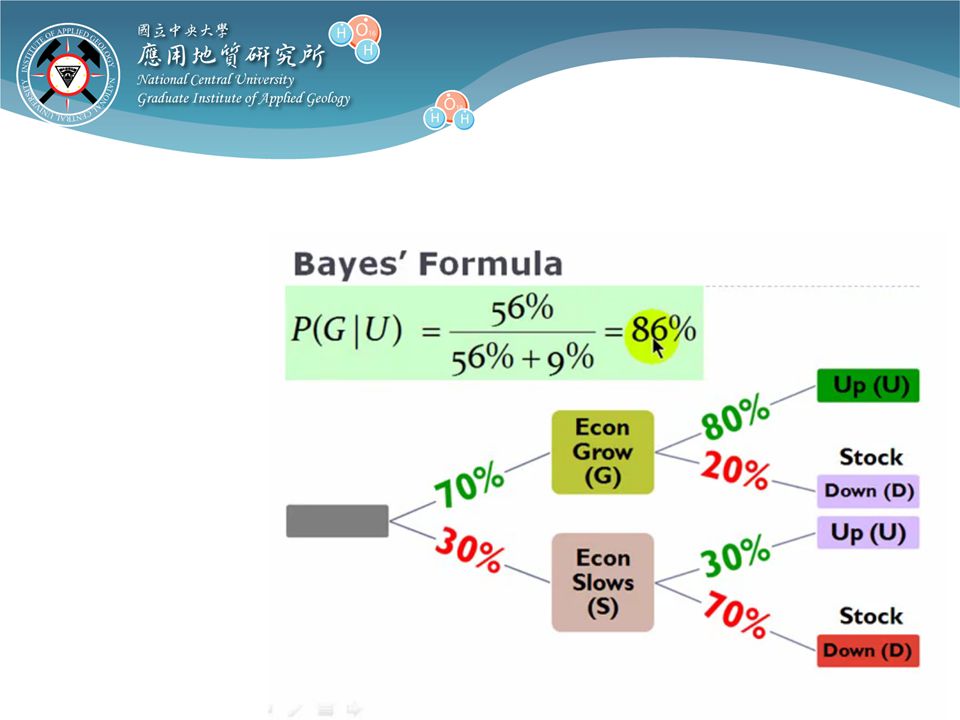
Bayesian theorem: Updates a probability given new information

26
凝聚力 摩擦角 山崩 不山崩 (mean) (coefficient of variance) cohesion8 kPa0.2 Friction angle30°0.1 Chen et al.(2005)
 (coefficient of variance) cohesion8 kPa0.2 Friction angle30°0.1 Chen et al.(2005)")
27
Zhang et al.(2010):Back analysis of slope failure with Markov chain Monte Carlo simulation Gilbert et al.(1998):Uncertainty in back analysis of slopes: Kettlemen Hills case history Fs P 1 Sensitivity Specificity Efficiency P 0.42 0.84 0.8
:Back analysis of slope failure with Markov chain Monte Carlo simulation Gilbert et al.(1998):Uncertainty in back analysis of slopes: Kettlemen Hills case history Fs P 1 Sensitivity Specificity Efficiency P")
28
Mean of cohesion (kPa) COV of cohesion Mean of friction angle(°) COV of friction angle After update8.870.1335.580.03 Before update80.2300.1
 COV of cohesion Mean of friction angle(°) COV of friction angle After update Before update")
Similar presentations
>")


 of representative samples or strength parameters or slope.>")


