Download presentation
Presentation is loading. Please wait.

1
May 2007 Hua Fan University, Taipei An Introductory Talk on Reliability Analysis With contribution from Yung Chia HSU Jeen-Shang Lin University of Pittsburgh

2
Supply vs. Demand Failure takes place when demand exceeds supply. For an engineering system: –Available resistance is the supply, R –Load is the demand, Q –Margin of safety, M=R-Q The reliability of a system can be defined as the probability that R>Q represented as:

3
Risk The probability of failure, or risk How to find the risk? –If we known the distribution of M; –or, the mean and variance of M; –then we can compute P(M<0) easily.
 easily..")
4
Normal distribution: the bell curve For a wide variety of conditions, the distribution of the sum of a large number of random variables converge to Normal distribution. (Central Limit Theorem)
.")
5
IF M=Q-R is normal When Because of symmetry Define reliability index

6
Example: vertical cut in clay If all variables are normal,

7
Some basics Negative coefficient

8
Engineers like Factor of safety F=R/Q, if F is normal reliability index

9
Lognormal distribution The uncertain variable can increase without limits but cannot fall below zero. The uncertain variable is positively skewed, with most of the values near the lower limit. The natural logarithm of the uncertain variable follows a normal distribution. F is also often treated as lognormal

10
In case of lognormal Ln(R) and ln(Q) each is normal
 and ln(Q) each is normal")
11
The MFOSM method assumes that the uncertainty features of a random variable can be represented by its first two moments: mean and variance. This method is based on the Taylor series expansion of the performance function linearized at the mean values of the random variables. First order second moment method

12
Taylor series expansion

13
Example: vertical cut in clay If all variables are normal, 1-normcdf(1.8896,0,1)1-normcdf(1.8896,0,1) MATLAB
1-normcdf(1.8896,0,1) MATLAB")
14
Slope stability 2 (H): 1(V) slope with a height of 5m
: 1(V) slope with a height of 5m")
15
Reliability Analysis The reliability of a system can be defined as the probability that R>Q represented as:

16
FS contour,, 0.21.

17
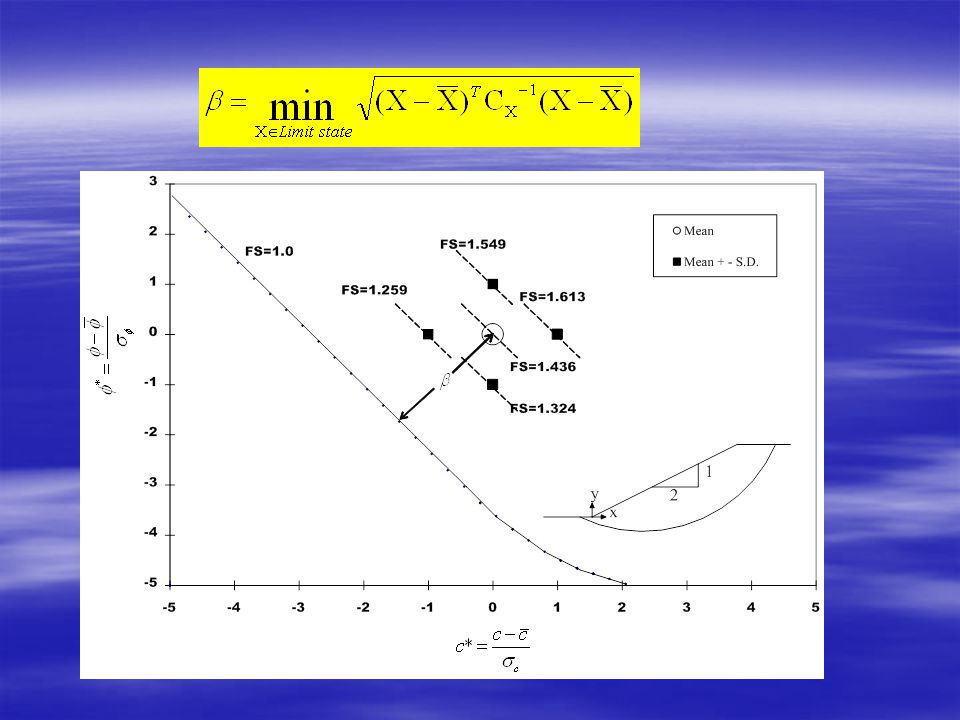
First Order Reliability Method Hasofer-Lind (FORM) Probability of failure can be found obtained in material space Approximate as distance to Limit state
 Probability of failure can be found obtained in material space Approximate as distance to Limit state")
18
Distance to failure criterion If F=1 or M=0 is a straight line Reliability becomes the shortest distance

19
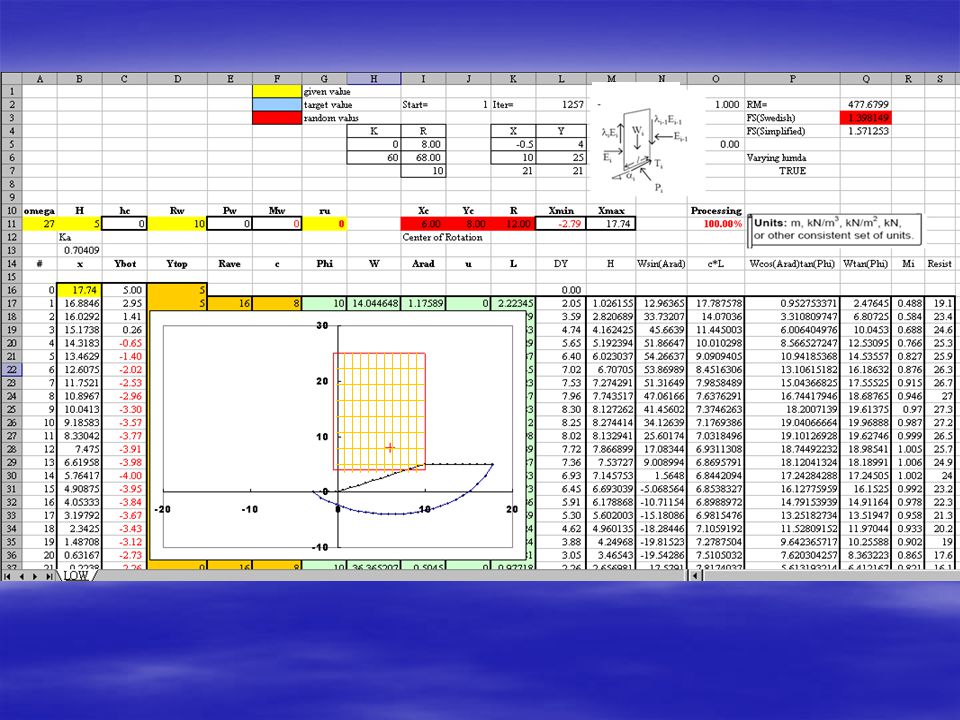
Constraint Optimization:Excel

20
May get similar results with FOSM FOSM 1-normcdf(1. 796,0,1)1-normcdf(1. 796,0,1)=0.0362 MATLAB
1-normcdf(1. 796,0,1)= MATLAB")
21
Monte Carlo Simulation correlation=0 Monte Carlo=0.0495

22
Monte Carlo Simulation correlation=0.5 FORM=0.0362

24
FS=1.0 (M=0) UNSAFE Region FS<1 or M<0 The matrix form of the Hasofer-Lind (1974)
 UNSAFE Region FS<1 or M<0 The matrix form of the Hasofer-Lind (1974)")
25
The matrix form of the Hasofer-Lind (1974) FOS=1 Soil properties>0 Soil properties
 FOS=1 Soil properties>0 Soil properties")
28
FS=1.0 UNSAFE Region FS<1 or M<0 Correlation=0 Correlation=-.99 Correlation=.99

29
The distance

30
FOSM maybe wrong FOSM

31
A projection Method Check the FOSM Use the slope, projected to where the failure material is Use the material to find FS If FS=1, ok

33
May 2007 Hua Fan University, Taipei

Similar presentations


 Working with normal distributions.>")


 of representative samples or strength parameters or slope.>")


