Download presentation
Presentation is loading. Please wait.

1
February 29, 2012

2
Convergence Reduced Cost Increased Revenue Productive vs. New Revenues A “Plan” Land Use / Finance / Services

3
Diversity 5 “D”s 2 “E”s Environmental Energy Market Do You Have A “New Market”? Sell Your Plan

4
Productive Revenues 1 Reduced Infrastructure Needs/Cost 2 Environmental Benefits 3 Communicating the Benefits 4

5
Smart Growth Characteristics (Ewing & Cervero): 1. Destination Accessibility 2. Design 3. Diversity 4. Distance to Transit 5. Density

6
5D’s Destination Accessibility Design Diversity Distance to Transit Density Economics Enhanced Revenues Reduce Costs and Environmental Impacts

7
Primary Revenue Sources Available: Property Tax Sales Tax Gas Tax Which Revenue Sources Are Enhanced with Smart Growth Initiatives?

8
Revenue SourceProductiveUnproductive Property TaxX Sales TaxX Gas TaxX

9
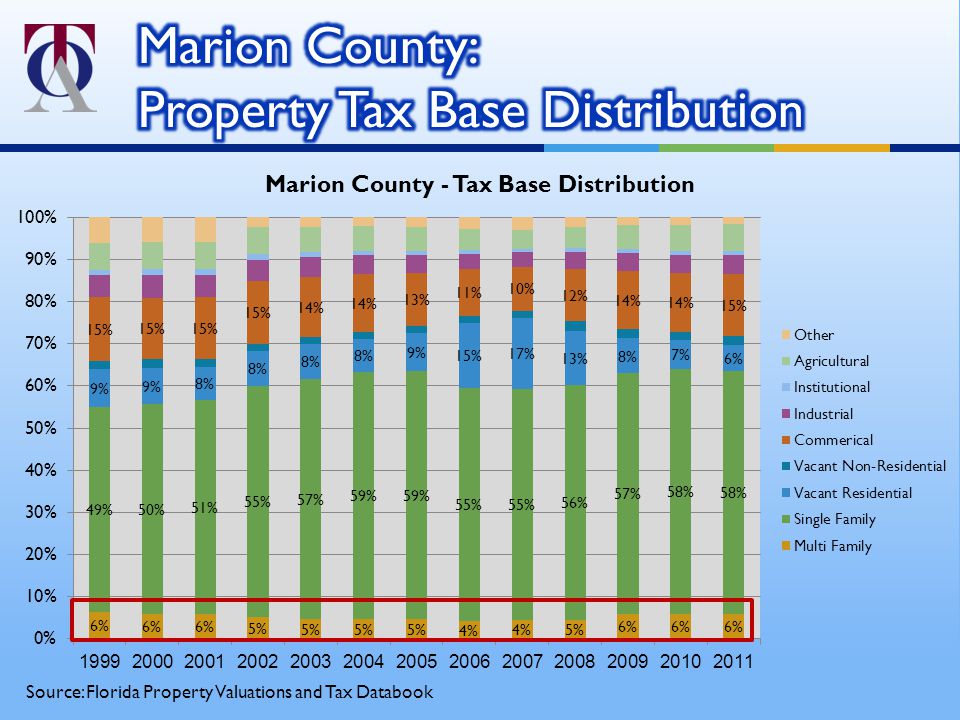
Property Taxes Enhanced with Destination, Diversity, Design, and Density Enhanced Over Time

10
Legend Single Use Areas

11
Legend Mixed Use/TOD A1 A2A3 C2C3 C1

12
C1 C2 C3

13
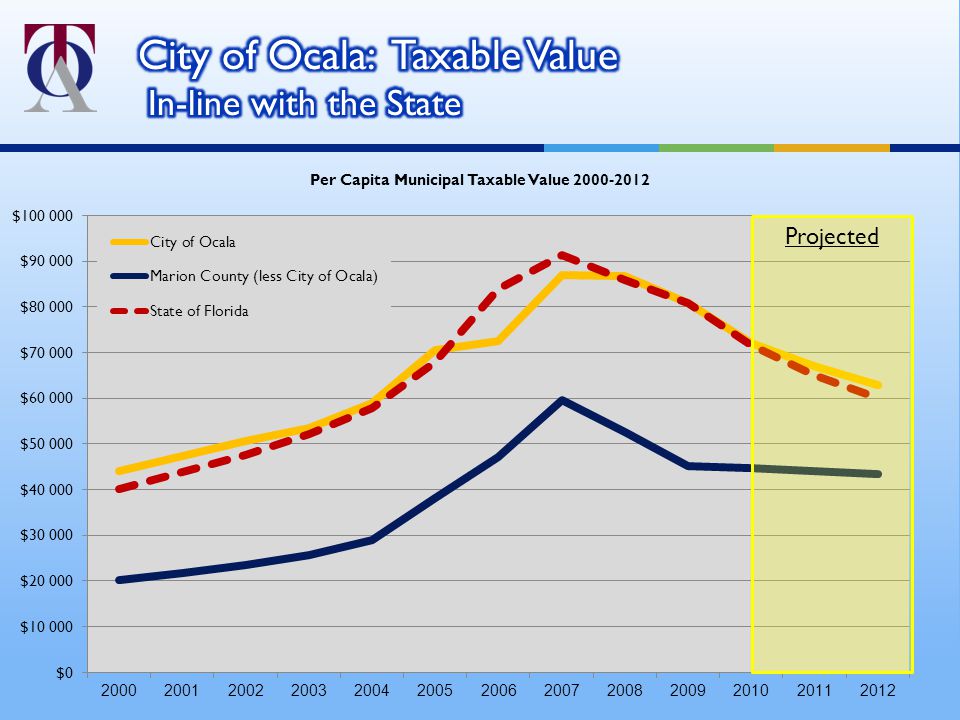
Projected

14
Single Use District

15
Projected

16
Annex Area

17
Source: Florida Property Valuations and Tax Databook

19
Property Taxes Taxable Value of New Homes Are Higher Larger Structures More Valuable Structures Generate More Tax Revenues Statewide Per Capita Property Tax Increased by 5% Annually Past 15 years

20
Average Value of All Homes vs. New Homes Sale YearAll HomesNew Homes 2009$117k$178k 2010$107k$165k 2011$98k$182k The average square footage of a new single-family home 1950 983 sq.ft. 1970 1,500 sq.ft. 1990 2,080 sq.ft. 2004 2,349 sq.ft. Source: National Association of Home Builders (Housing Facts, Figures and Trends for March 2006)
.")
21
Collier Palm Beach Sarasota Lee

22
Collier

23
Sales Taxes Related to Income Levels Enhanced with Density Per Capita Increase Over Time

24
Orange

25
Osceola

26
Collier Sarasota Palm Beach Indian River Martin

27
Gas Taxes Related to Travel (per Gallon Charge) Reduced with Density Per Capita Decrease Over Time with Fuel Efficiency
 Reduced with Density Per Capita Decrease Over Time with Fuel Efficiency")
28
Highlands Sumter

29
Productive Revenues 1 Reduced Infrastructure Needs/Cost 2 Environmental Benefits 3 Communicating the Benefits 4

30
5D’s Destination Accessibility Design Diversity Distance to Transit Density Economics Enhanced Revenues Reduce Costs and Environmental Impacts

31
Services Related to Densities/Intensities Fire, Parks, Schools Smaller service areas = cost savings Reduced public investment, reduced VMT

32
Status Quo Example Community ~2 du/acre/6 sq. miles Fire Station Elementary School Middle School High School 1/3 1/2 1/10 Transit Service Threshold Level Dwelling Unit Density Threshold Minimum4.50 – 5.99 du/acre High6.00 – 7.99 du/acre Very High≥ 8.00 du/acre

33
Maximize Allowable Density 4 du/gross acre/6 sq. Miles Fire Station Elementary School Middle School High School 1 2 1/2 Transit Service Threshold Level Dwelling Unit Density Threshold Minimum4.50 – 5.99 du/acre High6.00 – 7.99 du/acre Very High≥ 8.00 du/acre Transit Service Density Thresholds

34
Increase Allowable Density 8 du/gross acre/6 sq. miles Fire Station Elementary School/Parks Middle School High School 2 4 1 Transit Service Threshold Level Dwelling Unit Density Threshold Minimum4.50 – 5.99 du/acre High6.00 – 7.99 du/acre Very High≥ 8.00 du/acre Transit Service Density Thresholds 1

35
Opportunity for Public Investment Savings Public school sites Provide park amenities, reduce need other parks Proximity to residential increases walkability Fire station location Critical to response time

36
Collier County Fire Control Districts Fire District Number of Stations Population (2007) Coverage (Sq. Miles) Level of Service Millage Rate North Naples Fire794,16868.313,4531.0000 East Naples Fire582,85385.916,5711.5000 Golden Gate Fire473,233106.419,0581.5000 Isles of Capri Fire11,94313.41,9432.0000 Immokalee Fire219,273238.39,6373.0000 Big Corkscrew Fire317,125191.85,7093.5000 Ochopee Fire21,828822.79144.0000
 Level of Service Millage Rate North Naples Fire794, , East Naples Fire582, , Golden Gate Fire473, , Isles of Capri Fire11, , Immokalee Fire219, , Big Corkscrew Fire317, , Ochopee Fire21,")
37
Savings with Density: Better ISO rating – Lower Insurance Rates For a $150K Home Up to $600 Per Year Lower Assessment Rates Up to $100 to $200 per Year

38
Source: Center for Neighborhood Technology, Housing and Transportation Index (H+T Index) 20002008
")
39
Source: Center for Neighborhood Technology, Housing and Transportation Index (H+T Index) 2008
 2008")
40
Source: Center for Neighborhood Technology, Housing and Transportation Index (H+T Index) 2008
 2008")
41
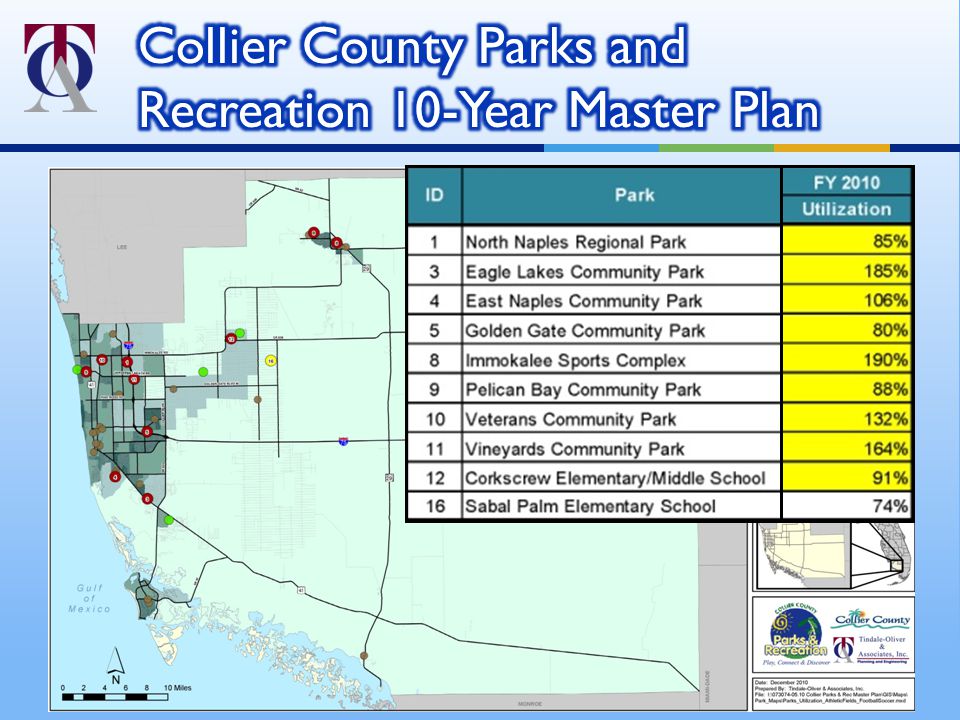
No Regional Park Presence Area of Future Growth

43
VMT Elasticity Variable Weighted Average Elasticity Density-0.04 Distance to Transit-0.05 Diversity-0.09 Design-0.12 Destination Accessibility-0.20 Source: Ewing and Cervero; “Travel and the Built Environment”

44
Transit Service Density Thresholds Transit Service Threshold Level Dwelling Unit Density Threshold Employment Density Threshold Minimum4.50 – 5.99 du/acre4. 00 – 5.99 employees/acre High6.00 – 7.99 du/acre5.00 – 6.99 employees/acre Very High≥ 8.00 du/acre≥ 7.00 employees/acre

45
Single Family Fee vs. Average Annual Growth Rate 10% Credit Maximum Impact Fee Area 3 County Avg. Area 1 Area 2 Avg. Level-of-Service Curve

46
Productive Revenues 1 Reduced Infrastructure Needs/Cost 2 Environmental Benefits 3 Communicating the Benefits 4

47
Environmental Benefits: Reduced Footprint Fewer Impacts on Habitat/Wetlands Reduced Travel/VMT Reduced Greenhouse Gases

48
Conceptual Illustration of Sub-Area Connectivity Test Road Network CountywideTest Sub-Area VMT*VHT**VMT*VHT** Baseline1,548,910495,075(105,277)(72,266) Enhanced Connectivity-4.8%25.9%-1.3%-9.8% *VMT = Vehicle Miles of Travel **VHT = Vehicle Hours of Travel
(72,266) Enhanced Connectivity-4.8%25.9%-1.3%-9.8% *VMT = Vehicle Miles of Travel **VHT = Vehicle Hours of Travel")
49
Potential TDR Area Limited services and infrastructure Transfer density to urban area Existing services and infrastructure Higher land values Protect watershed/habitat

50
Productive Revenues 1 Reduced Infrastructure Needs/Cost 2 Environmental Benefits 3 Communicating the Benefits 4

51
Marketing Your Program: General Public Quality of Service Reduce Costs Developers/Stakeholders Incentives Executions (Regulations)
")
52
Convergence Reduced Cost Increased Revenue Productive vs. New Revenues A “Plan” Land Use / Finance / Services

53
Diversity 5 “D”s 2 “E”s Environmental Energy Market Do You Have A “New Market”? Sell Your Plan

55
Okaloosa Dade (Miami) DuvalOrange Pasco Flagler Leon
 DuvalOrange Pasco Flagler Leon")
56
Okaloosa Duval Orange Pasco Flagler

57
Projected

60
Average Value of All Homes vs. New Homes Sale YearAll HomesNew Homes 2009$117k$178k 2010$107k$165k 2011$98k$182k Average Size of All Homes vs. New Homes Sale YearAll HomesNew Homes 20091,940 sf2,170 sf 20101,910 sf2,030 sf 20111,890 sf

61
Source: Center for Neighborhood Technology, Housing and Transportation Index (H+T Index) 20002008
")
62
Source: Center for Neighborhood Technology, Housing and Transportation Index (H+T Index) INSERT LEGEND
 INSERT LEGEND")
63
Source: Center for Neighborhood Technology, Housing and Transportation Index (H+T Index) INSERT LEGEND
 INSERT LEGEND")
64
VariableRuralSuburbanUrbanUrban Core Average Home Value$150,000 Annual Fire Station Exp$2,500,000 Population10,00020,00030,00040,000 Number of Homes4,0008,00012,00016,000 Insurance Premium per Home (ISO 9/10) $2,600 Insurance Premium per Home (ISO 5) $2,000 Insurance Savings$600 Less: Assessment per Home $375$188$125$94 Annual Savings per Home $225$412$475$506
 $2,600 Insurance Premium per Home (ISO 5) $2,000 Insurance Savings$600 Less: Assessment per Home $375$188$125$94 Annual Savings per Home $225$412$475$506")
Similar presentations


 Planned Villages / Communities Includes one (1) Town Center ~41,000 Planned Households.>")


 July 16 th, 2013.>")


