Download presentation
Presentation is loading. Please wait.

1
Using State-Level Performance Data: an Update on the National CIP Val Bradley and Sarah Taub Human Services Research Institute

2
How Did We Get Here? Initial concentration on rudiments of custodial care Evolution of programmatic standards that reflected growth in our understanding of people’s needs and our own expertise Increased concern about the efficacy of our interventions Attention to the outcomes of services and supports from the perspective of the customer

3
Signs of Change in Performance Management No longer just better than the institution Rooted in outcomes Emphasis on enhancement Changing role of the state Changes in experiences and expectations of families and consumers Changes in accreditation approaches Outcomes Expectations Inclusion

4
More Signs of Change Movement away from prescriptive standards Emphasis on CQI Collaborative development of standards Inclusion of customer satisfaction Satisfaction CQI Consensus

5
Changing Quality Landscape Exposure of fault-lines in the system (e.g., HCFA and the press) Expansion of supports to individuals on the waiting list Emergence of self-determination Olmstead decision Struggles with MIS applications Direct support staff shortages
 Expansion of supports to individuals on the waiting list Emergence of self-determination Olmstead decision Struggles with MIS applications Direct support staff shortages")
6
Emergence of Performance Indicators First appeared in behavioral and acute care Provide some “cues” for managing these complex systems Highlight impact of cost containment Illuminate what’s working Provide early warning signs

7
Characteristics of Performance Indicators Reflect major organizational or system goals. Address issues that can be influenced by the organization or system Have face validity Point a direction Reflect rates or major events Related to associated standards

8
Consumer Involvement in Assuring Quality Choice among providers/ purchasing decisions Designing and refining QA mechanisms Grievance/appeals process Consumer satisfaction surveys Membership on policy-making board “Consumer Reports”

9
Continuous Quality Improvement Leadership at the senior level Engagement of multiple constituencies Development of benchmarks Identification of change strategies Measurement of progress

10
Project Beginnings NASDDDS and HSRI collaboration Launched in 1997 Seven field test states + steering committee ~60 candidate performance indicators Development of data collection instruments

11
Current Participating States WA IN AZ UT NC IL IA OK VT WV KY PA MA DE RI CT MT WY NE HI Orange County WA IN AZ UT NC IL IA OK VT WV KY PA MA DE RI CT MT WY NE HI Orange County AL SD SC

12
What will CIP accomplish? Nationally recognized set of performance and outcome indicators for developmental disabilities service systems Benchmarks of performance Trend data at the state & national level Reliable data collection methods & tools

13
What are the Core Indicators? Consumer Outcomes: Satisfaction, choice, employment Provider Agency/Workforce Stability: Staff turnover System Performance Protection of Health and Safety

14
Data Sources Consumer Survey Family Surveys Family Support Survey (adult lives at home) Children/Family Survey (child lives at home) Guardian/Family Survey (adult lives out-of-home) Provider Survey DD System MIS (state-level)
 Children/Family Survey (child lives at home) Guardian/Family Survey (adult lives out-of-home) Provider Survey DD System MIS (state-level)")
15
Selected Findings 1999 and 2000 Data

16
Family Survey (2000)
")
17
Family/Guardian Survey (2000)
")
18
Children/Family Survey (2000) 84.7% of respondents choose the agencies or providers that work with their family some or most of the time 73.1% of families choose the support staff that work directly with their family (some or most of the time) 87.3% of respondents would like at least some control over the hiring and management of their support workers, yet only 67.2% feel they have “some” or more control over this hiring and management
 84.7% of respondents choose the agencies or providers that work with their family some or most of the time 73.1% of families choose the support staff that work directly with their family (some or most of the time) 87.3% of respondents would like at least some control over the hiring and management of their support workers, yet only 67.2% feel they have some or more control over this hiring and management")
19
Community Inclusion

20
Choice and Decision-Making

21
Consumer employment data (1999) Where people work: Duplicated counts Aggregate N = 3900 (11 states) 27.7% -- supported employment 21.7% -- group employment (enclave/crew) 40.4% -- facility-based employment 36.8% -- non-vocational day supports
 Where people work: Duplicated counts Aggregate N = 3900 (11 states) 27.7% -- supported employment 21.7% -- group employment (enclave/crew) 40.4% -- facility-based employment 36.8% -- non-vocational day supports")
22
Employment by state (1999)
")
23
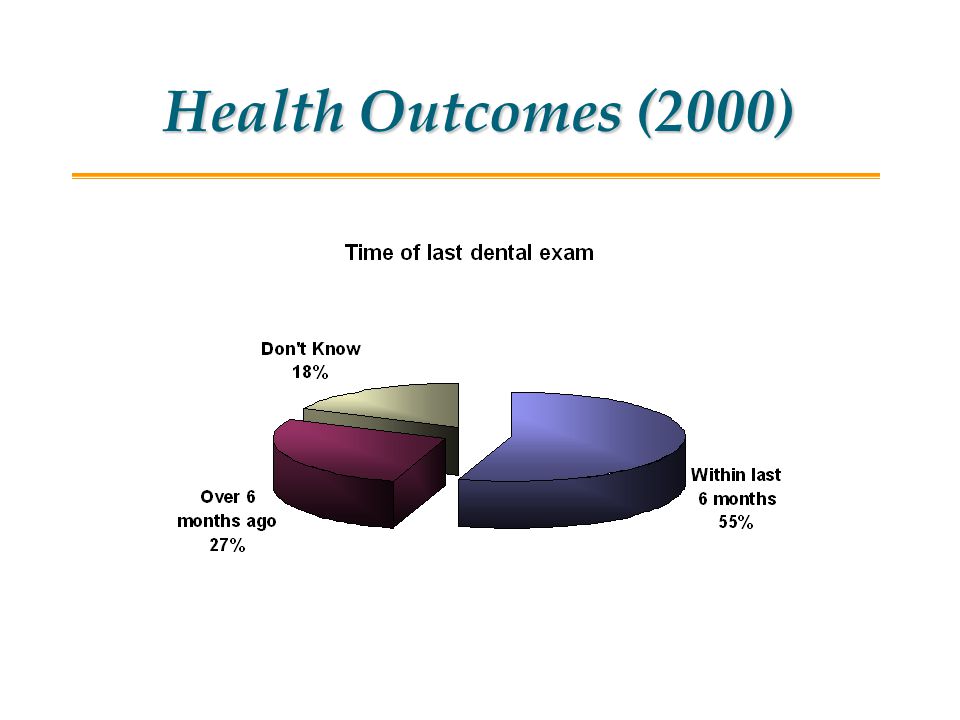
Health & Safety Outcomes Knowing how to file a grievance Feeling safe in your neighborhood Having checkups with doctor and dentist Being free from major/serious injuries Not taking psychotropic medications if you don’t need to Being safe from crime

24
Health Outcomes (2000)
")
27
Consumer Outcomes (2000) Access 79% of respondents reported that they almost always have a way to get where they want to go Safety 94% of respondents report feeling safe in their neighborhoods 96% report feeling safe at home
 Access 79% of respondents reported that they almost always have a way to get where they want to go Safety 94% of respondents report feeling safe in their neighborhoods 96% report feeling safe at home")
28
Rate of direct support turnover Average length of time on the job Vacancy rate Staff qualifications and competency considered but postponed; considered a staff survey Staff Stability

29
Staff Stability (1999) Day support providers report: Lower turnover Current staff have been employed longer About half as many vacant positions(both FT and PT) Both types of agencies report: Staff who left within the last year were employed on average about 19 months Part-time position vacancies are much higher than full- time position vacancies
 Day support providers report: Lower turnover Current staff have been employed longer About half as many vacant positions(both FT and PT) Both types of agencies report: Staff who left within the last year were employed on average about 19 months Part-time position vacancies are much higher than full- time position vacancies")
30
Staff Turnover (1999) Day Support Agencies 31.2% turnover (n=294) Separated staff employed average of 19.4 months (n=242) Current staff employed average of 40.3 months (n=290) Residential Support Agencies 35.2% turnover (n=283) Separated staff employed average of 19.5 months (n=259) Current staff employed average of 37.8 months (n=272)
 Day Support Agencies 31.2% turnover (n=294) Separated staff employed average of 19.4 months (n=242) Current staff employed average of 40.3 months (n=290) Residential Support Agencies 35.2% turnover (n=283) Separated staff employed average of 19.5 months (n=259) Current staff employed average of 37.8 months (n=272)")
31
Staff Vacancies (1999) Day Support Agencies 5.9% of full-time positions are vacant (n=222) 8.7% of part-time positions are vacant (n=167) Residential Support Agencies 9.9% of full-time positions are vacant (n=217) 18.9% of part-time positions are vacant (n=199)
 Day Support Agencies 5.9% of full-time positions are vacant (n=222) 8.7% of part-time positions are vacant (n=167) Residential Support Agencies 9.9% of full-time positions are vacant (n=217) 18.9% of part-time positions are vacant (n=199)")
32
Representation on Boards (1999) Across all providers reporting (N = 302) 3.2% of board members are consumers 19.0% of board members are family
 Across all providers reporting (N = 302) 3.2% of board members are consumers 19.0% of board members are family")
33
Board membership across states (1999) Consumer & Family Representation on Boards
 Consumer & Family Representation on Boards")
34
For more information… Visit HSRI’s website: www.hsri.org/cip/core.html

35
What Do You Do With the Information? Include at your web site Prepare annual reports Develop provider profiles Use with sister agencies Use in allocation decisions Use to spot red flags

36
Final Words “ Beware the Continuous Improvement of Things Not Worth Improving ” W. Edward Deming

Similar presentations


>")


