Download presentation
Presentation is loading. Please wait.

2
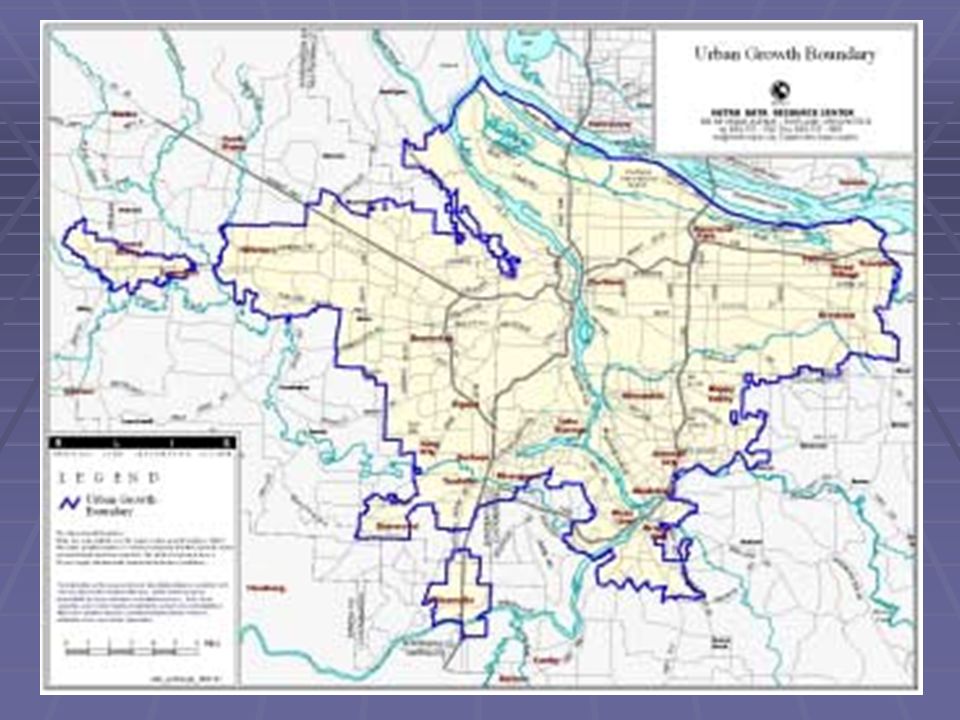
Urban Containment Increasing in Popularity Most common in fast-growth regions Intent to contain sprawl, minimize costs Too much land, urban sprawl Too little land, land price inflation Impacts depend on implementation

8
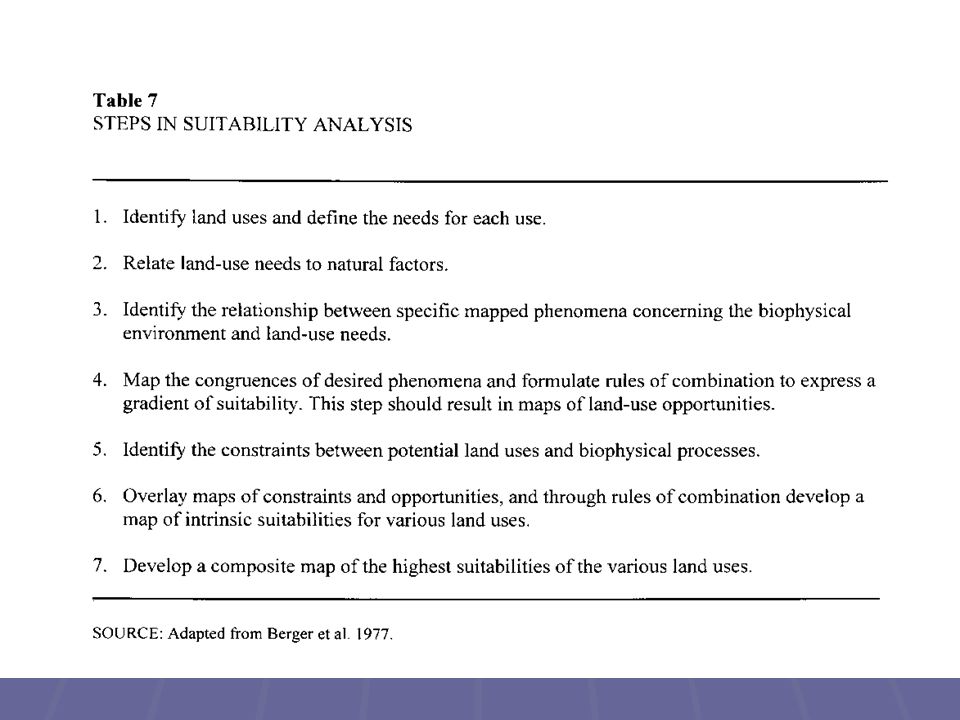
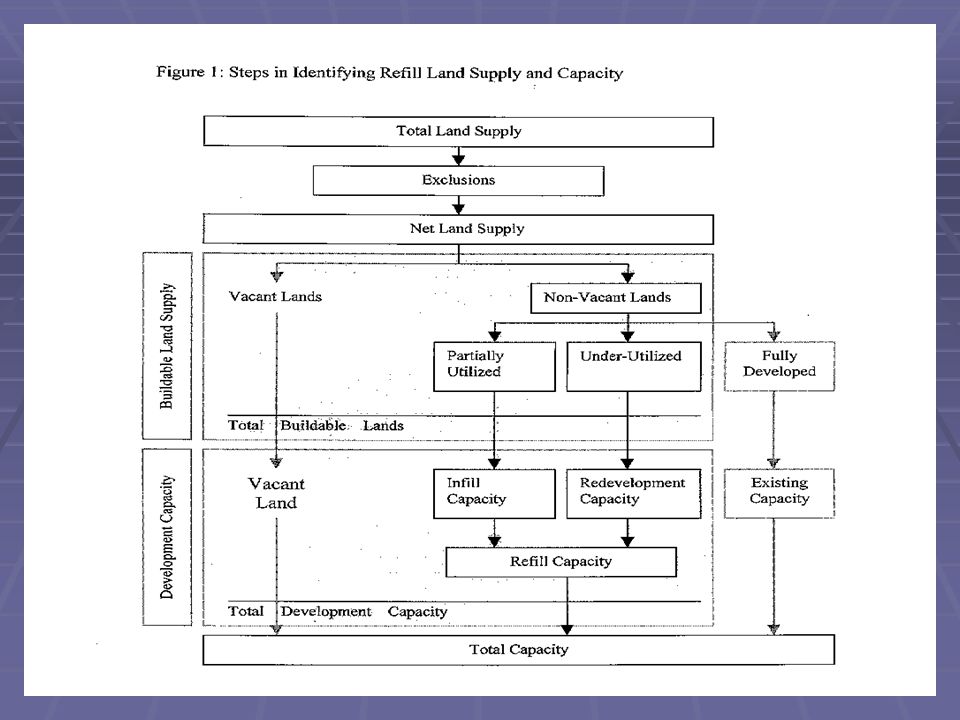
Steps in Identifying Development Capacity Gross Vacant Acres -environmentally constrained land -environmentally constrained land -publicly owned land -publicly owned land -platted lots -platted lots -streets, parks, schools, churches… -streets, parks, schools, churches… =Vacant Buildable Acres

9
Steps in Identifying Development Capacity, continued Vacant Buildable Acres - Unserviced land = Serviced Buildable Acres * Permitted Density = Vacant Land Capacity + Infill and plat Capacity + Redevelopment Capacity = Total Development Capacity

10
Identifying Vacant Land

11
One half acre rule

12
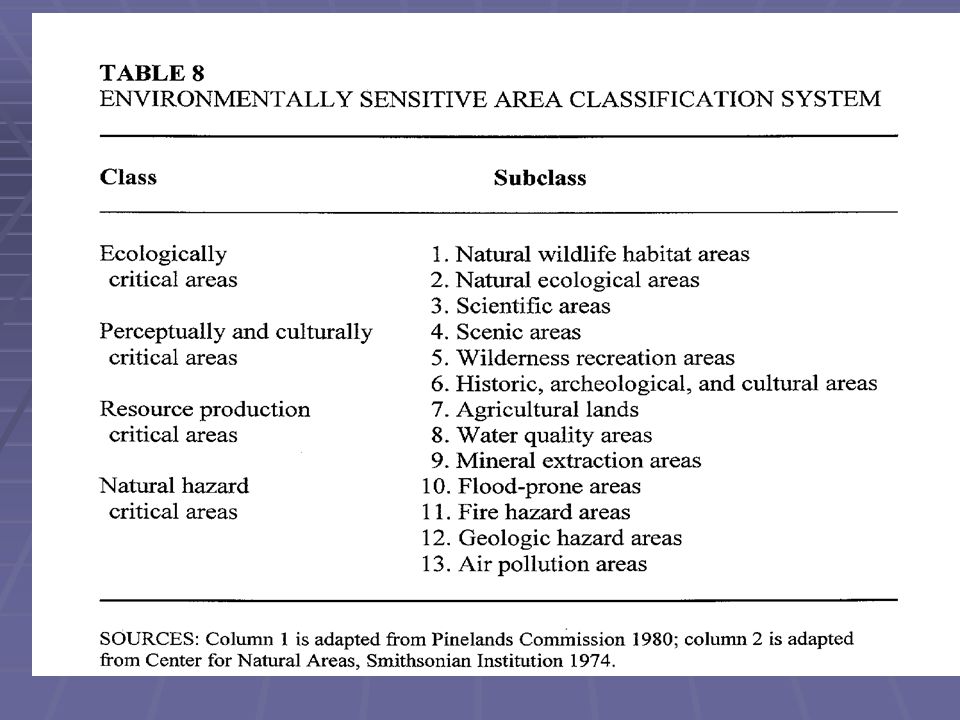
Identifying Environmental Constraints

16
Methods of Estimating Infill Remaining Capacity Historical Trends Assessed Land Values Land/housing value ratios Professional judgement

19
METRO UGB HISTORICAL LAND USE: CONSUMPTION: 1979 - 2001 Major Land Uses197919921994199519961997199820002001 Developed Land 146,719 173,537 179,501 182,173 184,757 186,777 188,763 191,795 193,260 Vacant Land 85,856 61,788 55,826 53,155 50,569 48,549 46,563 43,531 42,068 Total: 232,575 235,325 235,327 235,328 235,326 235,328 Vacant Land Detail197919921994199519961997199820002001 Residential Vacant 55,268 35,015 32,016 29,903 28,348 27,150 26,097 23,954 22,549 Nonresidential Vacant 14,788 17,045 15,503 15,014 14,289 13,934 13,133 12,646 12,496 Open Space, Agriculture,Rural Residential 7,982 715 626 633 682 375 242 263 349 Total Gross Buildable Acres 78,037 52,775 48,145 45,550 43,319 41,458 39,472 36,863 35,394 Constrained Acres: 7,819 9,013 7,681 7,605 7,250 7,091 6,668 Total Vacant Land 85,856 61,788 55,826 53,155 50,569 48,549 46,563 43,531 42,062

23
Press ESC to Exit Slide Show Maryland’s Best Tool for Electronic Property Map and Parcel Ownership Information Display and Analysis

Similar presentations


>")


 Development Trends More details:>")
