Download presentation
Presentation is loading. Please wait.

1
ECHOCARDIOGRAPHY IN MITRAL STENOSIS
Dr RAJESH K F

2
CAUSES AND ANATOMIC PRESENTATION
Rheumatic Commissural fusion Leaflet thickening Chordal shortening and fusion Superimposed calcification Degenerative MS Annular calcification Rarely leaflet thickening and calcification at base

3
Congenital MS Subvalvular apparatus abnormalities Inflammatory-SLE Infiltrative Carcinoid heart disease Drug induced valve disease Leaflet thickening and restriction Rarely commissural fusion

4
2D ECHO Commissural fusion PSAX echo scanning of valve
Important in distinguishing degenerative from rheumatic valve Complete fusion indicate severe MS Narrow diastolic opening of valve leaflets

5
Restricted mobility -PLAX
Early diastolic doming motion of the AML- restriction of tip motion

6
Leaflet thickening -PLAX

7
Chordal thickening, shortening and fusion –PLAX and A4C

8
Superimposed calcification

9
Dilated LA LA and LA appendage thrombus Paradoxical septal motion Dilated RV and RA

11
Wilkins score -Mitral valve score <8 are excellent candidates for BMV

12
Limitations of wilkin score
Assessment of commissural involvement is not included Limited in ability to differentiate nodular fibrosis from calcification. Doesn’t account for uneven distribution of pathologic abnormalities. Frequent underestimation of subvalvular disease. Doesn’t use results from TEE or 3D echo

13
Cormier’s method

14
3D ECHO TEE and TTE Higher accuracy than 2D echo
Detailed information of commissural fusion and subvalvular involvement MVA measurement in calcified and irregular valve MVA measurement after BMV Restenosis after commissurotomy commissural refusion valve rigidity with persistent commissural opening

15
From LA From LV

16
RT3DE score of MS severity

17
Total RT3DE score ranging from 0 to 31 points
Total score of mild MV involvement was defined as <8 points Moderate MV involvement 8–13 Severe MV involvement >14

18
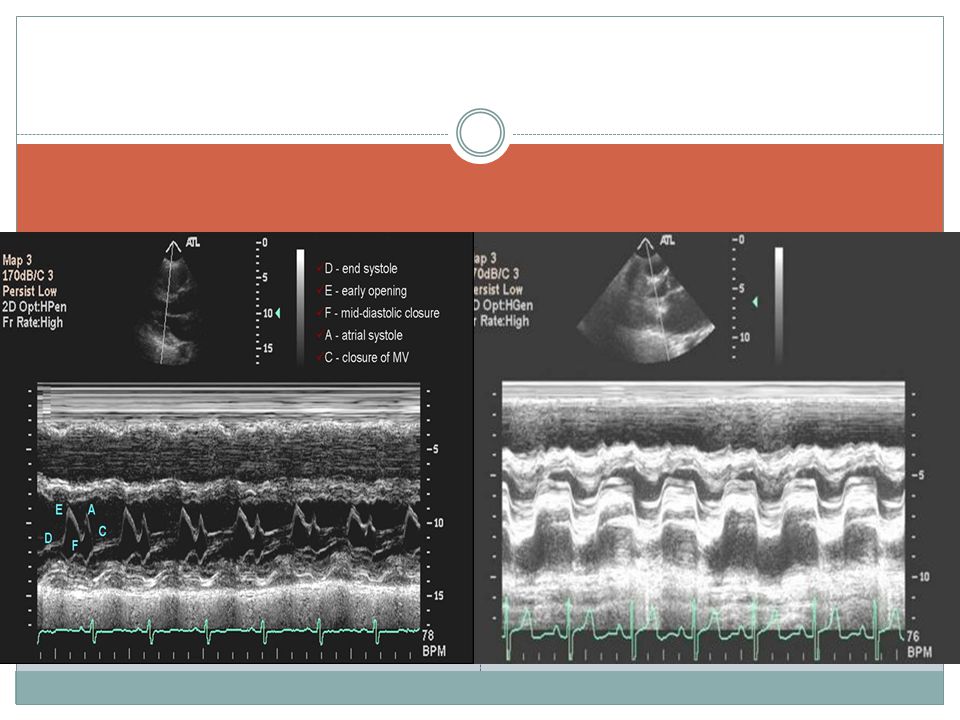
M MODE ECHO Decreased E-F Slope >80 mm/s MVA=4-6cm²
Thickened Mitral Leaflets Anterior Motion or Immobility of Posterior Mitral Leaflet-tethering at tips Diastolic Posterior Motion of Ventricular Septum (severity of stenosis)
")
20
TEE For diagnosis and quantification little yield
Spontaneous echo contrast LA and LA appendage thrombus Use of transgastric plane for evaluation of chordal structures Assessment of commissural calcification and fusion to predict procedural outcome after BMV

22
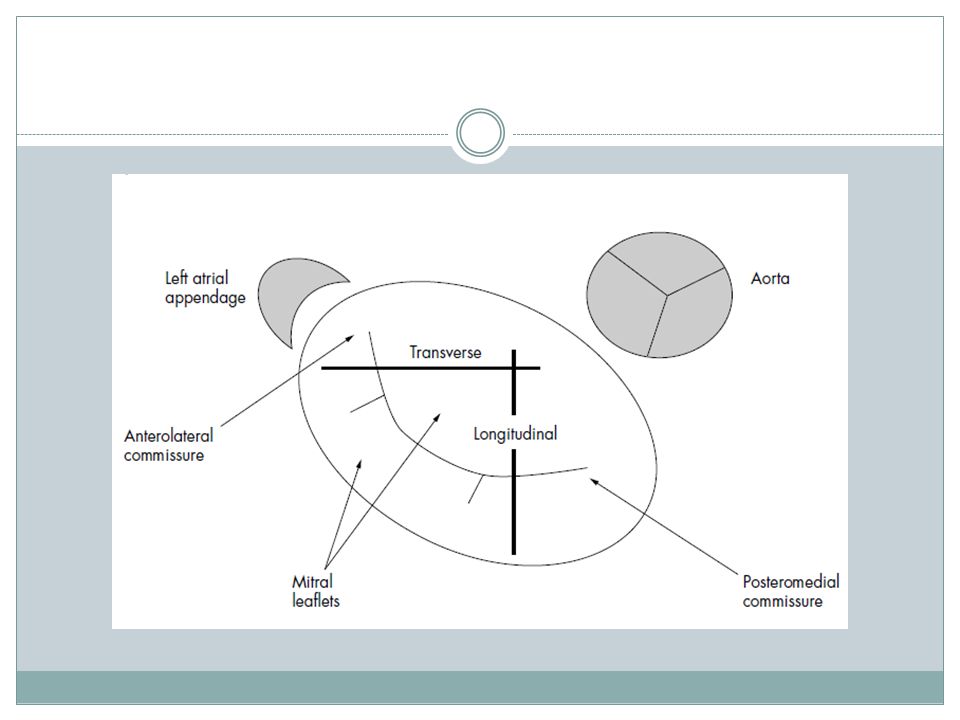
Commissure score NON CALCIFIED FUSION ANTEROLATERAL COMMISSURE
POSTEROMEDIAL COMMISSURE ABSENT PARTIAL 1 EXTENSIVE 2 TOTAL SCORE O TO 4

23
Scores for anterolateral and posteromedial commissures were combined such that each valve had an overall commissure score ranging from 0–4 A high score indicated extensively fused, non‐calcified commissures that were therefore more likely to split A low score indicated either minimal fusion or the presence of resistant commissural calcification

25
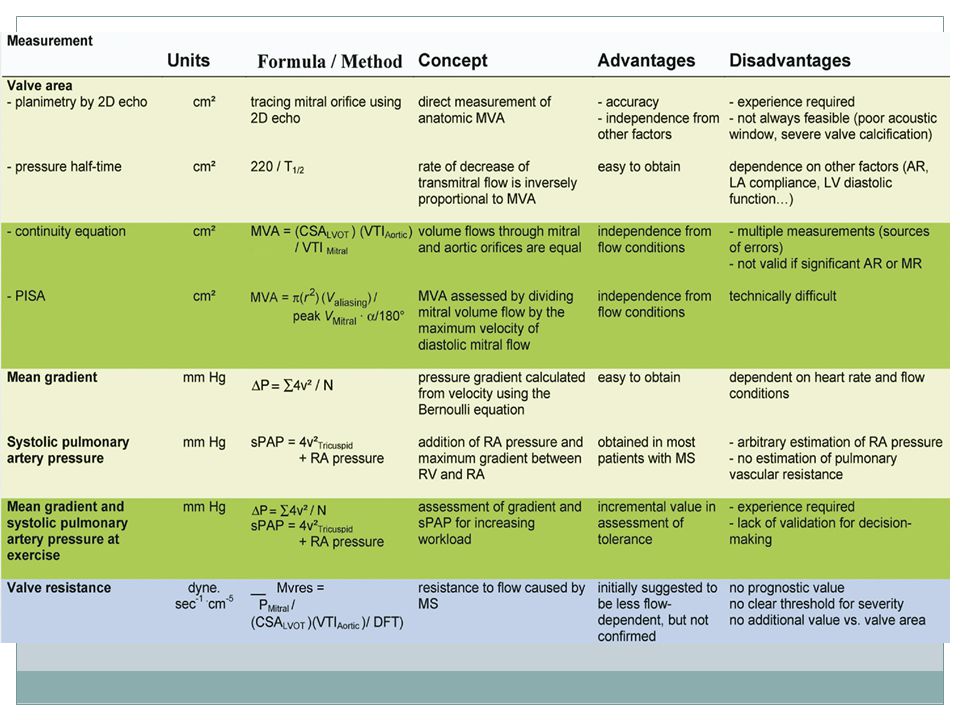
ASSESSMENT OF MS SEVERITY
2D OR 3D ECHO MVA BY PLANIMETRY DOPPLER PRESSURE GRADIENTS MVA BY PHT CONTINUITY EQATION PISA MITRAL VALVE RESISTANCE PASP

26
MVA BY PLANIMETRY 2D Echo Best correlation with anatomical area
Scanning method to avoid overestimation measured at leaflet tips in a plane perpendicular to mitral orifice Elliptical in shape Direct measure of mitral orifice including opened commissures in PSAX

28
Excessive gain setting may underestimate valve area
Zoom mode is better for delineation Harmonic imaging can improve planimetry measurement Optimal time is mid diastole obtained by cine loop mode on a frozen image Multiple measurements in AF or incomplete commissural fusion difficult in calcified valve,chest deformity and previous commissurotomy

29
Real time 3D echocardiography
identify true smallest orifice independent of its orientation most accurate ultrasound technique for measuring MVA, with a superior pre- and postprocedural agreement with the Gorlin’s derived MVA Less experience dependent and more reproducible

31
Mitral leaflet separation (MLS) index
Distance between the tips of the mitral leaflets in parasternal long-axis and four-chamber views it can be used as a semiquantitative method for the assessment of MS severity A value of 1.2 cm or more provided a good specificity and PPV for the diagnosis of non severe MS less than 0.8 cm -severe MS. It is not accurate in patients with heavy mitral valvular calcification and post BMV

33
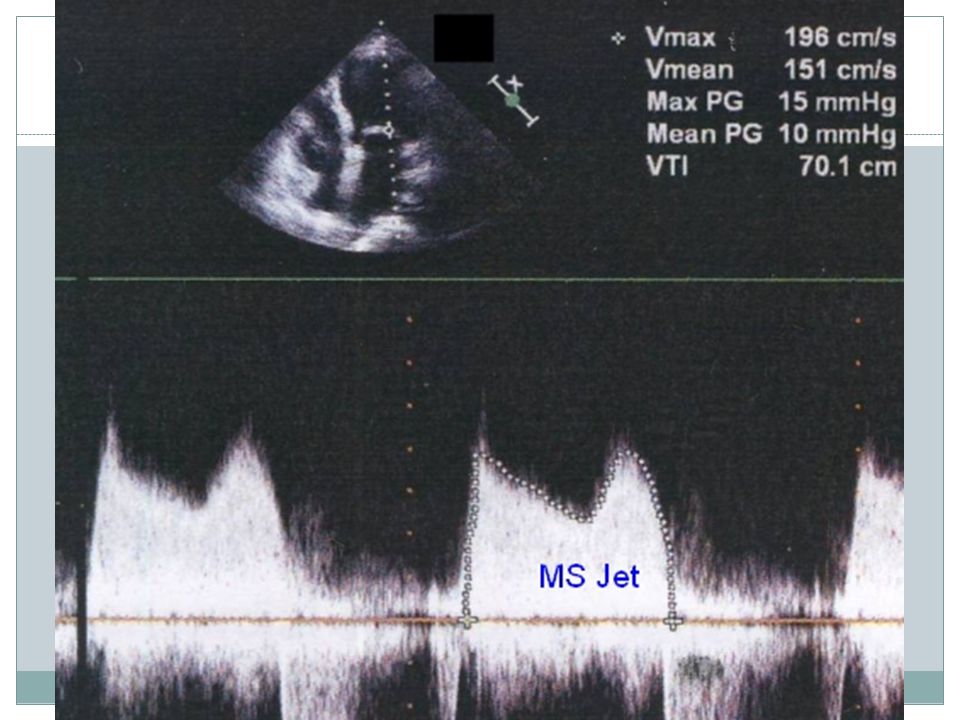
PRESSURE GRADIENT Apical window
CWD /PWD at or after tip of mitral valve Maximal and mean gradient Bernoulli equation( P =4V2) Derived from transmitral velocity flow curve Heart rate to be mentioned CD to identify eccentric mitral jet
 Derived from transmitral velocity flow curve. Heart rate to be mentioned. CD to identify eccentric mitral jet.")
35
Maximal gradient influenced by LA compliance and LV diastolic function
In AF average of 5 cycles with least variation of R-R interval and as close possible to normal HR MVG dependent on HR,COP and associated MR Tachycardia, increased COP and associated MR overestimates gradient Maximal gradient is markedly affected

36
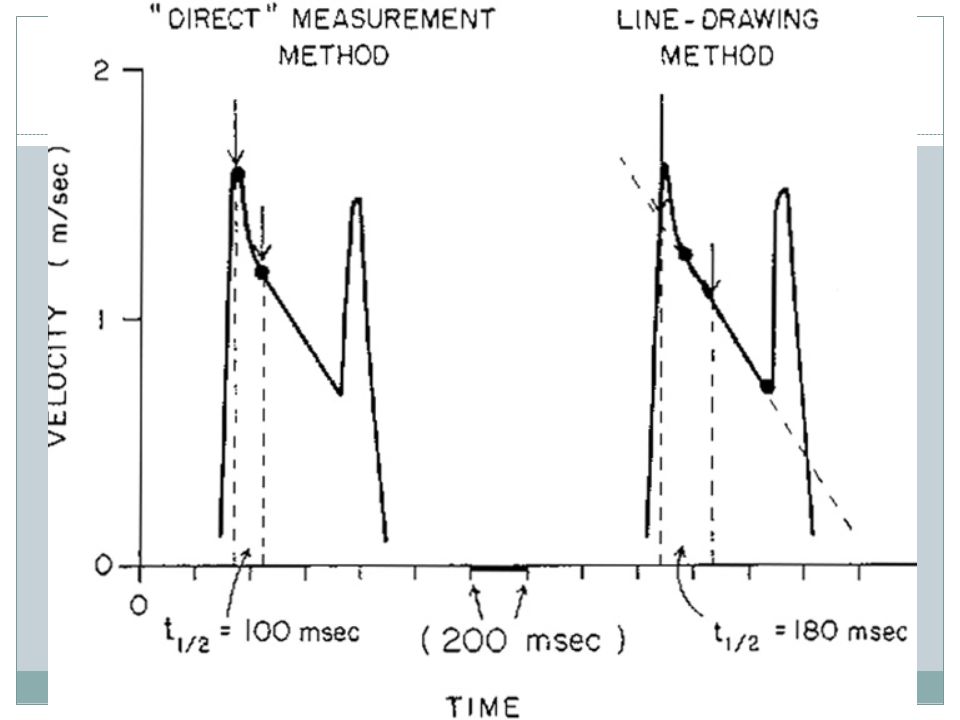
PRESSURE HALF TIME T1/2 is time interval in msecs between max mitral gradient in early diastole and time point where gradient is half max gradient Or it is the time when velocity falls to 1/1.414 peak PHT related to decceleration time PHT =.29x DT MVA=220/PHT

37
The empirically determined constant of 220 is proportional to the product of net compliance of left atrium and LV, and the square root of maximum transmitral gradient in a model that does not take into account active relaxation of LV

39
Obtained by tracing deceleration slope of E wave on Doppler spectral display
Concave not feasible If slope is bimodal deceleration slope in mid diastole rather than early diastole is traced

41
AF avoid short cycles and average different cardiac cycles

42
Less dependent on COP or coexistent MR
Useful when mean transmitral gradient is misleading MR -transmitral gradient overesimated Low COP –mean transmitral gradient -underestimated

43
MS MS+MR MR

44
Factors that may affect PHT by influencing LA pressure decline
More rapid LA pressure decline shorten PHT LA draining to second chamber –ASD LA pressure drop rapidly PHT shortened Stiff LA –low LA compliance

45
Factors affect PHT by influencing LV pressure rise
More rapid LV pressure rise shorten PHT If LV fills from a second source PHT –AR LV pressure rise more rapidly PHT will be shortened If LV is stiff-low ventricular compliance LV pressure may rise more rapidly

46
All factors affect PHT (ASD, AR, low LA or LV compliance )
shorten PHT Leads to overestimation of MVA Therefore PHT never under estimate MVA Therefore if PHT >220 MS is severe If PHT is < 220 consider other methods to assess severity

47
Prosthetic MVA Not been validated Affected mainly by DD More accurate method is continuity equation

48
Not reliable After BMV Normally LA and LV compliance counteract each other when gradient and compliance are subject to important and abrupt changes alter relation between PHT and MVA Upto 48 hrs post BMV

49
CONTINUITY EQATION LVOT AREA

50
MVA X VTI mitral= LVOT area X VTI aortic
MVA = LVOT area X VTI aortic VTI mitral MVA= p D X VTI aortic VTI mitral D is diameter of LVOT in CM and VTI in CM SV can be estimated from PA Method not useful in AF,AR or MR Useful in degenerative calcific MS

51
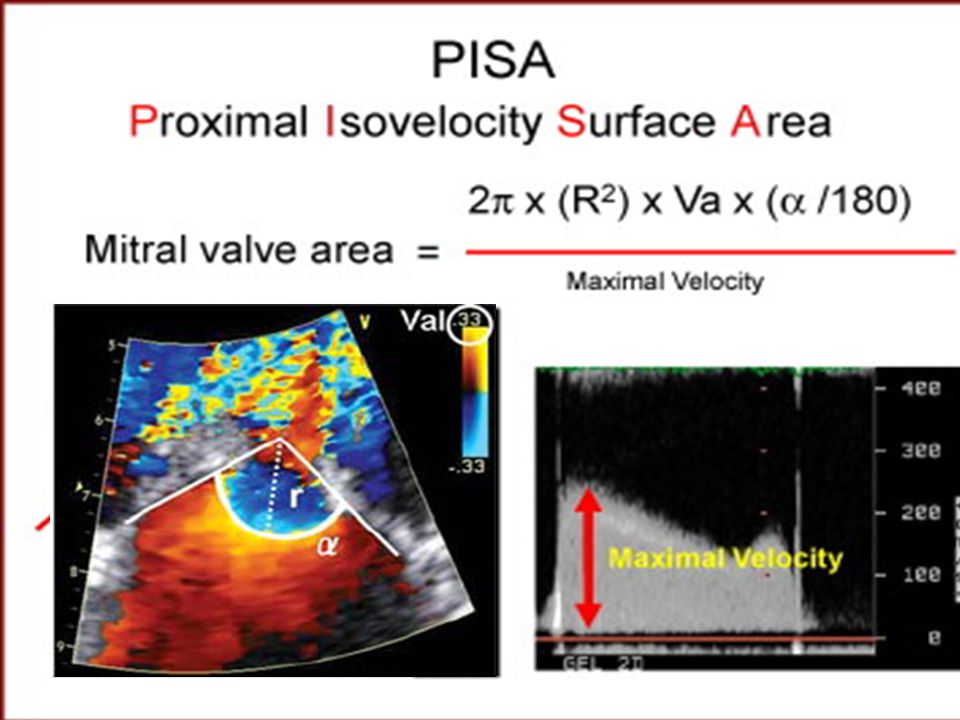
PISA Based on hemispherical shape of convergence of diastolic mitral flow on atrial side of mitral valve and flow acceleration blood towards mitral valve

52
MVA x MV = PISA x AV MVA = PISA x AV MV PISA = 2pr2 x a 180 MVA = 2pr2 x AV x a MV 180

53
Zoom on the flow convergence
Upshift the baseline velocity and use an aliasing velocity of 20–30 cm/s Measure the radius of the flow convergence region and the transmitral velocity at the same time in early diastole Measure the α angle formed by the mitral leaflets Use of a fixed angle value of 100° can provide an accurate MVA estimation in patients with MS.

55
Can be used in presence of significant MR, AR, differing heart rhythms
Not affected by LA,LV compliance Multiple measurements required M mode improves accuracy

56
Colour M-mode PISA Instantaneous measurement of MVA throughout diastole Under guidance of magnified 2D colour imaging, colour M-mode tracings were recorded by placing the M-mode cursor line through the centre of the flow convergence. Diastole was divided into four phases of equal duration: early, mid, mid-late, and late diastole. Peak radius of flow convergence was measured during each phase to calculate mitral flow rate

58
Each radius was measured from the red–blue aliasing level to the tip of the leaflet at the orifice
Colour M-mode analysis was then paired with continuous wave Doppler Three to five measurements of each variable (on matched cycle for colour M-mode and Doppler methods) were averaged, depending on the patient's rhythm. MVA was then calculated separately for each phase of diastole
 were averaged, depending on the patient s rhythm. MVA was then calculated separately for each phase of diastole.")
59
MITRAL VALVE RESISTANCE
MVR=Mean mitral gradient/ transmitral diastolic flow rate Transmitral diastolic flow rate= SV/DFP It correlate well with pulmonary artery pressure

60
PASP CWD Estimation of the systolic gradient between RV and RA
Multiple acoustic windows to optimize intercept angle Estimation of RAP according to IVC diameter

61
STRESS ECHOCARDIOGRAPHY
Useful to unmask symptoms in patients with MVA<1.5cm2 and no or doubtful complaints Discrepancy between resting doppler and clinical findings Semi-supine echocardiography exercise (30 to 60 secs of leg lifts) is now preferred to post exercise echocardiography Allows monitoring gradient and pulmonary pressure in each step of increasing workload
 is now preferred to post exercise echocardiography. Allows monitoring gradient and pulmonary pressure in each step of increasing workload.")
62
Mean mitral gradient and PASP to be assessed during exercise
Mean gradient >15 mmhg with exercise is considered severe MS A PASP > 60 mmHg on exercise has been proposed as an indication for BMV Dobutamine stress echo mean gradient >18 mmhg with exercise is considered severe MS

63
Associated lesions Quantitation of LAE Associated MR and its mechanism
Severity AS (underestimated) AR- t1/2 method to assess MS is not valid TR ,tricuspid annulus Secondary pulmonary HTN-TR
 AR- t1/2 method to assess MS is not valid. TR ,tricuspid annulus. Secondary pulmonary HTN-TR.")
64
GRADING OF SEVERITY OF MS
MILD MODERATE SEVERE SPECIFIC VALVE AREA(cm2) >1.5 1-1.5 <1 NONSPECIFIC MEAN GRADIENT (mmHg) <5 5-10 >10 PASP (mmHg) <30 30-50 >50
 > <1. NONSPECIFIC. MEAN GRADIENT. (mmHg) < >10. PASP (mmHg) < >50.")
67
THANK U

68
1 Pressure half time in MS affected by all except
A ASD B MR C AR D HOCM

69
2 In case of a pure MS transmitral mean gradient is mmhg and mitral area by planimetry is 1.1cm2 it is graded as A severe B moderate C mild D indeterminate

70
3 Commissural fusion is not a feature of MS in
A RHD B Calcific MS C SLE D Carcinoid disease

71
4 Not included in Wilkins score is
A commissural fusion B restricted mobility C leafllet thickening D subvalvular fusion

72
5 harmonic imaging useful in
A 2D MVA B PHT C PISA D M mode

73
6 mitral leaflet separation index less than ----cms indicate severe MS
B 0.6 C 0.8 D 0.2

74
7 continuity equation useful in MVA calculation in
A AF B AR C MR D Calcific MS

75
8 Mean gradient greater than ---- mmhg with exercise echocardiography is considered severe MS
B 12 C 15 D 18

76
9 In a case of severe AR with MS mitralPHT obtained is 280 severity of MS is
A mild B moderate C severe D none of the above

77
10 Method to assess severity of MS in diastolic dysfunction is
A PHT B PISA C continuity equation D mitral valve resistance

78
1 Pressure half time in MS affected by all except
A ASD B MR C AR D HOCM

79
2 In case of a pure MS transmitral mean gradient is mmhg and mitral area by planimetry is 1.1cm2 it is graded as A severe B moderate C mild D indeterminate

80
3 Commissural fusion is not a feature of MS in
A RHD B Calcific MS C SLE D Carcinoid disease

81
4 Not included in Wilkins score is
A commissural fusion B restricted mobility C leafllet thickening D subvalvular fusion

82
5 harmonic imaging useful in
A 2D MVA B PHT C PISA D M mode

83
6 mitral leaflet separation index less than ----cms indicate severe MS
B 0.6 C 0.8 D 0.2

84
7 continuity equation useful in MVA calculation in
A AF B AR C MR D Calcific MS

85
8 Mean gradient greater than ---- mmhg with exercise echocardiography is considered severe MS
B 12 C 15 D 18

86
9 In a case of severe AR with MS mitralPHT obtained is 280 severity of MS is
A mild B moderate C severe D none of the above

87
10 Method to assess severity of MS in diastolic dysfunction is
A PHT B PISA C continuity equation D mitral valve resistance

89
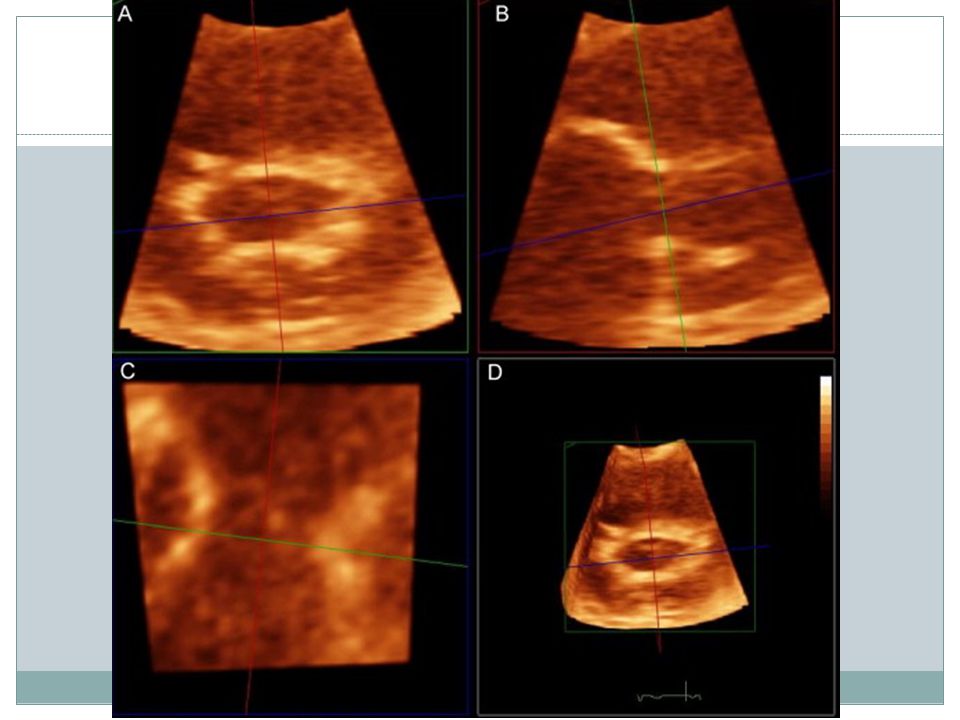
3D echo planimetry Mitral valve area measurement using anyplane echocardiography.

90
allows on-line assessment of the mitral valve area.
Images are displayed as two simultaneous intersecting orthogonal long-axis scans (B-mode scans) and two perpendicular short-axis scans (C-mode scans) These C-mode scans allow the display of short-axis views of the mitral valve from an apical transducer position
 and two perpendicular short-axis scans (C-mode scans) These C-mode scans allow the display of short-axis views of the mitral valve from an apical transducer position.")
92
9 Usual mitral valve angle in PISA method to assess severity of MS is ----degree
B 100 C 150 D 180

Similar presentations


 Continuous Wave 2) Pulse Wave 3) Color Flow DOPPLER ULTRASOUND.>")
. - a spherical occluder is contained by metal.>")


 FOR MITRIAL REGURGITATION>")
